

1 引言
1978年改革开放以来,中国社会经济发展迅速,但伴随着工业化、城镇化和农业现代化的加速发展,存在长期对资源的不合理利用,导致生态系统严重退化。1998年11 月,国务院通过了《全国生态环境建设规划》,明确用大约50年时间,完成一批对改善全国生态环境有重要影响的工程,扭转生态环境恶化的势头。为了实现上述目标,中国政府陆续启动了天然林资源保护、退耕还林、三北防护林体系建设(第四期和第五期)、京津风沙源综合治理、长江防护林体系建设(第二期、第三期)、西南岩溶石漠化综合治理(2005年启动)、退牧还草(2003年启动)等一系列重大生态工程[1]。据不完全统计,截至2019年,中国重大生态工程的总投资已经超过17000亿元[2]。为评估重大生态工程实施20年的生态效益,本文提出了重大生态工程生态效益评估指标、指标获取技术和评估方法,并开展了定量评估。
国际上,联合国在2000年发起并开展了千年生态系统评估(MA)[3],首次提出了生态系统评估框架体系与指标体系,研究了生态系统状况和服务、变化驱动力的评估方法,评估了生态系统服务变化及其对人类福祉的影响。MA的生态系统评估框架在国内外生态系统评估中得到了广泛的应用,但MA的评估指标是针对生态系统服务功能,评估方法主要以文献资料综述为主的定性判断。加拿大学者采用专家打分法开展了战略性生态恢复评估,对退化森林生态系统实施生态工程后恢复治理的优先顺序进行了排序,但缺少对工程生态效益的量化评估[4]。美国农业部实施的生态保护效果评估项目,采用了工程区内外对比、工程实施前后对比等方法,对生态保护工程的效果进行了评价,但未开展生态恢复潜力评估[5]。国际林业研究中心评估了15个国家的REDD+(减少森林砍伐和森林退化造成的温室气体排放)战略的森林保护项目实施效果,评估了生态工程对碳蓄积的贡献,但缺少评估生态工程对其他生态服务的影响[6]。欧盟采用了参与式评价方法,评估了12个国家防沙治沙工程措施的有效性,对防沙治沙工程的生态效益未进行量化评估[7]。
在国内,刘纪远等[8]运用MA框架,最早开展了中国西部地区生态系统综合评估。Ouyang等[9]建立了区域生态系统服务的定量评价方法,以及综合生态系统服务功能量与受益人口数量的区域生态保护重要性评估方法。吴丹等[10]以生态系统宏观结构、植被覆盖度及防风固沙服务为指标,采用线性回归方法分析植被覆盖度和防风固沙服务功能量的变化特征,综合分析了2000—2010年京津风沙源综合治理一期工程的生态效应。刘国彬等[11]利用土地利用类型、植被覆盖、土壤水分、土壤侵蚀、径流泥沙等指标,对黄土高原水土保持和生态治理的效果进行了评价。但以上学者均未对生态系统恢复程度与恢复潜力开展研究,并且没有厘定生态工程与气候因素对生态系统变化的贡献率。邵全琴等[12]选取了生态系统结构、生态系统质量和生态系统服务等评估指标,对三江源生态保护和建设一期工程的生态成效进行了评估,并提出模型参数控制法厘定了生态工程和气候对三江源生态系统变化的影响。黄麟等[13]通过对比平均气候状况和真实气候状况下的生态服务量,厘定了气候变化、生态工程等人类活动对工程区生态系统变化的作用。Cai等[2]利用植被归一化指数(NDVI)、总初级生产力(GPP)、叶面积指数(LAI)、土地利用和气候因子为指标,评估了1978—2015年生态工程对中国北方干旱和半干旱地区植被恢复的贡献。以上学者在生态工程生态效益评估中,厘定了生态工程和气候对生态恢复的贡献率,但未对生态恢复程度和恢复潜力进行评估。目前的研究更多针对某一区域或工程,缺少对于国家尺度范围和长时间序列的完整的重大生态工程实施生态效益评估研究。
本文在提出生态效益评估理论框架的基础上,选取了生态系统宏观结构、生态系统质量和生态系统服务3个大类、6个一级指标和9个二级指标,利用地面和遥感数据,结合模型模拟,生成了2000—2019年长时间序列评估指标参数数据集,定量评估了重大生态工程实施20年生态恢复程度和恢复潜力,以及生态工程对生态系统变化的贡献率。
2 数据与方法
2.1 重大生态工程实施范围
图1
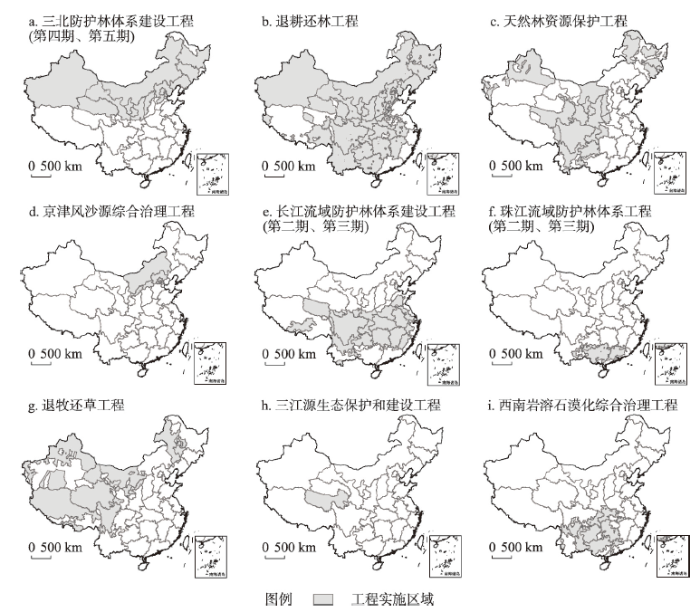
图1
中国主要重大生态工程空间分布
注:该图基于自然资源部标准地图服务网站GS(2020)4619号标准地图制作,底图边界无修改,后图同。
Fig. 1
Spatial distribution of key ecological projects in China
图2
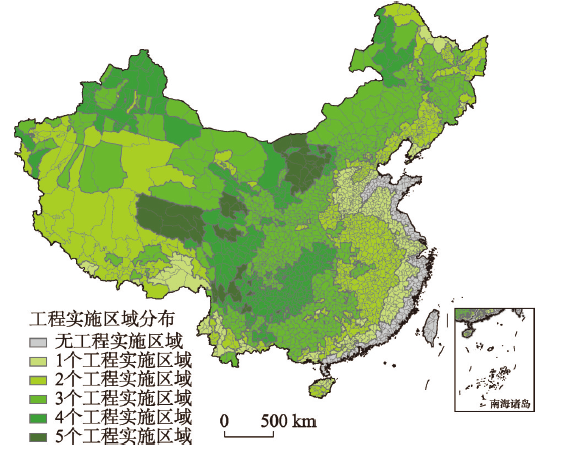
图2
中国9个重大生态工程实施区域叠加分布
Fig. 2
Spatial overlay of nine key ecological projects in China
表1 中国9个重大生态工程实施重叠数量及面积统计
Tab. 1
| 序号 | 工程数量(个) | 面积(万km2) | 中国陆地面积占比(%) |
|---|---|---|---|
| 1 | 0 | 35.2 | 3.7 |
| 2 | 1 | 78.8 | 8.2 |
| 3 | 2 | 282.1 | 29.4 |
| 4 | 3 | 336.9 | 35.1 |
| 5 | 4 | 168.4 | 17.5 |
| 6 | 5 | 58.7 | 6.1 |
2.2 重大生态工程实施20年生态效益评估指标
本文综合分析了中国9个重大生态工程的规划生态治理目标,主要是通过保护现有植被,增加植被覆盖度,改善生态系统质量,提高水源涵养、土壤保持和防风固沙等生态系统服务功能。在遵循评估指标的可操作性、实用性、科学性和针对性的原则基础上和遥感数据的可获取性,根据重大生态工程规划生态治理目标,最终选取了生态系统宏观结构、生态系统质量、生态系统服务3个大类、6个一级指标、9个二级指标,用于重大生态实施20年生态效益的评估(表2)。
表2 重大生态工程实施20年生态效益评估指标
Tab. 2
| 类别 | 评估指标 | |
|---|---|---|
| 一级指标 | 二级指标 | |
| 生态系统宏观结构 | 各类生态系统面积 | 生态系统分类面积 |
| 变化率 | ||
| 生态系统质量 | 植被净初级生产力 | 植被净初级生产力 |
| 植被覆盖度 | 植被覆盖度 | |
| 生态系统服务 | 水源涵养 | 水源涵养量 |
| 土壤保持 | 土壤水蚀模数 | |
| 土壤保持量 | ||
| 防风固沙 | 土壤风蚀模数 | |
| 防风固沙量 | ||
2.3 评估指标参数数据获取与验证
2.3.1 生态系统宏观结构数据遥感获取与验证
2.3.2 生态系统质量数据获取与验证
(1)植被覆盖度(FVC)
利用2000—2019年时间分辨率为16 d、空间分辨率为250 m的MODIS遥感产品NDVI数据,经S-G滤波后,通过像元二分法计算得到时间分辨率为16 d的植被覆盖度数据,然后采用最大合成法生成了年植被覆盖度。经重采样生成2000—2019年1 km分辨率的年植被覆盖度。
(2)植被净初级生产力(NPP)
直接采用MODIS的MOD17A3产品,时间分辨率为1 a,空间分辨率为500 m。利用课题组积累的历年野外调查获取的168个草地样方生物量数据[17],以及源于中国生态系统研究网络(CERN)长期动态监测数据库的中国典型森林生态系统生产力数据集,对MODIS NPP数据进行了精度验证,R2为0.75。经重采样生成2000—2019年1 km分辨率的植被净初级生产力数据集。
2.3.3 生态系统服务估算与验证
(1)水源涵养服务量
生态服务水源涵养量利用水量平衡法计算,公式如下:
式中:
降水量空间数据的获取:利用国家气象站观测数据,使用AUNSPLINE软件插值为1 km分辨率降水量空间数据;然后,将之与国家气象信息中心提供的0.25°×0.25°降水量栅格数据数据进行融合,生成2000—2019年1 km分辨率降水量空间数据集。
地表径流利用径流系数乘以降水量获得。不同土地利用类型、不同土壤类型的径流系数,采用美国农业部土壤保持局开发的SCS水文模型计算得到[18]。
(2)土壤保持服务量
生态系统土壤保持量是裸土状况下的潜在土壤水蚀量与真实植被状态下的土壤水蚀量的差值。水蚀模数采用修正通用水土流失方程(RUSLE)[25],公式如下:
式中:A为土壤水蚀模数(t hm-2 a-1);R为降雨侵蚀力因子(MJ mm hm-2 h-1 a-1);K为土壤可蚀性因子(t hm2 h hm-2 MJ-1 mm-1);LS为坡度坡长因子;C为覆盖和管理因子,取值范围为0~1;P为水土保持措施因子,取值范围为0~1。模型参数的计算方法详见参考文献[26]。
(3)防风固沙服务量
生态系统防风固沙量是裸土条件下的潜在土壤风蚀量与实际植被状况下土壤风蚀量之间的差值。风蚀模数采用修正风蚀方程(RWEQ)计算[30],公式如下:
式中:SL为土壤风蚀模数(kg m-2);X为地块长度(m);
本文利用RWEQ模型估算的风蚀模数与基于风洞试验所得风蚀预报经验模型[31]估算结果对比,R² = 0.40。最终生成2000—2019年1 km分辨率的防风固沙服务数据集。
2.4 重大生态工程实施20年生态恢复程度和恢复潜力评估方法
2.4.1 生态恢复态势和恢复程度评估方法
恢复态势为单个指标两时段的连续变化趋势。本文采用最小二乘法计算,分别计算2000—2010年、2010—2019年两时段内生态系统质量(植被覆盖度、植被净初级生产力)和生态系统服务(水源涵养、土壤保持、防风固沙)的变化斜率P(P > 0.05判定为转好,-0.05 ≤ P ≤ 0.05判定为基本稳定,P < -0.05判定为转差;侵蚀模数和风蚀模数相反)。并依据表3判断2000—2019年生态系统质量和生态系统服务的生态恢复态势。
表3 生态系统质量和服务恢复态势判别依据
Tab. 3
| 判别依据 | 判别结果 | |
|---|---|---|
| 2000—2010年 | 2010—2019年 | 2000—2019年总体恢复态势 |
| 转好 | 转好 | 持续转好 |
| 转差 | 转差 | 持续转差 |
| 基本稳定 | 基本稳定 | 持续稳定 |
| 转好 | 转差 | 先转好后转差 |
| 转好 | 基本稳定 | 先转好后稳定 |
| 转差 | 转好 | 先转差后转好 |
| 转差 | 基本稳定 | 先转差后稳定 |
| 基本稳定 | 转好 | 先稳定后转好 |
| 基本稳定 | 转差 | 先稳定后转差 |
表4 生态恢复程度判断依据
Tab. 4
| 生态恢复程度 | 判断条件 |
|---|---|
| 基本稳定 | Si ≥ 3 |
| 有所转差 | Si < 3 & Wi = 2 |
| 较明显转差 | Si < 3 & Wi = 3 |
| 明显转差 | Si < 3 & Wi ≥ 4 |
| 恢复程度高 | Bi ≥ 4 |
| 恢复程度较高 | Bi = 3 |
| 恢复程度中等 | Si < 3 & Wi < 2 & Bi = 2 |
| 部分要素恢复与部分要素转差 | Si < 3 & Wi < 2 & Bi = 1 |
注:Wi表示转差的指标个数,Bi表示转好的指标个数,Si表示基本稳定的指标个数,i ≤ 5。
2.4.2 基于“地带顶极生态本底—生态现状—生态恢复潜力”的生态恢复潜力评估方法
图3

图3
中国生态地理分区与自然保护区空间分布
Fig. 3
Spatial distribution of ecological geographical regions and nature reserves in China
本文将国家级和省级自然保护区内的生态系统视为优良生态系统,将其作为同一生态地理区同一生态系统类型的顶极生态本底。国家级和省级自然保护区(图3)来源于地球系统科学数据共享网(
本文将2000—2019年植被覆盖度与生态地理分区和自然保护区进行叠加,分别提取各生态地理分区中自然保护地内的森林、草地和荒漠生态系统的植被覆盖度,与温度和降水建立二元线性回归方程。为避免和减少气候波动导致的各年之间的误差,选择2017—2019年的平均温度、降水进行计算,得到该时段内森林、草地和荒漠生态系统的顶极植被覆盖度模拟值,并与2000—2019年的植被覆盖度数据比较,若顶极值模拟值小于实际值,则将实际值替代顶极值模拟值,并得到最终的顶极本底数据。
将2017—2019年平均植被覆盖度作为生态现状实际值,将顶极值减去实际值,得到计算植被覆盖度的恢复潜力(差距)。植被覆盖度恢复潜力指数则用以下公式计算:
式中:ERPI为工程区生态恢复潜力指数;ERt为地带顶级生态本底值;ERc为生态恢复现状值。生态恢复潜力指数越大,则生态恢复潜力越大。
2.5 生态系统变化的生态工程贡献率厘定方法
残差分析法:残差是指观测值与预测值(拟合值)之间的差。采用多元回归残差分析方法能够将气候、人类活动对植被覆盖度的影响分离出来,可以定量化反映人类活动对植被覆盖度的影响。
模型参数控制方法:利用生态系统质量和服务物质量估算方程,控制方程中的气候参数(温度、降水、风速等),分别估算真实气候情况下和固定气候情况下的生态系统服务数据。通常认为,真实气候情况下的计算结果是同时受气候波动和人类活动(主要是生态工程)的共同影响,而固定气候情况下的计算结果只受人类活动(主要是生态工程)的影响。
3 结果分析
3.1 生态系统时空变化
3.1.1 生态系统宏观结构变化分析
在2000—2010年与2010—2018年两个时段内,陆地生态系统宏观结构总体稳定,聚落生态系统面积持续明显增加,草地、农田和荒漠生态系统面积持续减少,森林面积先增后减。2000—2018年,聚落生态系统面积净增加了5.2万km2,草地生态系统面积净减少了2.7万km2,农田生态系统面积净减少1.7万km2,荒漠生态系统面积净减少1.0万km2(图4)。
图4
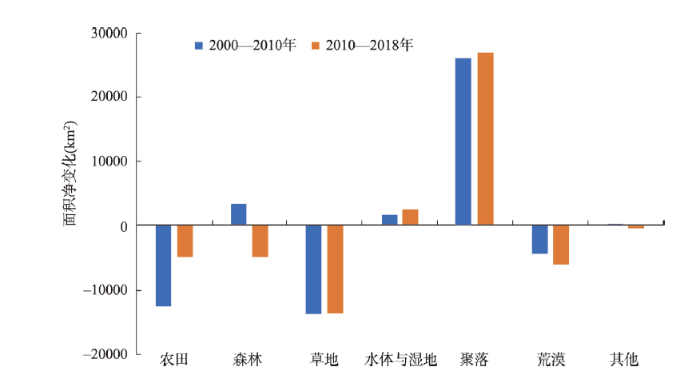
图4
2000—2010年和2010—2018年中国生态系统宏观结构面积净变化
Fig. 4
Changes in ecosystem macro structure area in China in two periods (2000-2010 and 2010-2018)
3.1.2 生态系统质量时空变化
图5
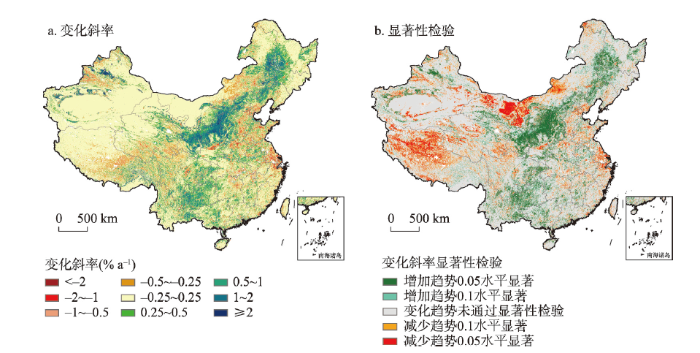
图5
2000—2019年中国植被覆盖度变化斜率及其显著性检验空间分布
Fig. 5
Distribution of changes in the slope of FVC in China and its significance test in 2000-2019
2019年平均植被净初级生产力353.0 g C m-2 a-1,高于2000—2019年的平均值335.2 g C m-2 a-1。2000—2019年植被净初级生产力平均变化速率为2.4 g C m-2 a-1,总体稳定增加、局部减少。植被净初级生产力增加的区域主要分布在北方农牧交错带地区、四川盆地东部和大兴安岭地区,其中黄土高原区增加最为显著;减少的区域主要分布在西藏南部和广东、福建、云南等地(图6)。对植被净初级生产力斜率进行显著性检验,减少趋势和增加趋势通过0.05水平显著性检验的面积占比分别为0.7%和29.8%,未通过显著性检验的面积占比为49.7%。
图6
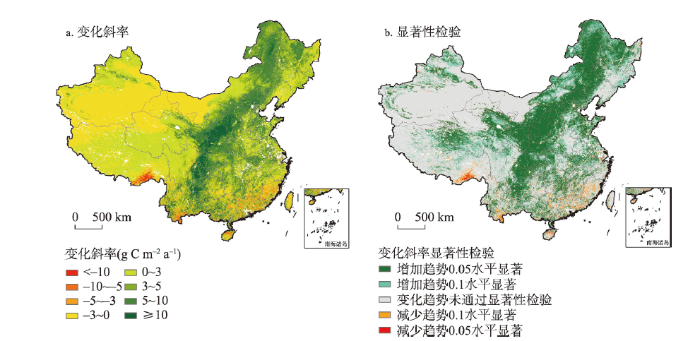
图6
2000—2019年中国NPP变化斜率及其显著性检验空间分布
Fig. 6
Distribution of changes in the slope of NPP in China and its significance test in 2000-2019
3.1.3 生态系统服务时空变化
表5 中国生态系统服务年均值统计表
Tab. 5
| 生态系统服务 | 2000—2010年 | 2010—2019年 | 2000—2019年 | |
|---|---|---|---|---|
| 水源涵养 | 单位面积水源涵养量(m3 hm-2 a-1) | 2105.0 | 2099.1 | 2083.4 |
| 水源涵养总量(×108 m3 a-1) | 17979.9 | 17929.4 | 17795.7 | |
| 土壤保持 | 单位面积土壤水蚀模数(t hm-2 a-1) | 14.5 | 10.9 | 12.8 |
| 土壤水蚀量(×108 t a-1) | 103.4 | 78.1 | 91.3 | |
| 单位面积土壤保持量(t hm-2 a-1) | 33.0 | 46.4 | 39.2 | |
| 土壤保持总量(×108 t a-1) | 235.7 | 331.6 | 280.0 | |
| 防风固沙 | 单位面积土壤风蚀模数(t hm-2 a-1) | 25.1 | 17.6 | 21.5 |
| 土壤风蚀量(×108 t a-1) | 138.7 | 96.9 | 118.8 | |
| 单位面积防风固沙量(t hm-2 a-1) | 24.8 | 19.8 | 22.4 | |
| 防风固沙量(×108 t a-1) | 137.0 | 109.5 | 123.7 | |
图7
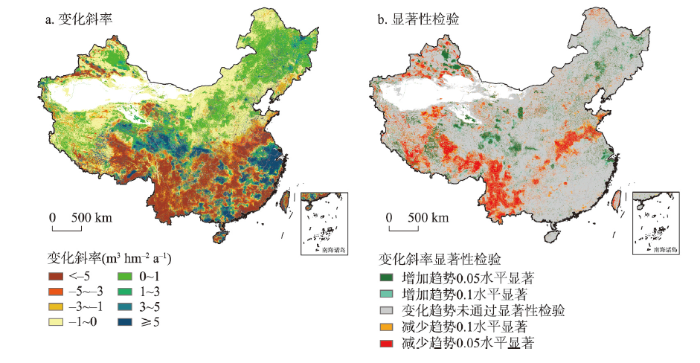
图7
2000—2019年中国水源涵养服务变化斜率及其显著性检验空间分布
Fig. 7
Distribution of change slope of water retention services in China and its significance test in 2000-2019
图8
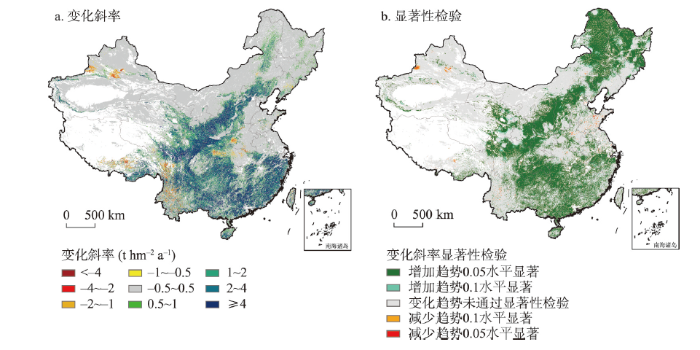
图8
2000—2019年中国土壤保持服务变化斜率及其显著性检验空间分布
Fig. 8
Distribution of changes in the slope of soil retention services in China and its significance test in 2000-2019
图9
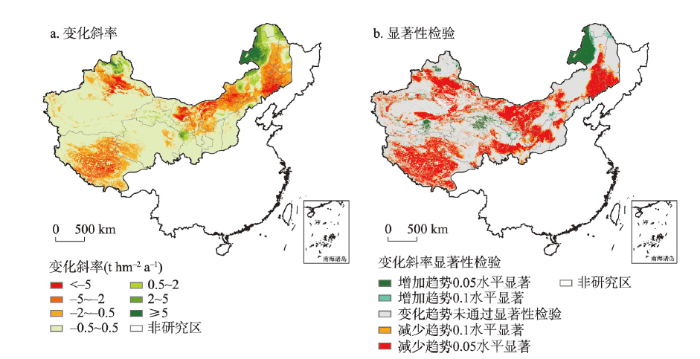
图9
2000—2019年中国防风固沙服务变化斜率及其显著性检验空间分布
Fig. 9
Distribution of change slope of windbreak and sand fixation services in China and its significance test in 2000-2019
3.2 生态系统恢复态势和恢复程度及生态工程的贡献率
3.2.1 生态系统恢复态势及空间差异分析
(1)生态系统质量
表6 中国生态系统质量恢复态势统计表
Tab. 6
| 恢复态势 | FVC不同恢复态势的面积占比(%) | NPP不同恢复态势的面积占比(%) |
|---|---|---|
| 持续转好 | 11.8 | 32.9 |
| 持续转差 | 4.6 | 1.5 |
| 持续稳定 | 36.6 | 34.3 |
| 先转好后转差 | 10.8 | 6.2 |
| 先转好后稳定 | 9.1 | 10.9 |
| 先转差后转好 | 7.0 | 4.7 |
| 先转差后稳定 | 4.6 | 1.6 |
| 先稳定后转好 | 7.7 | 6.3 |
| 先稳定后转差 | 10.8 | 6.2 |
图10
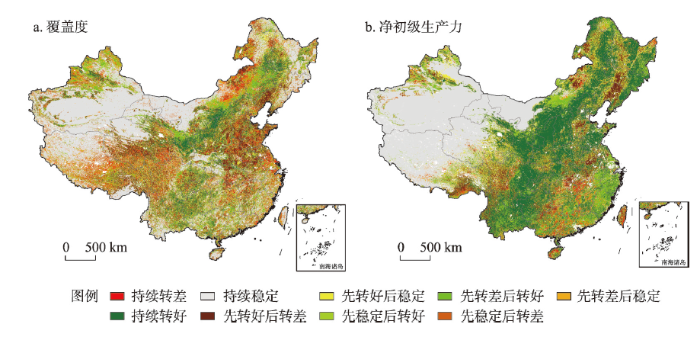
图10
中国植被覆盖度和植被净初级生产力恢复态势空间分布
Fig. 10
Spatial distribution of restoring tendency of FVC and NPP in China
(2)生态系统服务
与2000—2010年相比,2010—2019年全国陆地生态系统的年均水源涵养量略有下降。两时段内,持续转好面积占9.4%,持续稳定面积占17.0%,持续转差面积占21.7%(表7)。其中,水源涵养服务持续转好地区主要分布在黄土高原、三江源东部和新疆天山北部等地区。
表7 中国生态系统服务恢复态势统计表
Tab. 7
| 恢复态势 | 水源涵养不同恢复态势的面积占比(%) | 土壤保持不同恢复态势的面积占比(%) | 防风固沙不同恢复态势的面积占比(%) |
|---|---|---|---|
| 持续转好 | 9.4 | 5.1 | 1.4 |
| 持续转差 | 21.7 | 0.7 | 13.5 |
| 持续稳定 | 17.0 | 74.9 | 46.5 |
| 先转好后转差 | 15.1 | 2.6 | 3.6 |
| 先转好后稳定 | 14.2 | 3.2 | 0.7 |
| 先转差后转好 | 8.1 | 3.9 | 17.8 |
| 先转差后稳定 | 2.6 | 1.4 | 6.8 |
| 先稳定后转好 | 8.2 | 6.9 | 4.2 |
| 先稳定后转差 | 3.7 | 1.3 | 5.5 |
图11
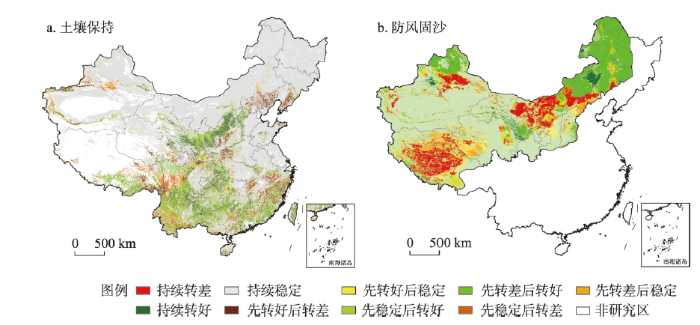
图11
中国土壤保持和防风固沙恢复态势空间分布
Fig. 11
Spatial distribution of restoring tendency of soil retention and windbreak and sand fixation in China
3.2.2 生态系统恢复程度及空间差异分析
图12
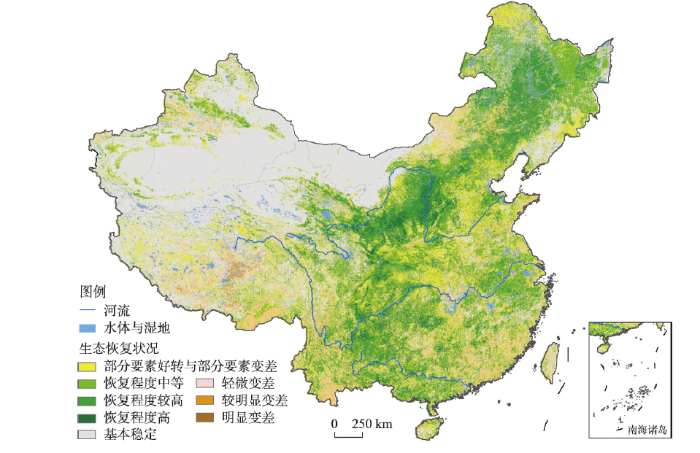
图12
中国生态系统恢复程度空间分布
Fig. 12
Spatial distribution of the degree of ecosystem restoration in China
表8 中国生态恢复状况面积统计表
Tab. 8
| 生态恢复程度 | 面积(万km2) | 面积占比(%) |
|---|---|---|
| 基本稳定 | 310.9 | 32.4 |
| 有所转差 | 74.6 | 7.8 |
| 较明显转差 | 9.0 | 0.9 |
| 明显转差 | 0.5 | 0.1 |
| 恢复程度高 | 16.2 | 1.7 |
| 恢复程度较高 | 111.5 | 11.6 |
| 恢复程度中等 | 204.1 | 21.3 |
| 部分要素恢复与部分要素转差 | 181.8 | 18.9 |
3.2.3 生态工程和气候因素对生态系统质量和服务变化的贡献率
表9 2000—2019年中国生态工程和气候因素对植被净初级生产力和水蚀模数变化的贡献率
Tab. 9
| 区域 | 植被净初级生产力变化 | 水蚀模数变化 | |||
|---|---|---|---|---|---|
| 生态工程贡献率(%) | 气候贡献率(%) | 生态工程贡献率(%) | 气候贡献率(%) | ||
| 全国 | 14.6 | 85.4 | 30.5 | 69.5 | |
| 三北防护林体系建设工程区 | 10.4 | 89.6 | 36.9 | 63.1 | |
| 天然林资源保护工程区 | 18.7 | 81.3 | 27.6 | 72.4 | |
| 京津风沙源综合治理工程区 | 18.3 | 81.7 | 25.6 | 74.4 | |
| 退耕还林工程区 | 14.0 | 86.0 | 31.0 | 69.0 | |
| 退牧还草工程区 | 10.1 | 89.9 | 36.8 | 63.2 | |
| 西南岩溶石漠化综合治理工程区 | 20.8 | 79.2 | 20.3 | 79.7 | |
| 长江防护林建设工程区 | 20.5 | 79.5 | 23.8 | 76.2 | |
| 三江源生态保护和建设工程区 | 12.5 | 87.5 | 26.2 | 73.8 | |
| 珠江防护林体系建设工程区 | 24.8 | 75.2 | 18.0 | 72.0 | |
2000—2019年生态工程和气候因素对土壤水蚀模数变化的贡献率分别为30.5%和69.5%(表9)。在三北防护林体系建设工程区,生态工程对土壤水蚀模数变化的贡献率最高,为36.9%;在珠江防护林体系建设工程区,生态工程对土壤水蚀模数变化的贡献率最低,为18.0%。
3.3 主要生态系统生态恢复潜力分析
图13
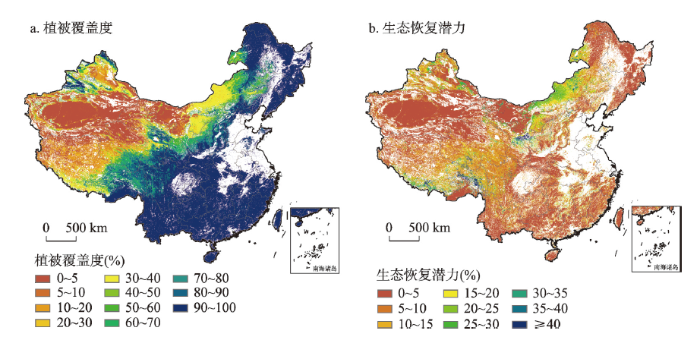
图13
2017—2019年中国顶极生态状况下植被覆盖度和植被覆盖度生态恢复潜力空间分布
Fig. 13
Spatial distribution of FVC under climax ecological conditions and restoration potential of FVCin China in 2000-2019
2017—2019年森林生态系统在顶极生态状况下的植被覆盖度为97.1%,同期森林植被覆盖度实际值与之尚有6.1%的差距,生态恢复潜力为6.4%。
2017—2019年草地生态系统在顶极生态状况下的植被覆盖度为53.9%,同期草地植被覆盖度实际值与之尚有12.4%的差距,生态恢复潜力为23.0%。
2017—2019年荒漠生态系统在顶极生态状况下的植被覆盖度为6.9%,同期荒漠植被覆盖度实际值与之尚有3.4%的差距,生态恢复潜力为49.3%。
4 讨论
4.1 气候格局对生态恢复的制约
2000—2019年中国多年平均年均温、多年平均年降水量均由东南向西北逐渐递减,呈现出明显的水平地带性和垂直地带性分布规律(图14)。将全国多年平均年均温气温、年降水量数据分别与生态系统恢复程度数据进行空间叠加,分析表明生态系统恢复程度较高和高的地方主要分布在多年平均年均温大于0°和年降水量大于300 mm的区域。这表明气候格局对生态恢复的制约比较明显,生态修复的空间布局需要充分考虑这一因素。
图14
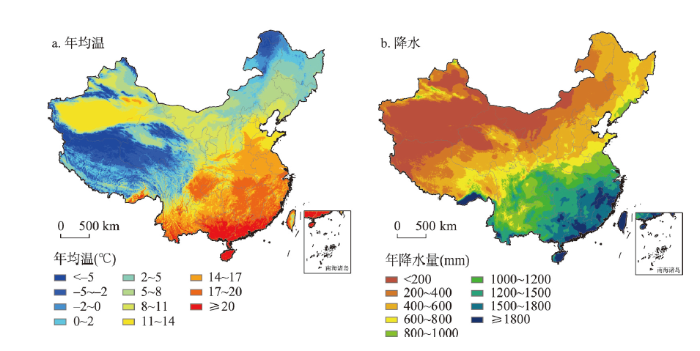
图14
2000—2019年中国多年平均年均温和多年平均降水量空间分布
Fig. 14
Spatial distribution of perennial average annual temperature and multi-year average annual precipitation in China in 2000-2019
此外,结合2000—2019年的年均气温和年均降水量变化趋势,发现生态系统恢复程度较高和高的区域,年均温上升不显著,年降水量有所增加或基本不变。
4.2 多类生态工程叠加实施区的生态恢复一般好于单一工程实施区
叠加全国生态系统恢复程度空间分布图与重大生态工程实施区域分布图,得到全国生态工程叠加实施区的不同生态恢复程度面积统计表(表10)。在5个重大生态工程叠加实施区,生态恢复程度较高和高的地区面积占该区域的17.0%,在实施4个、3个重大生态工程叠加实施区,则分别占各区域的17.3%和19.1%。在实施重大生态工程低于3个的地区,生态恢复程度较高和高的地区面积占各区域的比例均低于11%。重大生态工程实施数量越多,实施工程措施越综合,生态恢复程度越高,如黄土高原[32]实施了三北防护林体系建设、天然林资源保护、退耕还林、退牧还草、京津风沙源综合治理等重大生态工程,采取生物措施与工程措施相结合的综合修复,是中国生态恢复最为显著的区域。个别地区虽然生态工程实施数量多,生态恢复程度不理想,如青海三江源中西部地区,主要原因可能是受到了气候因素的制约。重大生态工程实施的数量少,生态恢复措施相对单一,则存在生态恢复程度低的可能,如云南西南部[40],重大生态工程仅部署了1~2个,以石漠化治理为主,该地区生态恢复程度也较低。同时,部分地区重大生态工程部署相对分散,可能难以发挥综合效益。
表10 中国生态工程叠加实施区的生态恢复程度面积统计(万km²)
Tab. 10
| 实施工程 数量(个) | 基本 稳定 | 有所 转差 | 较明显转差 | 明显 转差 | 恢复程度高 | 恢复程度较高 | 恢复程度中等 | 部分要素恢复与部分要素转差 |
|---|---|---|---|---|---|---|---|---|
| 0 | 4.3 | 6.2 | 0.7 | 0 | 0.2 | 2.9 | 8.8 | 9.5 |
| 1 | 9.8 | 10.9 | 1.0 | 0.1 | 1.0 | 7.1 | 22.3 | 22.5 |
| 2 | 115.5 | 21.9 | 3.1 | 0.1 | 1.6 | 16.2 | 44.3 | 59.7 |
| 3 | 108.7 | 21.5 | 2.4 | 0.1 | 8.6 | 52.9 | 77.3 | 50.0 |
| 4 | 55.0 | 8.9 | 1.3 | 0.1 | 4.1 | 23.8 | 40.0 | 28.1 |
| 5 | 17.0 | 5.3 | 0.7 | 0.1 | 0.8 | 8.5 | 11.2 | 11.4 |
4.3 生态恢复空间差异分析
2000—2019年重大生态工程实施带来的生态恢复程度空间差异较大。生态恢复程度高和较高的区域占全国国土面积的13.3%,主要集中在黄土高原、北方农牧交错带、东北平原、川滇黔渝湘结合部等地区;但仍有部分地区生态恢复不明显,主要分布在青藏高原中部、内蒙古中部、云南南部等地区。空间差异较大的原因主要与气候因素和人类活动相关,1990—2000年北方农牧交错带、黄土高原和东北地区有大量的草地转为农田,云贵高原有较大面积的森林、草地转为耕地[14],开垦活动对生态系统产生负影响。在2000—2010年内蒙古农牧交错带、黄土高原、云贵川、东北地区等地有大面积的耕地转为森林、草地;2010—2015年期间,陕西南部、陇东和内蒙古农牧交错带,仍有较大面积的耕地转为森林、草地[15]。这些地区是全国介于15°~25°和大于25°的坡耕地主要分布区,也是2000年退耕还林(草)工程具体实施的区域,这些区域分布与全国生态系统恢复程度较高和高的区域分布基本一致,退耕活动对当地生态系统恢复有明显的促进作用。
因此,重大生态工程的部署,应充分考虑气候条件的限制性,对于年降水量低于300 mm区域,以及年平均气温低于0 °C区域,尽量不采用人工生态恢复措施,减少人类扰动,促使生态自然恢复。在年降水量大于300 mm和年平均气温大于0 °C的生态脆弱区、生态屏障区和重要生态功能区,深入推进山水林田湖草沙综合治理,避免实施单一生态工程或单一生态恢复措施,充分发挥生态工程组合措施的综合效应,提高生态投入资金的最大效益。而在生态脆弱和经济发展相对滞后地区,由于经济社会发展滞后,生产方式单一,产业转型缺乏内生动力,生态保护与资源利用的矛盾依然突出,亟需探索标本兼治的生态环境综合治理与区域振兴发展协同推进的新模式,应创新构建生态保护和修复、经济社会转型发展和生态补偿长效机制三者协同推进的综合治理体系,通过系列综合治理举措的实施,实现地区经济社会高质量发展与“绿水青山”提质增效的双赢。
5 结论
本文定量评估了2000—2019年中国重大生态工程实施的生态效益,主要得到以下结论:
(1)2000—2018年中国聚落生态系统面积增加了5.2万km2,草地、农田、荒漠生态系统面积分别减少了2.7万km2、1.7万km2和1.0万km2,其他生态系统面积变化不大,生态系统宏观结构总体稳定。
(2)生态系统质量和服务功能总体稳定向好,部分区域转差,2000—2019年植被覆盖度、植被净初级生产力总体稳定增加、局部减少,生态系统水源涵养服务功能量增减各半,生态系统土壤保持服务功能稳定向好,北方风沙区生态系统防风固沙服务功能基本稳定、转好转差区域差异明显。
(3)生态效益较好,2000—2010年和2010—2019年两个时段内,生态系统质量持续稳定和好转的面积较大。2000—2019年生态恢复程度中等、较高和高区域的面积分别占全国国土面积的24.1%、11.9%和1.7%。生态恢复程度较高和高的区域主要集中在黄土高原、北方农牧交错带、东北平原、川滇黔渝湘结合部等地区。
(4)气候是生态系统质量和服务变化的主导因素,2000—2019年全国范围内气候对植被净初级生产力变化的贡献率为85.4%,对土壤水蚀模数变化的贡献率为69.5%。生态工程对植被净初级生产力变化的贡献率为14.6%,对土壤水蚀模数变化的贡献率为30.5%;生态工程对植被净初级生产力变化的贡献率空间差异明显。
(5)植被覆盖度有20%的恢复潜力,不同生态系统类型差异明显。全国森林、草地和荒漠植被覆盖度与地带性顶极生态状况植被覆盖度的差距仍达8.0%,生态恢复潜力为19.7%。其中,森林植被覆盖度的差距为6.1%,生态恢复潜力6.4%;草地植被覆盖度的差距为12.4%,生态恢复潜力23.0%。
致谢
在论文的研究和撰写过程中,得到了傅伯杰院士、陆大道院士、王桥院士、舒俭民研究员、卢琦研究员、曾澜研究员、宫辉力教授、杨雪清教授级高工、柳钦火研究员、延晓冬教授、庞勇研究员、何书金研究员、侯鹏教授级高工、刘慧研究员、杜云艳研究员等专家的指导和帮助,在此一并表示衷心的感谢!
参考文献
Approaches for monitoring and assessment of ecological benefits of national key ecological projects
DOI:10.11867/j.issn.1001-8166.2017.11.1174
[本文引用: 1]

In recent decades, due to the combined effect of human activities and climate change, the ecosystem of our country has been continuously degraded, seriously affecting the sustainable economic and social development. In order to protect and recover the ecosystem, China has invested heavily in launching a series of key ecological programs and projects including North Shelter Forest Program, Grain for Green Project and integrated ecosystem management of rock desertification. How to comprehensively and timely grasp the ecological effects and existing flaws of the implementation of key ecological projects so as to scroll the implementation of ecological projects and ensure the implementation effect of the projects, and promote the follow-up ecological engineering deployment of being scientific and space-oriented is a major imperative for the country. Therefore, the National Key Research and Development Program of China set up the project of “Monitoring and Assessment of Ecological Benefits of Key Ecological Engineering in China”. Through the implementation of this project, we will establish an indicator system for monitoring and evaluating the ecological benefits of key ecological projects, developing various technical systems for monitoring and evaluating the ecological benefits of key ecological projects, quantitatively evaluating the ecological benefits of key ecological projects, and concise the technical approaches to enhancing ecological benefits. We will provide a scientific basis for future planning and management of key ecological projects.
重大生态工程生态效益监测与评估研究
DOI:10.11867/j.issn.1001-8166.2017.11.1174
[本文引用: 1]
近几十年来,由于人类活动和气候变化的共同影响,我国生态系统持续退化,严重影响经济社会的可持续发展。为了保护和修复生态系统,我国先后投巨资启动了三北防护林体系建设、退耕还林(草)、石漠化综合治理等重大生态工程。如何全面及时地掌握重大生态工程实施的生态成效及存在问题,以便滚动调整生态工程实施方案、保障工程实施效果,并使后续生态工程部署具有科学性和空间针对性,是国家的重大迫切需求。为此,国家重点研发计划“典型脆弱生态恢复与保护研究”设立了“国家重大生态工程生态效益监测与评估”项目。通过项目实施,构建重大生态工程生态效益监测评价指标体系,研发各类重大生态工程生态效益监测评估技术体系及系统,定量评价重大生态工程的生态效益,提出生态效益提升的技术途径,为国家重大生态工程的布局和管理提供科学依据。
Contributions of ecological programs to vegetation restoration in arid and semiarid China
Integrating estimates of ecosystem services from conservation programs and practices into models for decision makers
Emerging evidence on the effectiveness of tropical forest conservation
Prevention and restoration actions to combat desertification an integrated assessment: The practice project
DOI:10.1684/sec.2012.0351 URL [本文引用: 1]
Improvements in ecosystem services from investments in natural capital
DOI:10.1126/science.aaf2295
PMID:27313045
[本文引用: 1]
In response to ecosystem degradation from rapid economic development, China began investing heavily in protecting and restoring natural capital starting in 2000. We report on China's first national ecosystem assessment (2000-2010), designed to quantify and help manage change in ecosystem services, including food production, carbon sequestration, soil retention, sandstorm prevention, water retention, flood mitigation, and provision of habitat for biodiversity. Overall, ecosystem services improved from 2000 to 2010, apart from habitat provision. China's national conservation policies contributed significantly to the increases in those ecosystem services. Copyright © 2016, American Association for the Advancement of Science.
Ecological effects assessment of Beijing and Tianjin sandstorm source control project
京津风沙源治理工程生态效应评估
Ecological effects of soil conservation in Loess Plateau
黄土高原生态工程的生态成效
Assessment on the effects of the first-stage ecological conservation and restoration project in Sanjiangyuan region
DOI:10.11821/dlxb201601001
[本文引用: 2]
In this paper, we developed a series of assessment indexes based on the evaluation of ecological effects, which consists of the ecosystem structure, qualities, services, and main impacting factors for these changes. Comprehensive monitoring and assessment methods that focused on the planning objectives of ecological conservation and restoration project were developed based on field observation, remote sensing monitoring and quantitative simulation of ecological processes. Then we assessed the ecological effects of the first-stage of ecological conservation and restoration project in Sanjiangyuan region by adopting the trend analysis of dynamics in ecosystem structure and services. The results showed that since the beginning of the project eight years ago, the macro-situation of ecosystem in this region has been getting better but not reached the best situation in the 1970s. The continued degradation trends of grassland have been initially contained, but it is difficult to achieve the expected objective of "the vegetation coverage of grassland increasing by an average of 20%-40%". The wetland and water-body ecosystems have been restored. The water conservation service of ecosystem and water supply capacity of watershed were increased, and the volume of?ecosystem water conservation reached the objective of increasing by 1.32 billion m3. The ecological restoration in the project regions tended to be better than that outside the project regions. In addition to climate change, implementation of the ecological conservation and restoration project had obvious and positive effects on vegetation restoration. However, the degradation situations of grassland were not fundamentally reversed, and the implementation of the project has not been curbing the increasing trend of soil erosion. Therefore, the local and preliminary characteristics of the first-stage of the project highlighted the long-term and arduous ecosystem conservation and protection in the Sanjiangyuan region.
三江源生态保护和建设一期工程生态成效评估
DOI:10.11821/dlxb201601001
[本文引用: 2]
基于生态系统结构--服务动态过程趋势分析,针对生态保护与建设工程预期目标,构建了由生态系统结构,质量,服务及其变化因素构成的生态成效评估指标体系,研究发展野外观测,遥感监测和生态过程定量模拟一体化的监测评估技术体系,评估了三江源生态保护和建设一期工程的生态成效.结果表明:工程实施8年以来,三江源区宏观生态状况趋好但尚未达到1970s比较好的生态状况,草地持续退化趋势得到初步遏制但难以达到预期"草地植被盖度提高平均20%~40%"的目标,水体与湿地生态系统整体有所恢复,生态系统水源涵养和流域水供给能力提高,区域水源涵养量达到了增加13.20亿m<sup>3</sup>目标;重点工程区内生态恢复程度好于非工程区,除了气候影响以外,工程的实施对促进植被恢复具有明显而积极的作用;然而,草地退化局面没有获得根本性扭转,工程实施尚未遏制土壤水蚀增加趋势,一期工程局部性和初步性特点突显出三江源区生态保护任务的长期性和艰巨性.
The sand fixation effects of Three-North Shelter Forest Program in recent 35 years
DOI:10.13249/j.cnki.sgs.2018.04.014
[本文引用: 1]
In order to understand the windbreak and sand fixation effects of the Three-North Shelter Forest Program (TNSFP) in recent 35 years, this paper analyzes the amount change of ecosystem sand fixation caused by climate change and vegetation degradation or restoration in the project region, and then assesses the sand fixation effects of the Program. Based on Landsat MSS, TM/ETM+, and environmental satellite (HJ) images, the spatial-temporal datasets of land cover changes in the project region of TNSFP were analyzed in the periods of mid 1970s, 1990, 2000, 2010, 2015, especially the forest and grassland. Combining the NDVI data of AVHRR and MODIS, the vegetation coverage was estimated, and then the change of vegetation coverage in the 1982-2015 was analyzed. The soil erosion modulus were estimated at the regional scale by applying the soil erosion equation (RWEQ), and then the ecosystem services of windbreak and sand fixation were assessed using indicators of amount and retention rate of windbreak and sand fixation. Then the contribution rate of ecological program and climate change to regional ecosystem change was determined by comparing the indexes under the conditions of average climate and real climate. The results showed that: 1) In the past 35 years, the area of forest was continuously increased and grassland was decreased, especially in the semi-arid sandy area and Loess Plateau. The vegetation coverage increased continuously in the before 20 years, and then decreased in recent 15 years. 2) The soil wind erosion modulus is decreased continuously, and the decreasing rate in recent 15 years is much higher than that in the before 20 years. The decreasing rates were especially obvious in sandy land, grassland, and regions planting trees and grassland. The retention ratio of ecosystem windbreak and sand fixation service also increased continuously, especially in arid desert area. Grassland and sandy land contributed 71% of the total amount of windbreak and sand fixation. However, just 6.6% of forest land, and the contribution of conversion grassland was higher than that of conversion forest. 3) In the TNSFP, the weakening of wind erosion force due to reducing wind, and the vegetation restoration in local areas due to TNSFP and other ecological programs, both resulted in a decrease of soil wind erosion, and accounted for 85%-89% and 11%-15% of the decrease. Winter monsoon in mid-latitude Asian is weakened due to global warming. In the project region of TNSFP, the grassland played the most important role in ecosystem service of windbreak and sand fixation, which accounts for more than 63% of the total area. Therefore, the conservation of grassland and sandy land were significant in project region of TNSFP. Project planning and implementation should focus on the transfer of funds from afforestation to grassland conservation and restoration.
近35年三北防护林体系建设工程的防风固沙效应
DOI:10.13249/j.cnki.sgs.2018.04.014
[本文引用: 1]
通过分析三北工程区生态系统防风固沙服务量变化,进而评价工程的防风固沙效应。结果表明:① 近35 a,三北工程区林地面积持续增加、草地面积持续减少,特别是半干旱风沙区和黄土高原区。植被覆盖度在前20 a持续增加,近15 a则呈现先下降而后略微增加趋势。②土壤风蚀模数持续减少,近15 a减幅远高于前20 a,沙地、草地、其它类型转林地或转草地区域的减幅尤为明显。生态系统防风固沙服务保有率呈上升态势,干旱荒漠区增幅显著。草地和沙地为工程区生态系统防风固沙服务总量贡献了71%,且转草地区域的贡献高于转林地区域。③ 考虑到植被好转同时受气候变化和人类活动的影响,以风场减弱为主的气候变化导致土壤风蚀力减弱与三北防护林等生态工程对生态系统防风固沙服务变化的贡献率分别介于85%~89%和11%~15%之间。
Spatiotemporal characteristics, patterns and causes of land use changes in China since the late 1980s
DOI:10.11821/dlxb201401001
[本文引用: 2]
Land-Use/land Cover Changes (LUCC) are a direct consequence of human and nature interactions. China's Land Use/cover Datasets (CLUD) were updated regularly at five-year intervals from the late 1980s to the year of 2010 with standard procedures based on Landsat TM/ETM + images. A dynamic zoning method was proposed to analyze major land-use conversions. The spatiotemporal characteristics, differences, and causes of land-use changes at a national scale were then examined. The main findings are summarized as follows: Land-Use Changes (LUC) across China indicated a significant variation in spatial and temporal characteristics in the past 20 years between the 20th and 21st centuries. The amount of cropland change decreased in the south and increased in the north, but the total area remained almost unchanged. The reclaimed cropland was shifted from northeast to northwest. The built-up lands were expanded rapidly, which were mainly distributed in the east and gradually spread out to the midwest. Woodland decreased first and then increased, but desert area was inverted. Grassland continued decreasing. Different spatial patterns of LUC in China were found between the late 20th century and the early 21st century. The original 13 LUC zones were replaced by 15 units with changes of boundaries in some zones. The main spatial characteristics of these changes included (1) an accelerated expansion of built-up land in the Huang-Huai-Hai region, the coastal areas of southeastern China, the midstream area of the Yangtze River, and the Sichuan Basin; (2) the shifted land reclamation in the north from Northeast China and eastern Inner Mongolia to the oasis agricultural areas in Northwest China; (3) the continuous transform from rain-fed farmlands in Northeast China to paddy fields; and (4) the effectiveness of the “Grain-for-Green” project in the southern agricultural-pastoral ecotones of Inner Mongolia, the Loess Plateau, and mountainous areas of southwestern China. In recent two decades, although climate change in the north impacted the change in cropland, policy regulation and economic driving forces were still the primary causes of LUC across China. During the first decade of the 21st century, the anthropogenic factors that drove variations in land-use patterns have shifted the emphasis from one-way land development to both development and conservation. The "dynamic zoning method" was used to analyze changes in the spatial patterns of zoning boundaries, the internal characteristics of zones, and the growth and decrease of units. The results revealed "the pattern of the change process," namely the process of LUC and regional differences in characteristics at different stages. The growth and decrease of zones during this dynamic LUC zoning, variations in unit boundaries, and the characteristics of change intensities between the former and latter decades were examined. The patterns of alternative transformation between the "pattern" and "process" of land use and the reasons for changes in different types and different regions of land use were explored.
20世纪80年代末以来中国土地利用变化的基本特征与空间格局
Spatio-temporal patterns and characteristics of land-use change in China during 2010-2015
DOI:10.11821/dlxb201805001
[本文引用: 2]
Land use/cover change is an important theme on the impacts of human activities on the earth systems and global environment change. National land-use changes of China during 2010-2015 were acquired by the digital interpretation method using high-resolution remotely sensed images, i.e. the Landsat8 OLI, and GF-2 remote sensing images. The spatio-temporal characteristics of land-use changes across China during 2010-2015 were revealed by the indexes of dynamic degree model, annual land-use changes ratio, etc. The results indicated that built-up land increased by 24.6×10³ km2, while cropland decreased by 4.9×10³ km2, and the total area of woodland and grassland decreased by 16.4×10³ km2. The spatial pattern of land-use changes in China during 2010-2015 was concordant with that of the period 2000-2010. Specially, new characteristics of land-use changes emerged in different regions of China in 2010-2015. The built-up land in eastern China expanded continually, and the total area of cropland decreased, both at decreasing rates. The rates of built-up land expansion and cropland shrinkage were accelerated in central China. The rates of built-up land expansion and cropland growth increased in western China, while the decreasing rate of woodland and grassland accelerated. In northeastern China, built-up land expansion slowed down continually, and cropland area increased slightly accompanied by the conversions between paddy land and dry land. Besides, woodland and grassland area decreased in northeastern China. The characteristics of land-use changes in eastern China were essentially consistent with the spatial governance and control requirements of the optimal development zones and key development zones according to the Major Function-oriented Zones Planning implemented during the 12th Five-Year Plan (2011-2015). It was a serious challenge for the central government of China to effectively protect the reasonable layout of land use types dominated with the key ecological function zones and agricultural production zones in central and western China. Furthermore, the local governments should take effective measures to strengthen the management of territorial development in future.
2010—2015年中国土地利用变化的时空格局与新特征
DOI:10.11821/dlxb201805001
[本文引用: 2]
土地利用/覆被变化是人类活动对地球表层及全球变化影响研究的重要内容。本文基于Landsat 8 OLI、GF-2等遥感图像和人机交互解译方法,获取的土地利用数据实现了中国2010-2015年土地利用变化遥感动态监测。应用土地利用动态度、年变化率等指标,从全国和分区角度揭示了2010-2015年中国土地利用变化的时空特征。结果表明:2010-2015年中国建设用地面积共增加24.6×10<sup>3</sup> km<sup>2</sup>,耕地面积共减少4.9×10<sup>3</sup> km<sup>2</sup>,林草用地面积共减少16.4×10<sup>3</sup> km<sup>2</sup>。2010-2015年与2000-2010年相比,中国土地利用变化的区域空间格局基本一致,但分区变化呈现新的特征。东部建设用地持续扩张和耕地面积减少,变化速率有所下降;中部建设用地扩张和耕地面积减少速度增加;西部建设用地扩张明显加速,耕地面积增速进一步加快,林草面积减少速率增加;东北地区建设用地扩展持续缓慢,耕地面积稳中有升,水旱田转换突出,林草面积略有下降。从“十二五”期间国家实施的主体功能区布局来看,东部地区的土地利用变化特征与优化和重点开发区的国土空间格局管控要求基本吻合;中部和西部地区则面临对重点生态功能区和农产品主产区相关土地利用类型实现有效保护的严峻挑战,必须进一步加大对国土空间开发格局的有效管控。
Carbon storage in the grasslands of China based on field measurements of above- and below-ground biomass
DOI:10.1007/s10584-007-9316-6 URL [本文引用: 1]
Spatial distribution of land use change in the Yangtze River Basin and the impact on runoff
DOI:10.18306/dlkxjz.2017.04.004
[本文引用: 1]
The impact of land use change on runoff is one of the key concerns in water cycle research. The Yangtze River Basin is the largest river basin in China, and land use change and its impact on runoff are key research questions for runoff variation and flood and drought hazards analyses of the basin. This study used land use data of the Yangtze River Basin in 1980, 1990, 1995, 2000 and 2005 to calculate the dynamic degree, swapping variable values, and other indexes between the four periods by land use transition matrix, evaluated spatial and temporal variation characteristics of land use, and identified key regions of change and driving factors in the basin. Based on the widely-used precipitation-runoff relationship of the Soil Conservation Service (SCS) model, runoff impacts caused by land use change were assessed. The results show that from 1980 to 2005, land transfer activity was more intense in the first (1980-1990) and the fourth (2001-2005) periods compared to the two periods in between (1991-1995, 1996-2000). The middle and upper reaches around Sichuan Province and to its north were the most active regions. Paddy land, dry land, woodland, and grassland areas changed slightly, less than 8%. Influenced by different approaches of environmental protection and economic development in the four periods, cultivated lands (paddy land and dry land) showed inverse changes with grassland, and water body, unused land, and urban land changed to a much greater extent. In particular, due to rapid urbanization, urban land increased by 196.58%. Land use change directly resulted in the increase of average runoff coefficient, which ranged from -0.67%~0.80%, with the mean of 0.05%. The most obvious changes were in highly urbanized regions, particularly around the Yangtze River Delta region. Increase of runoff coefficient would raise the occurrence probability of flooding.
长江流域土地利用时空变化特征及其径流效应
DOI:10.18306/dlkxjz.2017.04.004
[本文引用: 1]
土地利用变化的径流效应是水循环研究中的重点内容之一。长江流域是中国最大的流域,土地利用变化及其径流效应分析是研究该流域径流演变、水旱灾害的基础。本文利用1980、1990、1995、2000、2005年五期土地利用数据,采用土地利用转移矩阵计算土地利用动态度、交换变量等指标,评价了长江流域土地利用的时空变化特征,识别关键变化区域及其变化原因。在此基础上,利用SCS模型的降水—径流方程,分析了土地利用变化的径流效应。研究结果表明:1980-2005年时期,长江流域土地转移活跃程度在第一(1980-1990年)和第四(2001-2005年)时期内明显高于1991-1995年和1996-2000年,中上游四川及其北部地区的活跃程度最大。1980-2005年期间水田、旱地、林地和草地面积变化幅度都在8%以内。但受不同时期环境保护和经济发展因素影响,耕地(水田和旱地)和林地、草地呈现相反的变化,而水域、未利用地和城镇用地相对变化较大;其中快速的城镇化导致城镇用地增幅最高,可达196.58%。土地利用变化直接导致流域的平均径流系数变大,变幅从-0.67%到0.80%,平均增幅0.05%,变化最显著的地区在城市化水平较高的长三角一带。径流系数的增加导致洪水发生的可能性增大。
1 km monthly temperature and precipitation dataset for China from 1901 to 2017
DOI:10.5194/essd-11-1931-2019 URL [本文引用: 1]
Spatiotemporal change and trend analysis of potential evapotranspiration over the Loess Plateau of China during 2011-2100
DOI:10.1016/j.agrformet.2016.11.129 URL [本文引用: 1]
Soil available water capacity and it's empirical and statistical models: With a special reference to black soils in northeast China
土壤有效含水量的经验估算研究: 以东北黑土为例
Spatial patterns of ecosystem water conservation in China and its impact factors analysis
中国生态系统水源涵养空间特征及其影响因素
Analysis on the function of conservation water of the Chinese forest ecosystem
中国森林生态系统水源涵养功能分析
The water resource conservation of forest ecosystem in China
中国森林生态系统水源涵养功能
Calculation on soil erosion amount of main river basin in China
我国主要江河流域土壤侵蚀量测算
Estimating soil erosion in the Dongjiang river basin based on USLE
基于USLE的东江流域土壤侵蚀量估算
Soil and water loss and countermeasures in Yunnan province
云南省水土流失概况及其防治对策
RWEQ: Improved wind erosion technology
A study on the relationship between friction wind velocity and mean wind velocity
摩阻风速与平均风速的转化关系研究
Vegetation cover, climate and human activities on the Loess Plateau
黄土高原植被覆盖变化与气候和人类活动的关系
Discrimination between climate and human-induced dryland degradation
DOI:10.1016/S0140-1963(03)00121-6 URL [本文引用: 1]
Evaluation index system of comprehensive benefits of ecological restoration in key ecologically vulnerable regions
重点脆弱生态区生态恢复综合效益评估指标体系
Evaluation of comprehensive benefit for ecological restoration in Shannxi province
陕西省生态恢复综合效益评估
An ecological benefit assessment of the Grain for Green Project in Shaanxi Province
陕西省退耕还林工程生态效益评估
Effectiveness of ecological restoration in the mountain-oasis-desert system of northwestern arid area of China
西北干旱区山地—绿洲—荒漠系统生态恢复综合效益评估
