

1 引言
植被作为陆地生态系统的重要组成部分,在维持全球气候稳定、降低温室气体浓度和维持碳平衡等方面发挥着重要作用[1⇓-3]。但随着全球变暖不断加剧,极端天气、酸雨和气溶胶污染等影响植被生长状况的事件频发,中国植被的组成结构和空间格局正在遭受重大影响,如气候变暖使植被的生长期提前或延长[4];极端天气影响土地功能和状态,从而引起土地退化等[5]。同时,气候模式预估的结果显示,未来中国气候变暖的趋势将会进一步加剧,可能引发地表温度升高、暴雨天气增多、干旱区范围扩大等一系列连锁反应[6],将会使得气候敏感区域植被退化更加严重[7],威胁社会经济的可持续发展和人类的生存环境。因此,在全国尺度上探究植被对气候变化的响应,预测未来增暖情景下植被的变化趋势和空间分布,将为中国优化生态系统的组成和结构,保护区域生物多样性与生态安全提供理论依据。
净初级生产力(Net Primary Productivity, NPP)是植被通过光合作用从大气中吸收的碳除去自身损耗之外的部分,反映了植被吸收二氧化碳的能力,是生态系统物质和能量转换研究的基本单位,也是评估植被生长状况的重要指标[8-9]。全国尺度上NPP的研究由于缺少长序列的定位观测数据,基本都基于不同统计方法和模型的估算。已有研究表明中国NPP在空间分布上呈现“南高北低”,由东南向西北递减的趋势[10⇓-12],地带性变化规律与水、热状况的地带性规律相一致[12]。然而,由于选用的数据、估算方法和估算模型不同,不同学者对NPP趋势变化的研究得出了不一致甚至完全相反的结论。部分基于遥感碳模型(CASA)的研究认为1982年以来中国主要植被类型的净初级生产力都具有逐渐上升的年际趋势[12⇓-14],其中高寒植被、常绿阔叶林、常绿针叶林的增加幅度比其他自然植被类型的要大[13]。也有部分研究使用LPJ全球植被动态模式或气候生产力模型后,认为中国植被NPP呈波动下降趋势[10-11],在东部NPP值相对较高的地区以减少为主,在西部NPP值相对较低的地区以增加趋势为主[10]。而卢玲等[15]利用碳通量估算模型C-FIX得到的结果则认为中国西部地区NPP正在迅速下降。同时,基于CASA模型和CENTURY生物地球化学循环模型分析的中国NPP对气候要素的响应也差异较大,前者分析的结果表明中国除干旱与半干旱地区受降水主导外,绝大部分区域NPP变化受气温影响[14];而后者则认为植被NPP年际变异对温度的响应程度低于对降水的响应程度,植被NPP的响应情况近似于单独降水变化时对植被NPP产生的影响[16]。因此,数据和模型的差异使得已有研究在全国植被NPP的变化上存在争议。
已有的NPP估算数据中,基于遥感影像数据生成的NPP序列和基于植被动态模式的序列使用最为广泛。前者能有效捕捉植被动态的时空变化[17],是目前较为准确的反映植被生长状况的方法。但受限于卫星观测数据的序列长度,遥感反演的NPP数据只能反映过去较短时间内的植被变化。植被动态模式数据耦合了植被动态、生物地理和生物地球化学过程,可以模拟依赖于生理和生态过程的NPP长期动态变化,能更全面地反映生态系统从日尺度到年际尺度对气候变化的响应[18],并对未来情景下NPP的变化趋势做出预测。但由于植被动态模型一般只在植被组成较为单一的局地尺度准确性较好,因此目前利用植被动态模型数据对全国NPP变化预测的研究较少。如尹云鹤等[19]利用LPJ模式对NPP的研究主要聚焦在中国北方干湿过渡区。同时,少有的几项全国尺度上的应用都着眼于对单一模式的不断改进,难以进一步完善模式在构建过程中简化和忽略的因素。如赵东升等[10]通过对中国不同植被区LPJ模式因子的改进而得到的数据和其文中基于MODIS遥感反演数据的空间分布差异较大,对海南、云南等地未来NPP变化幅度的预测也和刘少军等[20]的结果有所不同。因此,通过对比多个植被动态模式数据在各植被地带对遥感反演数据的模拟优度,将多模式数据以拟合优度为权重加权合成新的兼具各模式优势的NPP数据将是一种提高模式数据的适用范围、增加数据准确度的新方法。
部门间影响模式比较计划(Inter-Sectoral Impact Model Intercomparison Project, ISIMIP)提供了一个多模式数据比较分析的平台,为遴选和结合多个植被动态模式数据预估未来给出了数据支撑。该计划选用了多种全球植被动态模式,在共同的网格气候数据集驱动下,模拟了未来不同RCPs路径和社会经济人口情景下全球水、生态、森林、农业等部门的变化。在生态领域,ISIMIP采用了CARAIB、ORCHIDEE、DLEM等10个模型估算了全球植被NPP,不同模式在对碳限制、植被动态和热应激等因素的考虑上互有侧重。其中,LPJML、LPJ-GUESS、DLEM、VISIT、ORCHIDEE和CLM4.5等植被动态模式的数据在中国陆表区域已有使用[21⇓⇓⇓-25],整体表现较好。
为了更为准确地预估未来30 a中国净初级生产力变化格局,本文选取了基于遥感影像数据生成的NPP序列为验证,比较了6个植被动态模式数据在中国各植被区域的拟合优度(R²);在此基础上,以拟合优度为权重,生成了综合6个模式的新NPP数据,分析了2035年之前及2035—2050年间两种浓度路径下中国NPP的变化趋势;并讨论了新NPP序列对气候因子的响应情况。本文可为中国到2035年实现生态环境质量根本好转,2050年全面建成美丽中国的生态文明建设愿景提供科学指导。
2 研究数据与方法
2.1 数据来源
2.1.1 NPP遥感反演数据
图1
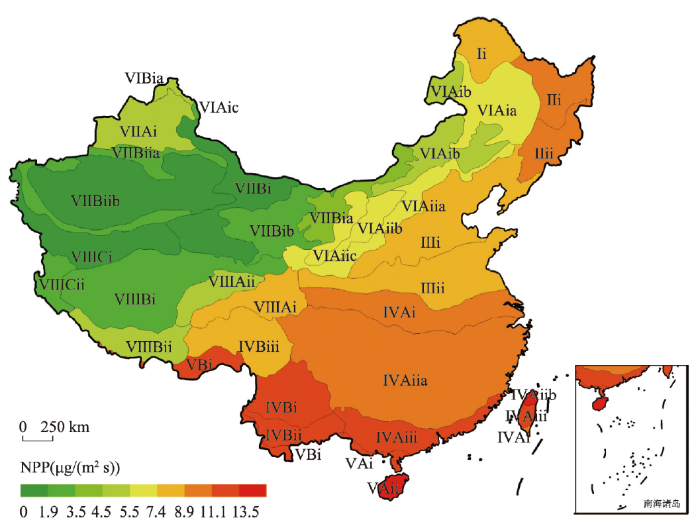
图1
中国各植被区、植被亚区域和植被地带的空间划分及遥感反演数据多年均值
注:基于自然资源部标准地图服务网站GS(2016)1585号标准地图制作,底图边界无修改。
Fig. 1
The spatial division of vegetation areas, vegetation subregions and vegetation zones in China and the multi-year mean value of remote sensing inversion data
表1 中国植被分区
Tab. 1
| 一级植被区 | 二级植被区 | 代码 | 一级植被区 | 二级植被区 | 代码 |
|---|---|---|---|---|---|
| 寒温带针叶林区域 | 南寒温带针叶林地带 | Ⅰi | 温带北部荒漠草原亚区 | ⅥAic | |
| 温带针叶阔叶混交林区域 | 温带北部针叶阔叶混交林地带 | Ⅱi | 温带南部森林(草甸)草原 | ⅥAiia | |
| 温带南部针叶阔叶混交林地带 | Ⅱii | 温带南部荒漠草原亚区 | ⅥAiic | ||
| 暖温带落叶阔叶林区域 | 暖温带北部落叶栎林地带 | Ⅲi | 温带南部典型草原亚区 | ⅥAiib | |
| 暖温带南部落叶栎林地带 | Ⅲii | 温带北部荒漠草原亚区 | ⅥBia | ||
| 亚热带常绿阔叶林区域 | 北亚热带常绿、落叶混交林地带 | ⅣAi | 温带荒漠 区域 | 温带半灌木、矮乔木荒漠 地带 | ⅦAi |
| 中亚热带常绿阔叶林北部亚区 | ⅣAiia | 温带半灌木、灌木荒漠地带 | ⅦBi | ||
| 中亚热带常绿阔叶林南部亚区 | ⅣAiib | 温带灌木、禾草半荒漠亚区 | ⅦBia | ||
| 南亚热带季风常绿阔叶林地带 | ⅣAiii | 温带灌木、半灌木荒漠亚区 | ⅦBib | ||
| 中亚热带常绿阔叶林地带 | ⅣBi | 暖温带灌木半灌木荒漠亚区 | ⅦBiia | ||
| 南亚热带季风常绿阔叶林地带 | ⅣBii | 暖温带灌木半灌木、裸露地带 | ⅦBiib | ||
| 亚热带山地寒温性针叶林地带 | ⅣBiii | 青藏高原高寒植被区域 | 高寒灌丛、草甸地带 | ⅧAi | |
| 热带季雨林、雨林区域 | 北热带半常绿季雨林、湿润雨林地带 | ⅤAi | 高寒草甸地带 | ⅧAii | |
| 南热带季雨林、湿润雨林地带 | ⅤAii | 高寒草原地带 | ⅧBi | ||
| 北热带季节雨林、半常绿季雨林地带 | ⅤBi | 温性草原地带 | ⅧBii | ||
| 温带草原区域 | 温带北部草甸草原亚区 | ⅥAia | 高寒荒漠地带 | ⅧCi | |
| 温带北部典型草原亚区 | ⅥAib | 温性荒漠地带 | ⅧCii |
根据划分出的植被地带,通过栅格平均计算了每个植被地带内上述遥感反演数据的多年均值,可以看出该均值呈现出由东南向西北递减的整体趋势,在中国南部热带季风雨林区最大(18.6 μg/(m² s)),由此向北逐植被地带递减,在青藏高原东南—秦岭—淮河以南大部分区域>8.9 μg/(m² s),在内蒙自治区西部经河西走廊西部以及藏北高原以北的大部分区域<5.5 μg/(m² s),在中国青藏高原西北部高寒荒漠地带最小(1.2 μg/(m² s))。
2.1.2 植被动态模式数据
ISIMIP2b协议在统一的气候驱动集和0.5°×0.5°网格下用多个植被模式估算了未来RCPs路径下全球植被NPP数据。本文选取了其中6个在中国陆表区域已有应用的模式的输出数据进行验证和分析(
表2 9类影响因素在6个模式中的差异
Tab. 2
| 动态植被 | 氮限制 | 热应激 | 生根深度 | 多年冻土 | 能量平衡 | 土—水—热耦合 | 潜热 | 显热 | |
|---|---|---|---|---|---|---|---|---|---|
| ORCHIDEE | 是 | 否 | 是 | 是 | 是 | 是 | 是 | 是 | 是 |
| DLEM | 否 | 是 | 是 | 否 | 是 | 否 | 是 | 是 | 否 |
| LPJ-GUESS | 是 | 是 | 是 | 是 | 否 | 否 | 否 | 否 | 否 |
| VISIT | 否 | 否 | 是 | 是 | 否 | 否 | 否 | 是 | 否 |
| LPJML | 是 | 否 | 是 | 否 | 否 | 是 | 是 | 是 | 是 |
| CLM4.5 | 否 | 是 | 否 | 是 | 否 | 是 | 是 | 是 | 是 |
本文以1985—2015年为验证期,以2016—2050年为未来情景。但由于ISI-MIP第二阶段的试验以2006为未来路径的起始年份,因此本文取1985—2005年间的历史数据及2006—2015年间两种路径下模式数据均值与相应的遥感反演数据做验证。
2.1.3 气象数据
本文考虑的气象要素包括降水、相对湿度、日照时数、平均气温及风速,均来源于中国气象数据网的地面气候标准值月值数据集(
2.2 研究方法
2.2.1 模式修正与新数据合成
由于基于植被动态模式的数据在较大的空间尺度下准确性较差,存在整体的偏离,因此使用遥感反演数据对各二级植被区内6个植被动态模式数据的均值和方差进行了校准,其计算公式如下:
式中:
以各植被地带内遥感反演值与修正后模式值的拟合优度R2为权重,将6个生态影响模式数据进行加权平均后,合成了新的泛用性更强、对遥感反演数据的变异性解释度更高的新NPP序列:
式中
2.2.2 未来趋势检验
利用Mann-Kendall非参数检验方法评估新合成的NPP序列在未来是否存在单调性。该方法对样本的分布没有要求,受少数异常值的干扰小,所得结果较为可靠。其计算公式如下:
式中:Na、Nb为第a、b年的NPP值;
2.2.3 相关分析
以验证期内五类气象因子与遥感反演值、新模式值的皮尔逊相关系数r分析各植被地带内气象因子对NPP变化的影响,以验证新模式序列的可靠性,第i个植被地带相关系数
式中
采用假设检验的方法,假设气象因子与NPP不存在相关性的前提下,计算两变量不存在相关性的概率值(P),以双尾P值检验相关系数r的显著性。p < 0.05和0.05 < p < 0.1分别表示气象要素与NPP存在相关性的概率大于95%及介于90%与95%之间。P值计算如下:
式中:r为NPP与气象因子间的相关系数;T为序列长度,此处为31 a;tcdf表示自由度为T-2的t分布累积分布函数值。
3 结果分析
3.1 模式结果与遥感反演值对比
模拟的中国陆表多年平均NPP相比遥感反演值整体偏高,其中DLEM(8.5 μg/(m² s))模式和遥感反演值(6.4 μg/(m² s))最为接近,VISIT(12.6 μg/(m² s))模式和遥感反演值相差最大(表3)。具体到各植被区域,偏高的部分主要来源于寒温带针叶林、温带针阔叶混交林、暖温带落叶阔叶林、亚热带常绿阔叶林和热带季雨林、雨林等5个位于中国东部NPP均值较高的区域,而位于中国西北部的内蒙古高原的温带草原、温带荒漠和青藏高寒植被区中遥感反演均值和模式均值相差不大。另外,模式对各植被区域NPP的相对大小关系与遥感反演值得出的结果一致,即热带季雨林、雨林最大,温带荒漠区域最小。
表3 1985—2015年各植被区NPP多年均值(μg/(m² s))
Tab. 3
| 寒温带 针叶林 | 温带针阔 叶混交林 | 暖温带落 叶阔叶林 | 亚热带常 绿阔叶林 | 热带季雨 林、雨林 | 温带 草原 | 温带 荒漠 | 青藏 高寒区 | 全国 | |
|---|---|---|---|---|---|---|---|---|---|
| DLEM | 12.5 | 12.5 | 13.9 | 15.9 | 21.8 | 8.2 | 1.1 | 2.7 | 8.5 |
| ORCHIDEE | 14.6 | 18.9 | 15.3 | 18.3 | 23.8 | 10.9 | 1.2 | 5.8 | 10.4 |
| VISIT | 12.0 | 19.7 | 15.8 | 25.4 | 33.4 | 4.2 | 1.5 | 13.6 | 12.6 |
| LPJ-GUESS | 17.4 | 18.8 | 15.1 | 15.4 | 19.9 | 13.3 | 4.0 | 2.8 | 10.5 |
| LPJML | 15.4 | 16.8 | 15.7 | 19.6 | 23.0 | 10.8 | 2.5 | 9.6 | 11.7 |
| CLM4.5 | 12.4 | 18.0 | 9.8 | 18.2 | 21.9 | 6.6 | 0.7 | 4.8 | 8.8 |
| 遥感反演值 | 8.5 | 9.5 | 7.7 | 9.9 | 12.5 | 6.2 | 2.4 | 3.4 | 6.4 |
根据1985—2015年间各植被带内修正后的模式值与遥感反演值均值的拟合优度(图2),可知单个模式对全国大部分区域NPP的拟合效果较差(R2<0.4),但不同的模式在特定的植被地带有较强的适用性,整体上6个模式适用性较好的区域涵盖了中国大部分植被带。其中,以DLEM模式适用性较好的范围最广,拟合优度在中国东南部的南亚热带季风常绿阔叶林和北热带半常绿季雨林>0.6,在中国青藏高原西北部的高寒荒漠、内蒙古高原温带半灌木和灌木为主的半荒漠亚区>0.4,在其余大部分植被地带也在0.3以上。相比于DLEM模式,ORCHIDEE模式拟合优度较大的区域开始向内收缩,主要在青藏高原西南部的温性和高寒草原适用性较好(R2>0.4)。VISIT模式尤其适用于中国西北地区和青藏高原地区,拟合优度在这里的高寒荒漠地带和温带灌木半灌木荒漠地带>0.6,在其余多个植被地带拟合优度>0.5。LPJ-GUESS模式适用性较好的范围向青藏高原西南部和内蒙古高原进行了进一步缩小,拟合优度基本均小于VISIT模式;LPJML模式主要适用于塔里木盆地附近的暖温带灌木半灌木裸露地,在此处拟合优度为0.61。CLM4.5模式整体拟合效果最差,各植被带R²基本都<0.4。
图2
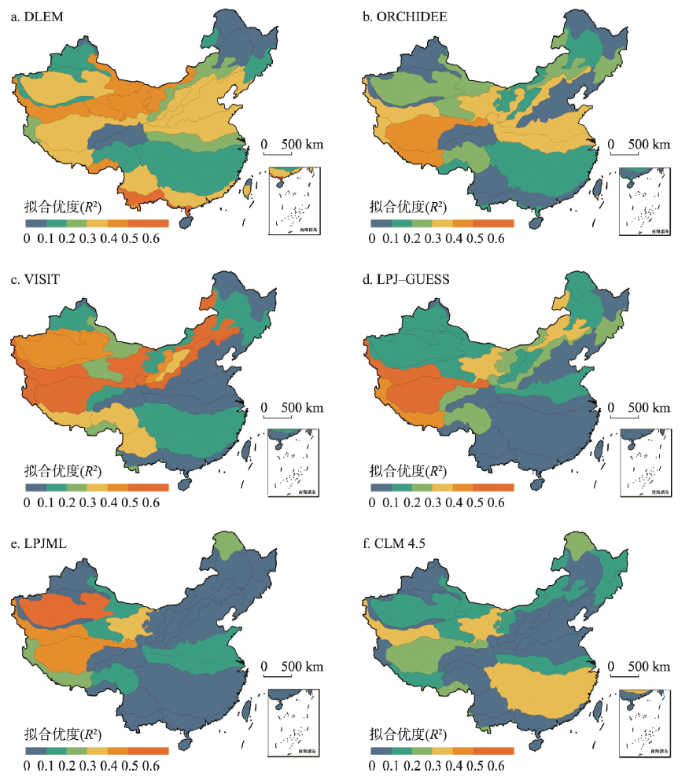
图2
修正后各模式值与遥感反演值的拟合优度
注:基于自然资源部标准地图服务网站GS(2016)1585号标准地图制作,底图边界无修改。
Fig. 2
The goodness of fit between the corrected model values and the remote sensing inversion values
3.2 验证新NPP序列
图3
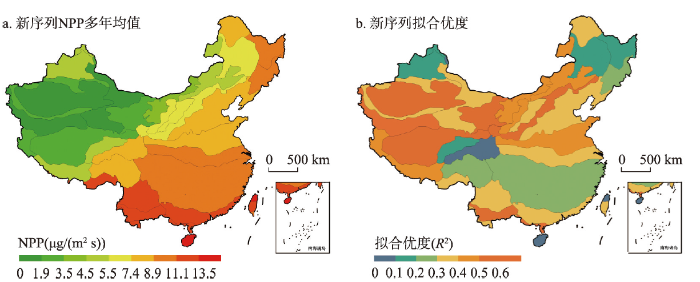
图3
新NPP序列的多年均值及拟合优度
注:基于自然资源部标准地图服务网站GS(2016)1585号标准地图制作,底图边界无修改。
Fig. 3
The multi-year mean values and goodness of fit for the new NPP sequence
然而,虽然新序列较好地描述了验证期内的空间分布,但由于合成方式和模式数据本身的不足,仍存在较大的不确定性。这一方面是因为新序列在合成过程中综合了所有6个植被动态模式的数据,因此单个模式在特定植被地带的强适用性被其余模式进行了削弱,比如高寒荒漠地带VISIT模式数据的拟合优度为0.66,但合成后新序列的拟合优度降为了0.61。另一方面,模式数据本身在估算过程中没有考虑部分影响因素,尤其是人类活动的影响,使得所有的模式数据在部分人为干预强烈的地区拟合优度极低。特别是青藏高原西南部的高寒草甸、高寒灌丛草甸地区,在6个模式数据中拟合优度都小于0.2,因此在合成后的新序列中和周围高寒草原、温性草原等地带0.4以上的拟合优度形成了较为鲜明的对比(图3b)。这很大程度上考虑是该区域在放牧管理之前存在的长期重度放牧破坏了脆弱且难以修复的生态系统,使得牧民定居点出现的放射性逆向演替[33]和水土流失[34]所致。
3.3 未来趋势
两种路径下2016—2050年中国平均NPP都呈波动上升趋势,RCP2.6路径下在2025年以前增长迅速,之后逐渐变缓;RCP6.0路径下则一直呈现近似线性的稳定增长趋势。2035年和2050年RCP2.6路径下平均NPP分别达到了8.8 μg/(m² s)和9.7 μg/(m² s),RCP6.0路径下节点平均NPP相对于RCP2.6路径略大,离散程度更高,但由于两个时间节点前后存在较大的波动而差异不明显(图4)。
图4
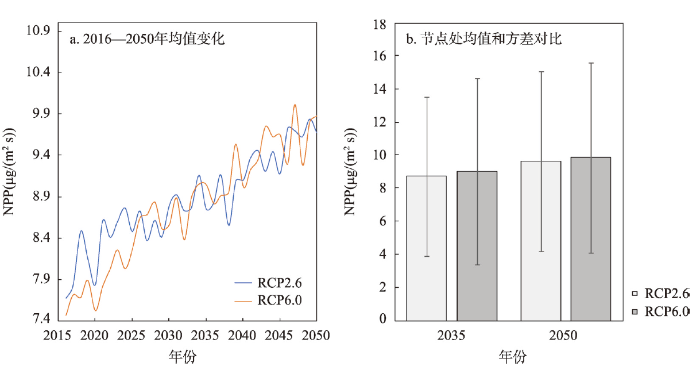
图4
2016—2050年两种RCP路径下NPP年均值变化
Fig. 4
Changes of annual average NPP under two RCP scenarios from 2016 to 2050
从空间分布来看,未来中国NPP在两种浓度路径下仍将保持从东南向西北递减的整体趋势。在RCP2.6路径下,2016—2035年的平均NPP最大值位于南热带季雨林、湿润雨林地带(ⅤAii),达到了17.8 μg/(m² s),从南热带向北、向西逐植被地带递减,在西北塔里木盆地附近的暖温带灌木半灌木裸露地(ⅦBiib)最小,为2.8 μg/(m² s)(图5a);2035—2050年相较于前20年中国东南、华北地区的大部分亚热带常绿阔叶林和暖温带落叶阔叶林的平均NPP整体变大,平均NPP最大的南热带季雨林、湿润雨林增加为了1.83 μg/(m² s),西北地区除暖温带灌木、半灌木荒漠外其余地区变化幅度较小(图5c)。与RCP2.6路径相似,RCP6.0路径下两个时间段内平均NPP的整体分布及最值所在区域保持不变,2035—2050年平均NPP相较于2016—2035年仍然整体较高,尤其是内蒙古高原东北部、东北平原及长白山脉附近增加明显(图5b、5d)这和部分研究得出的气候变暖使植被生长活动呈显著上升趋势的结论一致[35]。
图5
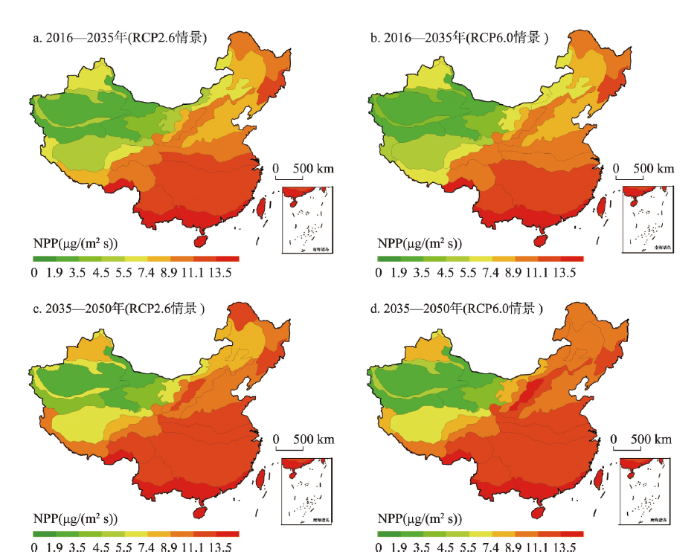
图5
2035—2050年两种浓度路径下未来各植被带NPP多年均值
注:基于自然资源部标准地图服务网站GS(2016)1585号标准地图制作,底图边界无修改。
Fig. 5
The multi-year average NPP of each vegetation zone in the future under the two RCP scenarios from 2016 to 2035
两种浓度路径下均值的对比上,RCP6.0路径下植被NPP的均值将变得更加极端,即有更多中东部地区的高值地带平均NPP将在RCP6.0路径下大于RCP2.6路径,更多西北低值区植被地带平均NPP将在RCP6.0路径下小于RCP2.6路径。这种现象在NPP均值处于中间大小(RCP2.6路径下介于3.8~5.6 μg/(m² s)之间)的青藏高原荒漠亚区和内蒙古高原、东北平原的草原亚区尤为显著。在2016—2035年间,RCP6.0路径下的高寒荒漠地带平均NPP小于RCP2.6路径,而温带灌木乔草半荒漠亚区平均NPP则大于RCP2.6路径(图5a、5b);到了2035—2050年,RCP6.0路径下高寒荒漠、温性荒漠、以及暖温带灌木半灌木荒漠亚区都小于RCP2.6路径,而温带灌木乔草半荒漠亚区、温带北部典型草原和草甸草原、温带南部森林(草甸)草原平均NPP则大于RCP2.6路径(图5c、5d)。这可能是主导中国中东部地区和西北地区NPP变化的气象要素不同所致。
从变化速率来看,随着时间的推移,中国植被NPP的主要增长区和增长速率在两种路径下都会有一定程度的收缩和减小。在RCP2.6路径下,2016—2035年间平均NPP在秦岭淮河以南及青藏高原的大部分植被地带增长显著,增长速率由南向北递减,在东南北热带半常绿季雨林、湿润和青藏高原西部温性荒漠地带增速较快(年增>0.15 μg/(m² s)),在北方内蒙古、新疆和东北大部分地区增长不显著(图6a);2035—2050年间NPP主要增长区由前20年的南方地区开始向北偏移,平均NPP在华北地区增长变得显著,在西南、中南地区增速变慢,整体显著增长的面积减小(图6c)。同样,RCP6.0路径下2035—2050年间NPP的主要增长区相较于前20年开始向东北、东南和西部地区退缩,中东部地区增长变不显著(图6b、6d)。
图6
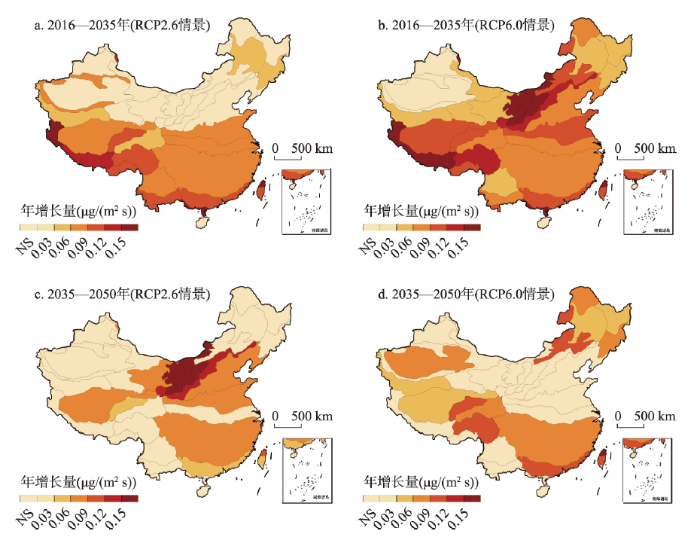
图6
未来路径下各植被地带NPP平均年增长量
注:基于自然资源部标准地图服务网站GS(2016)1585号标准地图制作,底图边界无修改;图中NS区域增长不显著。
Fig. 6
The average annual growth of NPP in each vegetation zone under the future scenariosc
高浓度路径对2016—2035年间植被NPP的增长主要起促进作用,2035—2050年NPP的增长主要起抑制作用。2016—2035年RCP6.0路径下的NPP增长区在RCP2.6路径的基础上扩展到了中国东北部的暖温带落叶阔叶林、温带针叶落叶阔叶混交林、寒温带针叶林和温带草原的大部分区域,特别是华北地区的温带灌木乔草半荒漠亚区、温带南部荒漠草原亚区带和温带南部典型草原等植被地带由不显著增长变为了年增长值大于0.15 μg/(m² s)的显著增长,其余大部分区域增长速率也有不同程度的提升(图6a、6b)。2035—2050年RCP6.0路径下相比RCP2.6路径原本华北高增长区逐渐偏移到了东北地区和塔里木盆地附近,总体速率降低,增长区面积减小,只有青藏高原东南部的高寒灌丛草甸地带和亚热带山地寒温性针叶林地以每年0.07 μg/(m² s)和0.11 μg/(m² s)的较低速率开始显著增长(图6c、6d)。
4 讨论
新序列虽然能较好地反映未来全国NPP的空间分布和增减趋势,但由于合成方法、模式构建的不足和部分地区解释程度不高等原因不一定能准确反映遥感反演数据的各项特征。因此,本文进一步对比了验证期内遥感反演序列和新NPP序列对气象要素的响应情况,以探究新序列在描述气候变化背景下NPP变化格局的准确性。由遥感反演值和气象要素间的相关关系可知(图7a),植被NPP对气象因子的响应与植被带所处的干湿情况密切相关。在处于湿润与半湿润地区的大部分植被地带中,NPP与降水、气温和日照呈现显著的正相关关系,与相对湿度、风速呈现不显著的负相关;在处于干旱和半干旱地区的大部分植被带中,NPP与降水、相对湿度和风速呈现显著的正相关,与气温和日照呈现不显著的负相关。
图7
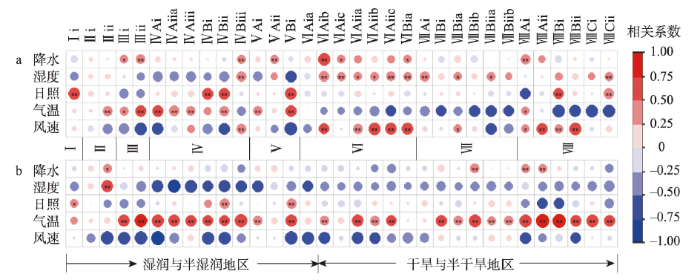
图7
植被NPP与气象要素的相关系数
注:a为遥感反演值与气象要素的相关系数;图b为合成的模式值与气象要素的相关系数;蓝色表示负相关,红色表示正相关;圆圈的大小和颜色深度表示相关系数的大小;**和*分别表示p < 0.05和p < 0.1。
Fig. 7
Correlation coefficient between vegetation NPP and meteorological elements
模式对大部分湿润与半湿润地区的NPP与气象要素的相关关系模拟较好(图7b),只在亚热带山地寒温性针叶林的相关性反映上出现了与遥感反演结果相反的情况。同时模拟的新序列在保持显著性基本不变的情况下,对原有的相关关系进行了整体强化,即5项相关系数的绝对值相较于遥感反演结果偏大。但在干旱与半干旱地区,模式仍然延续了湿润区域的相关关系,准确性较差,这一方面可能是由于CLM4.5和DLEM两个充分考虑了水汽条件的模式在新NPP的合成过程中所占权重较小,导致新NPP序列对影响植被生长状况的蒸腾、蒸散等[36-37]水分条件的变化反应不敏感;另一方面则可能是因为所使用的几个全球模式一般在较小的空间尺度上经过修正后适用性较好,但在较大的空间尺度上很容易忽略局部特征,尤其是模式数据难以刻画的人为影响[38]。因此,除了进一步准确率定模式中的各项参数外,未来植被动态模式想要在中国陆表区域更为准确地估测植被NPP,就需要进一步完善模式中描述水汽特征的模块,特别是LPJ-GUESS和VISIT两个没有考虑土—水—热耦合的模式。
同时,由于模式值在大部分干旱与半干旱地区对气象要素响应的准确性较差,甚至将青藏高原的高寒荒漠、温性荒漠等地带NPP和气温间的负相关关系反映为了正相关,使得这部分区域NPP在未来高浓度路径下相对于低浓度路径的减少量被严重低估。根据基于CMIP5多模式的预估,未来中国大部分区域在高浓度路径下平均气温和降水都会更大。其中,相对于RCP2.6路径,高浓度路径下平均气温在青藏高原,平均降水在内蒙古高原东北部、华北平原、东北平原西部的增长将尤为显著[39]。而模式值由于没有准确描述气温和NPP间的相关关系,因此基本不能反映这部分升高的气温对青藏高原部分地区NPP的抑制,升高的降雨对内蒙古高原典型草原和荒漠草原部分地区NPP的促进,从而低估了高浓度路径下的极端化。这和金凯等[40]分析气候变化对植被的影响时提出的未来变暖将对中国西北和东北部分地区的植被变化具有一定的负面影响,以及高江波等[41]指出的温度升高可能引起青藏高原地区植被受干旱影响加剧的结论能相互印证。因此,未来青藏高原西北部的高寒荒漠、温性荒漠及灌木、半灌木荒漠将成为受气候变暖不利影响较为严重的区域。
此外,作为6个植被动态模式的验证数据,遥感产品的准确性对本文的结果起着重要影响。相较于其余基于遥感影像数据的产品,该遥感数据在可接受的范围内略微偏低,可能使得本文预测的2035年和2050年两个节点上的年总NPP偏低。但由于遥感数据、陈鹏飞等用于遥感数据验证的实测数据以及本文选用的6个植被动态模式数据在典型植被区内的相对大小关系基本一致,因此这种偏小基本不会影响本文对NPP空间分布和相对趋势的分析。
5 结论
本文通过修正和对比ISI-MIP中6个生态影响模式对中国NPP的估算结果,分析了不同模式在中国不同地区的适用性,通过加权平均合成了在中国陆表区域适用性更强的新序列,利用新序列对未来两种浓度路径下NPP的时空趋势进行了预测,并探究了各个植被区NPP和气象要素间的关系,主要结论如下:
模式数据计算所得的中国平均NPP整体偏高,其中以DLEM(8.5 μg/(m2 s))模式和遥感反演值(6.4 μg/(m2 s))最为接近,VISIT(12.6 μg/(m2 s))模式相对遥感反演值偏离最大。但模式数据基本准确地反映了NPP均值在热带季雨林、雨林区域最大,向北和向西逐区域递减的相对大小关系。修正后的单个模式数据对中国大部分区域NPP的拟合效果较差(R2 < 0.4),只在特定的植被地带有较强的适用性。对几类影响因素考虑更全面的DLEM模式和ORCHIDEE模式的拟合优度大于0.4的区域更多,可适用范围更广。
根据6个模式数据生成的新NPP序列结合了各模式在不同植被地带的模拟优势,整体拟合优度为0.85,在大部分植被地带的拟合优度也基本大于0.3,相比单个模式能更好地反映未来NPP的空间分布和增减趋势。但由于合成方式、模式数据本身的不足以及部分地带的低拟合优度,新序列对气象要素的响应在干旱与半干旱地区有较大的不确定性。
未来中国平均NPP的空间分布仍将保持由东南向西北递减的趋势,中国均值呈波动增长状态,在2035年达到8.8 μg/(m2 s),2050年达到9.7 μg/(m2 s)左右。随着时间的推移,RCP2.6路径下主要增长区将由南方地区向北偏移,在华北地区以>15 μg/(m2 s a)的速率显著增长,在西南、中南地区增速变慢,显著增长的面积减小;在RCP6.0路径下主要增长区将向东北、东南和西部地区退缩,中东部地区增长变不显著。高浓度路径对2016—2025年间植被NPP的增长主要起促进作用,但在2035—2050年间开始起抑制作用。同时,高浓度路径下NPP的空间分布将变得更加极端,特别是在模式数据低估了极端化程度的情况下,位于青藏高原西北部的高寒荒漠、温性荒漠及灌木、半灌木荒漠将成为受不利影响较严重的区域,在未来高浓度路径下增长缓慢或不增长。
参考文献
Trends in the sources and sinks of carbon dioxide
Policy-driven China's grain to green program: Implications for ecosystem services
Accelerated terrestrial ecosystem carbon turnover and its drivers
Increased activity of northern vegetation inferred from atmospheric CO2measurements
Using the Köppen classification to quantify climate variation and change: An example for 1901-2010
National Assessment Report of Climate Change (I): Climate change in China and its future trend
气候变化国家评估报告(Ⅰ): 中国气候变化的历史和未来趋势
Simulation and prediction of vegetation dynamics in the karst faulted basin from 2020 to 2050 in climate scenarios
基于气候情景的岩溶断陷盆地2020-2050年植被动态变化模拟预测
A continuous satellite-derived measure of global terrestrial primary production
Modeling net primary production of a fast-growing forest using a light use efficiency model
Variation trends of natural vegetation net primary productivity in China under climate change scenario
Based on the widely used Lund-Potsdam-Jena Dynamic Global Vegetation Model (LPJ) for climate change study, and according to the features of natural environment in China, the operation mechanism of the model was adjusted, and the parameters were modified. With the modified LPJ model and taking 1961-1990 as baseline period, the responses of natural vegetation net primary productivity (NPP) in China to climate change in 1991-2080 were simulated under the Special Report on Emissions Scenarios (SRES) B2 scenario. In 1961-1990, the total NPP of natural vegetation in China was about 3.06 Pg C a(-1); in 1961-2080, the total NPP showed a fluctuant decreasing trend, with an accelerated decreasing rate. Under the condition of slight precipitation change, the increase of mean air temperature would have definite adverse impact on the NPP. Spatially, the NPP decreased from southeast coast to northwest inland, and this pattern would have less variation under climate change. In eastern China with higher NPP, especially in Northeast China, east of North China, and Loess Plateau, the NPP would mainly have a decreasing trend; while in western China with lower NPP, especially in the Tibetan Plateau and Tarim Basin, the NPP would be increased. With the intensive climate change, such a variation trend of NPP would be more obvious.
气候变化情景下中国自然植被净初级生产力分布
Spatial pattern change and analysis of NPP in terrestrial vegetation ecosystem in China
中国陆地植被生态系统NPP空间格局变迁分析
Spatio-temporal distribution of natural grassland net primary productivity in China
中国天然草地净初级生产力时空分布
Terrestrial net primary production and its spatio-temporal patterns in China during 1982-1999
1982-1999年我国植被净第一性生产力及其时空变化
Analysis of spatial and temporal patterns of net primary production and their climate controls in China from 1982 to 2010
Terrestrial net primary productivity and its spatial-temporal variability in Western China
中国西部地区植被净初级生产力的时空格局
Sensitivity experiments on response of terrestrial net primary productivity in China to climate change during 1981-2008
1981-2008年中国陆地植被NPP对气候变化响应的敏感性试验
The effect of climate on the net primary productivity (NPP) of Pinus koraiensis in the Changbai Mountains over the past 50 years
Responses of vulnerability for natural ecosystem to climate change in China
气候变化情景下中国自然生态系统脆弱性研究
Climate change risk assessment of ecosystem productivity in the arid humid transition zone of northern China
DOI:10.11821/dlxb202107003
[本文引用: 1]

Climate change risk has been a challenge for the development of society. As the ecosystems in the arid/humid transition zone (AHTZ) in northern China are characterized by sensitive and complex response to climatic fluctuations, assessing the climate change risk for ecosystems in the AHTZ is of scientific significance to regional climate governance and risk management. This study utilized the net primary productivity (NPP) as the indice for risk assessment. Based on the climate data of five global climate models (GCMs) participating in the Coupled Model Intercomparison Project Phase 5 (CMIP5) and four Representative Concentration Pathways (RCPs), the NPP was simulated using an improved LPJ (Lund-Potsdam-Jena). A climate change risk assessment method was built to identify the climate change risk levels and their spatio-temporal distributions in the AHTZ at different periods in the future. Results show that NPP loss would gradually extend and aggravate the risk in the AHTZ from mid-term period to long-term period of the 21st century. The risk under the high-emission scenario would be more serious, mainly manifested as a negative anomaly and a downward trend of NPP. In particular, under RCP8.5, 81.85% of the area may face climate change risk, and 54.71% will reach a high risk. During 2071-2099, under RCP8.5, the NPP anomaly in the high-risk area will reach (-96.00±46.95) gC m-2 a-1, and the changing rate of NPP will reach (-3.56±3.40) gC m-2 a-1. The eastern plain of AHTZ and the eastern grasslands of Inner Mongolia are expected to become the main risk concentration areas. The future vegetation growth in these areas may be adversely affected by climate change. Increasing warming and intensifying drying may be important causes for future climate change risks.
中国北方干湿过渡区生态系统生产力的气候变化风险评估
DOI:10.11821/dlxb202107003
[本文引用: 1]
气候变化风险是人类社会发展面临的严峻挑战,评估识别对气候波动响应敏感且复杂的干湿过渡区生态系统所面临的气候变化风险是一个重要科学问题,对区域气候治理和风险管理具有科学意义。本文利用参与耦合模式比较计划第五阶段(CMIP5)的多气候模式多情景数据,通过改进和验证Lund-Potsdam-Jena(LPJ)动态全球植被模型,辨识未来不同时段生态系统生产力的气候变化风险等级及其时空分布,明晰气候因子对净初级生产力(NPP)风险的作用特征。结果表明:未来中远期干湿过渡区生态系统生产力面临的气候变化风险面积将可能扩大,风险等级将可能提升,高排放情景下的风险更加严重,主要表现为NPP距平为负,且仍有继续下降的趋势。尤其是典型浓度路径(RCP8.5)情景下,81.85%的地区将可能面临气候变化风险,54.71%将达到高风险。2071—2099年,RCP8.5高风险区的NPP距平将达到(-96.00±46.95) gC m<sup>-2</sup> a<sup>-1</sup>,NPP变化速率将达到(-3.56±3.40) gC m<sup>-2</sup> a<sup>-1</sup>。干湿过渡区东部平原和内蒙古东部草原区预估将可能成为风险主要集中区域,这些地区未来的植被生长将可能受到气候变化的不利影响,增温加剧和干旱程度加重可能是未来气候变化风险的重要驱动因素。
Prediction of net primary productivity of vegetation in main rubber areas of China under future climate change
未来气候变化情景下中国橡胶主产区内植被净初级生产力预估
Productivity and carbon dynamic of the Masson pine stands in Jigongshan region based on LPJ-GUESS model
基于LPJ-GUESS模型的鸡公山马尾松林生产力和碳动态
Simulation of potential vegetation distribution and estimation of carbon flux in China from 1981 to 1998 with LPJ dynamic global vegetation model
LPJ模型对1981-1998年中国区域潜在植被分布和碳通量的模拟
The dynamic land ecosystem model (DLEM) for simulating terrestrial processes and interactions in the context of multifactor global change
DOI:10.11821/xb201009001
[本文引用: 1]
<p>The Dynamic Land Ecosystem Model (DLEM) was developed to meet critical needs for understanding and predicting the large-scale patterns and processes of terrestrial ecosystems and continental margins, and complex interactions among climate, ecosystem and human in the context of multifactor global change. The DLEM couples major biophysical, biogeochemical, vegetation dynamical and land use processes, and works at multiple scales in time step ranging from daily to yearly and spatial resolution from meters to kilometers, from region to globe. The DLEM is characterized by the following features: 1) multiple factors driven; 2) fully-coupled cycles of carbon, nitrogen and water; 3) concurrently simulation of major greenhouse gases (CO<sub>2</sub>, CH<sub>4</sub>, N<sub>2</sub>O, & H<sub>2</sub>O); 4) dynamically tracking changes in land cover/use and vegetation distribution. The model has been validated against site-specific measurements across the globe and applied at various scales. In this paper, we have briefly addressed model structure, parameters, key processes and major input/output variables. As a case study, we presented the simulated global fluxes of net primary productivity, evapotranspiration and methane during 1948-2005 and their spatial patterns in the year 2000. We also identified major gaps in terrestrial ecosystem modeling and field observations, and further discussed some critical future research needs.</p>
全球变化与陆地系统综合集成模拟: 新一代陆地生态系统动态模型(DLEM)
DOI:10.11821/xb201009001
[本文引用: 1]
人类社会从陆地生态系统获取生产和生活资料的同时也作为一种干扰形式改变着地气之间的动态平衡。这三个既独立又相互耦合的子系统共同组成了一个复杂的陆地系统。如何深入理解这一系统的过程和机制是人类应对气候变化挑战的前提条件。陆地生态系统模型作为一种集成工具,已广泛应用于全球变化研究的各个领域,但从输入数据到模型结构和过程等诸多方面仍存在很大的不确定性。近年来,随着大气和地面生态观测网络的不断完善以及遥感等空间技术的不断强大,使陆地生态系统模型进一步发展和突破成为可能。新一代多因子驱动的陆地生态系统动态模型(Dynamic Land Ecosystem Model, DLEM) 正是在这一背景下应运而生的。本文旨在介绍DLEM的主体框架、输入输出变量、关键过程、主要功能和特点。
Developments and applications of terrestrial biosphere model
DOI:10.17521/cjpe.2019.0315
[本文引用: 1]
Exchanges of energy and matter between terrestrial biosphere and atmosphere and hydrosphere create critical feedbacks to Earth’s climates. To quantify how terrestrial ecosystems respond and feedback to global changes, terrestrial biosphere model (TBM) has been developed and applied in global change ecology during the past decades. In TBMs, myriad of biogeophysical, biogeochemical, hydrological cycles and dynamics processes on different spatial and temporal scales are represented. The TBMs have been applied on assessing and attributing past changes in terrestrial biosphere, and on predicting future changes and their feedbacks to climates. Here, we provide an overview of processes included in TBMs and TBMs applications on carbon and hydrological cycles, as well as their application on exploring human impacts on terrestrial ecosystems. Finally, we outline perspectives for future development and application of TBMs.
陆地生物圈模型的发展与应用
DOI:10.17521/cjpe.2019.0315
[本文引用: 1]
陆地生物圈与大气圈和水圈之间能量、水和碳氮等元素的交换和循环对整个地球系统产生了深刻的影响。陆地生物圈模型(TBM)是研究陆地生态系统如何响应和反馈全球变化的重要方法和工具。通过对从生态系统到区域和全球陆地生物圈不同空间尺度的植被动态、生物地球物理和生物地球化学循环过程、水循环和水文过程、自然干扰和人类活动等过程时间动态的模拟, 陆地生物圈模型被广泛地应用于评估和归因过去陆地生物圈的时空变化和预测陆地生物圈对未来全球变化的响应和反馈。该文简要回顾了陆地生物圈模型的发展, 总结了模型对陆地生态系统主要过程的刻画和模型在生态系统生态学的应用, 并对未来陆地生物圈模型的发展和应用进行了展望。
Simulation and evaluation of gross primary productivity in China by using land surface model CLM4
基于陆面过程模式CLM4的中国区域植被总初级生产力模拟与评估
Monthly NPP dataset covering China's terrestrial ecosystems at north of 18°N (1985-2015)
北纬18°以北中国陆地生态系统逐月净初级生产力1公里栅格数据集(1985-2015)
Quantifying the impacts of anthropogenic activities and climate variations on vegetation productivity changes in China from 1985 to 2015
The conservation patterns of grassland ecosystem in response to the forage-livestock balance in North China
North American terrestrial CO2 uptake largely offset by CH4 and N2O emissions: Toward a full accounting of the greenhouse gas budget
Implications of incorporating N cycling and N limitations on primary production in an individual-based dynamic vegetation model
Parameterization improvements and functional and structural advances in Version 4 of the Community Land Model
A simulation model of the carbon cycle in land ecosystems (Sim-CYCLE): A description based on dry-matter production theory and plot-scale validation
Dynamic change of landscape patterns and its driving mechanism in the Qinghai-Tibetan alpine meadow
高寒草甸草原景观格局动态演变及其驱动机制
A study on correlations between vegetation degradation and soil degradation in the "alpine meadow" of the Qinghai-Tibetan Plateau
青藏高原高寒草甸的植被退化与土壤退化特征研究
Analysis of controlling factors for vegetation productivity in Northeast China
中国东北地区植被生产力控制因素分析
DOI:10.11821/dlxb202001005
[本文引用: 1]
植被生长季长度和生长强度是形态上影响植被生产力变化的重要因子。全球变暖情景下,北半球中高纬度大部分地区植被生长季显著延长并对植被生产力产生正向反馈,而植被生长强度变化情形及对生产力的控制作用并不清晰。中国东北地区属于中纬度温带地区,具有较高的植被覆盖度和丰富的植被类型,探索其植被生长季长度和强度的变化及对生产力的控制作用有利于理解和应对该地区的生态系统变化。以中国东北为研究区,基于1982—2015年长时序遥感植被指数数据(NDVI3g),利用曲率求导法确定植被生长季开始点(SOS)、结束点(EOS)、生长季长度(LOS)和夏季最大生长季强度(GM)等关键物候参数,然后利用相对重要性(RI)方法定量分析了生长季长度和强度对植被生产力长期变化趋势的相对贡献及时空格局。结果表明:① 研究区整体的植被生产力和生长强度呈现增强趋势,而生长季长度呈现缩短趋势,导致生长强度成为控制生产力变化趋势的主要因素(RI = 70%);② 在不同植被覆盖区域,生长季长度和生长强度对生产力的影响程度具有显著的空间差异。西部草原区植被生产力受生长强度控制最为显著(RI = 93%),其次为针叶林(RI = 66%)和阔叶林区(RI = 62%),农作物区生产力受生长强度影响最小(RI = 56%)。生长季长度对植被生产力的控制在农作物区最为显著(RI = 40%),在其他区域的影响约为27%~35%。各植被覆盖区生长强度与生产力均为正相关,生长季长度与生产力均为负相关;③ 气候因素(降水、温度)和物候变化均对主要贡献因子生长强度产生影响,其中SOS的变化对生长强度的影响程度和空间范围最为显著,主要表现为SOS推迟促进生长强度增强。本研究基于遥感数据发现1982—2015年间中国东北地区植被生长更加旺盛,但是植被生长活动主要受生长强度的影响,该研究可以为植被生产力变化模拟的参数选择提供新的线索。
Impacts of vegetation changes on global evapotranspiration in the period 2003-2017
DOI:10.11821/dlxb202103007
[本文引用: 1]
Evapotranspiration is a key variable and key process in global water cycle, and it is crucial for understanding how anthropogenic and climate changes have impacts on terrestrial water cycle. In the last decade, global vegetation changes are dramatic, reflected by land use and land cover changes and increase in leaf area index. It remains unclear how these changes influence terrestrial evapotranspiration processes. This study uses a coupled evapotranspiration and gross primary product model (PML-V2) that is run at 500 m and 8-day resolutions across the globe to investigate the impacts of vegetation changes on spatial pattern and dynamics of evapotranspiration in the period of 2003-2017. We found that evapotranspiration across the globe has increased noticeably because of vegetation changes, which is characterized by clear regional and non-regional patterns. Transpiration has strongly increased in the central and northern parts of North America, Europe, eastern China, southern Africa, and eastern and northern Australia. Under different land cover types, shrubs and cropland have been influenced strongly, and their impact is stronger in the post-2012 period than that in the pre-2012 period. The recent total increase from these two land cover types amounts to about 0.41 ×10³ km3 a-1, which is about 8 times of natural annual runoff from the Yellow River Basin. The results from this study can help improve the understanding of how vegetation changes caused by recent land use and land cover changes influence terrestrial water cycle and the potential local and regional climate change.
2003-2017年植被变化对全球陆面蒸散发的影响
DOI:10.11821/dlxb202103007
[本文引用: 1]
蒸散发是陆面水循环的关键环节和过程,是研究水循环对人类活动和气候变化响应的关键要素。过去十几年,全球下垫面的植被变化剧烈,但如何影响全球陆面蒸散发仍未得到清晰的揭示。本文采用500 m分辨率MODIS数据驱动PML-V2模型,定量解析了2003—2017年植被变化对全球陆面蒸散发的影响。结果显示:在全球尺度上,植被变绿使得全球蒸散发呈现显著的增加趋势,使陆地水循环加快;区域尺度上,植被变化对蒸散发的影响则存在明显的地带性和非地带性特征,如在北美洲中北部、欧洲、中国东部、非洲南部和澳大利亚东北部等地区,蒸散发总量的增加主要是由植被蒸腾增加而引起的。分析不同植被功能类型区的贡献显示,下垫面变化对灌木和耕地影响尤为明显,并在2012年以后呈现增强趋势;这2个植被类型区的全球年总蒸散发累积增加量为0.41×10<sup>3</sup> km<sup>3</sup> a<sup>-1</sup>,约为黄河流域多年平均径流量的8倍。该研究结果有助于进一步加强关于下垫面变化对陆地水循环的影响及其可能带来的局部气候变化的认识。
Spatio-temporal variations of the ratio of transpiration to evapotranspiration in forest ecosystems along the North-South Transect of Eastern China
DOI:10.11821/dlxb201901005
[本文引用: 1]
<p>The ratio of transpiration to evapotranspiration (T/ET) is a key parameter for quantifying water use efficiency of ecosystems and understanding the interaction between ecosystem carbon uptake and water cycling in the context of global change. The estimation of T/ET has been paid increasing attention from the scientific community in recent years globally. In this paper, we used the Priestly-Taylor Jet Propulsion Laboratory Model (PT-JPL) driven by regional remote sensing data and gridded meteorological data, to simulate the T/ET in forest ecosystems along the North-South Transect of Eastern China (NSTEC) during 2001-2010, and to analyze the spatial distribution and temporal variation of T/ET, as well as the factors influencing the variation in T/ET. The results show that: (1) The PT-JPL model is suitable for the simulation of evapotranspiration and its components of forest ecosystems in Eastern China, and has relatively good stability and reliability. (2) Spatial distribution of T/ET in forest ecosystems along NSTEC was heterogeneous, i.e., T/ET was higher in the north and lower in the south, with an averaged value of 0.69; and the inter-annual variation of T/ET showed a significantly increasing trend, with an increment of 0.007/yr (<i>p </i>< 0.01). (3) Seasonal and inter-annual variations of T/ET had different dominant factors. Temperature and EVI can explain around 90% (<i>p </i>< 0.01) of the seasonal variation in T/ET, while the inter-annual variation in T/ET was mainly controlled by EVI (53%, <i>p </i>< 0.05).</p>
中国东部南北样带森林生态系统蒸腾与蒸散比值(T/ET)时空变化
DOI:10.11821/dlxb201901005
[本文引用: 1]
植被蒸腾与蒸散的比值(transpiration/evapotranspiration, T/ET)表征了植被蒸腾对生态系统蒸散的贡献率,是准确量化生态系统水分利用效率的关键参数,对研究植被水分运移的生理生态机理以及碳水循环关系具有重要意义。基于站点数据验证PT-JPL模型(Priestly-Taylor Jet Propulsion Laboratory Model)模拟精度,集成遥感数据和气象栅格数据模拟中国东部南北样带森林生态系统2001-2010年T/ET,并分析其时空变化及影响因子。结果表明:① PT-JPL模型适用于中国东部森林生态系统蒸散及其组分模拟,具有较高的稳定性和可靠性;② 中国东部南北样带森林生态系统T/ET空间差异显著,整体呈南部低、北部高,主要由夏季T/ET空间格局主导;样带整体T/ET均值为0.69,2001-2010年呈显著缓慢上升趋势,增幅为0.007/yr(p p p
The spatial-temporal patterns of the impact of human activities on vegetation coverage in China from 2001 to 2015
DOI:10.11821/dlxb201903008
[本文引用: 1]
Based on MODIS-NDVI and climate data, using an artificial influence model based on coefficient of variation to quantitatively calculate the human impact of vegetation cover(NDVIH) in China from 2001 to 2015, Sen+Mann-Kendall model and Hurst index were used to analyze the spatial-temporal feature and the future trends. It was found that: (1) In the year from 2001 to 2015, the Spatial Differentiation of NDVIH in China was more obvious from southern part to northern part, with an average annual mean value of -0.0102, the vegetation coverage decreased slightly under human activities, the negative impact area accounting for 51.59% which is slightly larger than the positive impact area. (2) The interannual variation of NDVIH in China is obvious, showing the negative impact volatility decreased, the rate of decline is 0.5%/10a; among which the positive and negative effects all showed an increasing trend, the positive growth rate (0.3%/10a) is much larger than the negative impact (0.02%/10a). (3) During 2001-2015, the center of gravity of positive impact has moved to the northeast, the center of gravity of negative impact has moved to the southwest, vegetation cover in northeastern China has improved under the influence of mankind, and human activities in the southwest have increased the degree of vegetation destruction. (4) The proportion of "negative impact reduction" and "positive impact increase" trend of NDVIH in China appeared to be the largest which accounting for 28.14% and 25.21% of the total, and the ecological environment is improving. (5) The reverse characteristics of NDVIH change were stronger than the same characteristic in China, mainly showed a negative impact which decreased at the first and then increased with the rate of 15.59% of the total area.
2001-2015年中国植被覆盖人为影响的时空格局
DOI:10.11821/dlxb201903008
[本文引用: 1]
基于MODIS-NDVI和气温、降水数据,使用基于变异系数的人为影响模型定量计算了2001-2015年中国植被覆盖人为影响,辅以趋势分析、Hurst指数等方法探讨了中国植被覆盖人为影响的时空变化特征及未来演变趋势。研究发现:① 2001-2015年,中国植被覆盖人为影响由南向北空间分异愈发明显,年均值为-0.0102,植被覆盖在人类活动影响下轻微减少,负影响面积占51.59%,略大于正影响面积。② 中国植被覆盖人为影响年际变化特征明显,整体呈负影响波动减少趋势,降速为0.5%/10a,其中正影响、负影响均呈增大趋势,正影响增速(0.3%/10a)远大于负影响(0.02%/10a)。③ 2001-2015年间,中国植被覆盖人为正影响重心向东北方向移动,负影响重心向西南方向移动,东北部植被覆盖在人为影响下不断改善,西南部人类活动对植被破坏程度不断增大。④ 中国植被覆盖人为影响主要呈负影响减少和正影响增大趋势,面积占比分别为28.14%和25.21%,生态环境趋于改善。⑤ Hurst指数分析表明,中国植被覆盖人为影响未来演变趋势的反向特征强于正向特征,主要呈人为负影响先减少后增大趋势,面积占比15.59%。
Prediction of climate change over China and uncertainty analysis during the 21st century under rcps
RCPs情景下中国21世纪气候变化预估及不确定性分析
Contribution of climatic change and human activities to vegetation NDVI change over China during 1982-2015
1982-2015年中国气候变化和人类活动对植被NDVI变化的影响
DOI:10.11821/dlxb202005006
[本文引用: 1]
基于中国603个气象站的地表气温和降水观测资料以及GIMMS NDVI3g数据,采用变化趋势分析和多元回归残差分析等方法研究了1982—2015年中国植被NDVI变化特征及其主要驱动因素(即气候变化和人类活动)的相应贡献。结果表明:① 1982—2015年中国植被恢复明显,在选择的32个省级行政区中,山西、陕西和重庆的生长季NDVI增加最快,仅上海生长季NDVI呈减小趋势。② 气候变化和人类活动的共同作用是中国植被NDVI呈现整体快速增加和巨大空间差异的主要原因,其中气候变化对各省生长季NDVI变化的影响在-0.01×10 <sup>-3</sup>~1.05×10 <sup>-3</sup> a <sup>-1</sup>之间,而人类活动的影响在-0.32×10 <sup>-3</sup>~1.77×10 <sup>-3</sup> a <sup>-1</sup>之间。③ 气候变化和人类活动分别对中国近34年来植被NDVI的增加贡献了40%和60%;人类活动贡献率超过80%的区域主要集中在黄土高原中部、华北平原以及中国东北和西南等地;人类活动贡献率大于50%的省份有22个,其中贡献率最大的3个地区为上海、黑龙江和云南。研究结果建议应更加重视人类活动在植被恢复中的作用。
Revealing the climatic impacts on spatial heterogeneity of NDVI in China during 1982-2013
DOI:10.11821/dlxb201903010
[本文引用: 1]
Climate change is a major driver of vegetation activity, and thus its complex processes become a frontier and difficulty in global change research. To understand the complex relationship between climate change and vegetation activity, the spatial distribution and dynamic characteristics of the response of NDVI to climate change from 1982 to 2013 in China were investigated by the geographically weighted regression (GWR) model. The GWR was run based on the combined datasets of satellite vegetation index (GIMMS NDVI) and climate observation (temperature and moisture) from meteorological stations nationwide. The results noted that the spatial non-stationary relationship between NDVI and surface temperature has appeared in China. The significant negative temperature-vegetation relationship was distributed in northeast, northwest and southeast parts of the country, while the positive correlation was more concentrated from southwest to northeast. And then, by comparing the normalized regression coefficients for different climate factors, regions with moisture dominants for NDVI were observed in North China and the Tibetan Plateau, and regions with temperature dominants for NDVI were distributed in the East, Central and Southwest China, where the annual mean maximum temperature accounts for the largest areas. In addition, regression coefficients between NDVI dynamics and climate variability indicated that the higher warming rate could result in the weakened vegetation activity through some mechanisms such as enhanced drought, while the moisture variability could mediate the hydrothermal conditions for the variation of vegetation activity. When the increasing rate of photosynthesis exceeded that of respiration, there was a positive correlation between vegetation dynamics and climate variability. However, the continuous and dynamic responding process of vegetation activity to climate change will be determined by spatially heterogeneous conditions in climate change and vegetation cover. Furthermore, the description of climate-induced vegetation activity from its rise to decline in different regions is expected to provide a scientific basis for initiating ecosystem-based adaptation strategies in response to global climate change.
1982-2013年中国植被NDVI空间异质性的气候影响分析
DOI:10.11821/dlxb201903010
[本文引用: 1]
为研究气候变化与植被活动之间的复杂关系,采用1982-2013年GIMMS NDVI与气象站点温度与水分的监测资料,应用基于像元的地理加权回归方法,探究了中国植被NDVI及其动态特征对气候变化响应的空间格局。中国植被NDVI与地表温度呈空间非平稳关系,在空间上的负相关关系主要集中在东北、西北及东南部分地区,空间正相关则更为集中和连片;针对不同气候指标的标准化系数对比可知,植被NDVI受水分控制作用较为显著的区域主要集中在北方地区以及青藏高原,温度的主导作用区域则分布在华东、华中及西南地区,其中年均最高气温对NDVI的主导区域范围最广;植被NDVI动态与气候变率的回归结果表明,增温速率的升高会通过加剧干旱等机制对植被活动产生抑制作用,水分变率对植被活动的强弱起到了重要的调节作用。
