

1 引言
人类活动对近百年全球气候变化产生了重要作用[1]。土地利用反映了人类在土地上的活动,城市土地利用是地球上最高水平的人类活动体现,人口增加和城市化进程加快,导致了全世界城市土地利用快速变化[2⇓⇓-5]。全球城市人口从1960年占比33%上升到2016年的54%,2050年这一数字将达到66%[6-7]。随着城市化快速推进,自然地表逐渐被不透水表面(Impervious Surface, IS)所取代[8-9],IS增加将改变城区下垫面水热特性及大气成份,引起区域气候变化[10⇓⇓-13],进而对生态系统[2,14 -15]、人类健康[16⇓-18]、城市环境污染[19]产生重要影响。IS与气候关系是近年来学界和社会关注的热点问题[12,20 -21],揭示IS与区域气候关系及其反常气候现象,在科学认识人类活动对全球气候变化的深刻作用、实现城市可持续发展上具有重要科学和现实意义。
目前普遍认为IS增加会导致地表温度上升[3,11,16,22⇓ -24]。Yang等[23]对全球682个城市IS与地表温度研究,发现IS每增加1%气温上升0.0219 ℃。Morabito等[22]在都灵发现IS面积每增加10%,地表温度上升4.0 ℃。Arulbalaji等[24]研究发现1988—2019年位于印度西南部的特里凡得琅(Thiruvananthapuram)IS面积新增了58 km²,地表温度上升1.6 ℃。Estoque等[25]探讨了泰国曼谷、印度尼西亚雅加达、菲律宾马尼拉等三地的地表温度与IS和植被空间格局的关系,发现IS较植被表面气温高约3 ℃。以上案例说明不同大洲、国家、纬度区域内IS都有显著的增温效应,但增幅存在异质性;IS对区域降水格局影响主要表现在增加极端降水频率[20,26 -27]和降水量[27⇓-29]。在影响机理上,认为IS改变了区域气溶胶排放[30]、地表大气循坏、热力环境[31]、地表粗糙程度等,导致降水格局显著改变[32-33];过去几十年全球风速总体呈下降趋势[34-35],但下降的原因及机制目前仍不清楚[36]。部分研究认为风速与地表粗糙度有关,Li等认为中国风速下降是由于1960—1999年IS增加所致[37],发现在北京市区的风速较郊区下降的更多,IS可能是影响风速的重要原因[38];IS对地表辐射具有重要影响[39],IS区域人类活动剧烈,大气中颗粒物含量多,对短波辐射具有散射作用[40],相比透水表面(Pervious Surface, PS),短波辐射量可能下降20%。但同时IS地表反射率更低,二者抵消,总体差异不大[41]。在长波辐射上,研究认为IS对长波辐射具有增强效应[42]。但目前还未具体探讨IS与长波、短波辐射的数量关系与变化规律;在比湿上,已发现城市(IS)与郊区(PS)存在显著差异[43-44],揭示了随IS的增加,在长时间尺度上城市会出现“干岛现象”,目前在中高纬度均发现此现象[45]。而对中低纬IS与比湿的关系仍不十分清晰。综上,目前IS与气候的研究主要以地表温度、降水等单一气象要素研究为主,对风速、气压、比湿、辐射等气象要素关注较少。在IS气候现象方面,集中在“热岛”“雨岛”“干岛”和“风速低岛”等方面,但是否具有反常现象①(①IS反常气候现象指与“热岛”“雨岛”“干岛”和“风速低岛”等现象相反的气象要素特征,具体表现在IS相比PS温度更低、降水更少、湿度更高、风速更快、气压更高等方面。),目前尚未开展深入讨论。
滇中城市群是国家培育的19个城市群之一,2009—2018年IS增幅超过了80 km2/a,是1985—2018年来变化最快的阶段,也是西南地区城市化最快的区域之一,速度超越了全球大部分国家与区域,其城市地表正在经历快速、剧烈的变化。滇中城市群地处云贵高原,全年受副热带高压带控制,且分布有近800 km²的自然湖泊,具有独特的自然环境与地理区位。因此本文基于滇中城市群1985—2018年的IS与气象数据,讨论长时间尺度上IS与多气象要素的关系,主要解决以下关键问题:① 滇中城市群的IS时空演化特征;② 滇中城市群气候变化特征;③ 各气象要素与IS 面积的关系;④ 分析IS 的反常气候现象及成因。
2 研究区与研究方法
2.1 研究区概况
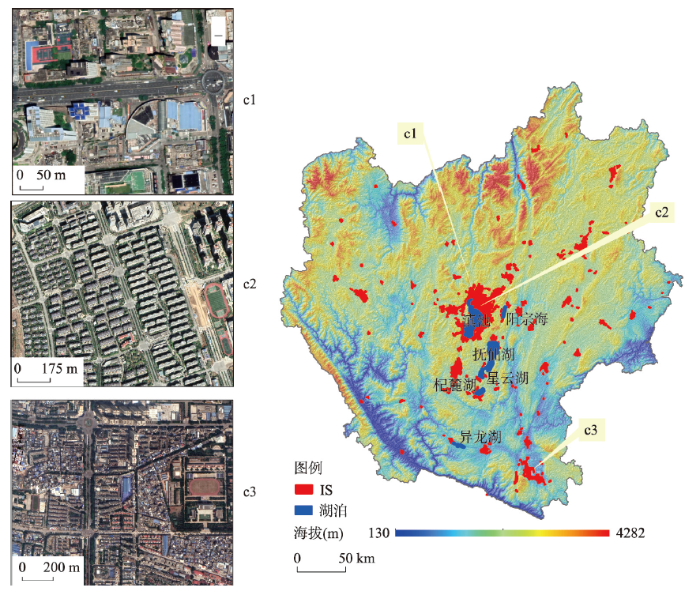
滇中城市群位于中国西南部的云南省(图1),范围包括昆明市、曲靖市、玉溪市、楚雄州全境及红河州北部7个市/州,共49个县级行政区,国土面积11.14万km2,2018年末常住人口2127万人,据预测2025年常住人口将达到2545万人,2035年将达到3050万人。滇中城市群处于城镇化快速发展阶段,5 a来城镇化率年均提高1.54个百分点,形成1个大城市、1个中等城市、8个小城市、27个县城组成的城镇体系,成为云南省新型城镇化的主体形态和现代化建设的重要载体。
图1
全球气候变化背景下,滇中城市群相继发生了2011年雨季干旱、2012年旱季干旱、2013年冬春干旱、2016年曲靖暴雨洪灾、2018年昆明、曲靖等地洪涝灾害等一系列极端天气。总体上滇中城市群季节降水更加不均,高温更加频繁。有效应对气候变化行动,需要以城市气候变化及其影响的科学认识为基础,因此探讨IS与气候关系对实现滇中城市群可持续发展,稳定发挥其文化、经济、政治中心功能具有重要现实意义。
2.2 数据来源及预处理
IS数据来源于清华大学②(②不透水表面数据来源:http://data.ess.tsinghua.edu.cn/ 。)1985—2018年全球IS数据集(GAIA)。该数据集基于长时序的Landsat光学影像(近150万景)及其他的辅助数据(夜间灯光数据及Sentinel-1雷达数据)。通过对典型年份的精度评价分析可知GAIA的平均总体精度超过了90%。同时对比全球主要的城市数据产品发现,GAIA在城市面积的量级和时序特征上更为合理[46]。
气象数据来自国家青藏高原数据中心中国区域地面气象要素数据集(1979—2018)③(③气象数据来源:https://data.tpdc.ac.cn/zh-hans/data/8028b944-daaa-4511-8769-965612652c49/ 。),包括近地面气温、近地面气压、近地面空气比湿、近地面全风速、地面短波辐射、地面长波辐射、地面降水率等7个要素。数据为NETCDF格式,时间分辨率为3 h,水平空间分辨率为0.1°。该数据集是以国际上现有的Princeton再分析资料、GLDAS资料、GEWEX-SRB辐射资料,以及TRMM降水资料为背景场,融合了中国气象局常规气象观测数据制作而成。原始资料来自于中国国家气象局观测数据、再分析资料和卫星遥感数据。已去除非物理范围的值,采用ANU-Spline统计插值。精度介于气象局观测数据和卫星遥感数据之间,好于国际上已有再分析数据的精度[47]。
2.3 主要研究方法
2.3.1 Mann-Kendall突变检验法
Mann-Kendall突变检验法是世界气象组织推荐用于提取序列变化趋势的有效工具,目前已经被广泛用于众多学科研究中,其优点是不需要样本遵从一定的分布,也不受少数异常值的干扰,更适用于类型变量和顺序变量,计算也较为方便。计算公式如下:
对于具有n个样本量的时间序列x,构造秩序列:
其中:
秩序列Sk是i时刻数值大于j时刻数值个数的和,可知k = 1时,S1 = 0。
在时间序列随机独立的假定下,定义统计变量:
式中:UFk为定义的统计量,UF1 = 0;E(Sk)、Var(Sk)是累计数Sk的均值和方差,在x1, x2, …, xn相互独立且有相同连续分布时,可通过以下公式进行计算
UF通过时间序列x1, x2, …, xn的顺序计算其统计量,UB通过时间序列x的逆序计算。给定显著水平α = 0.05,查得临界值为1.96。若|UF|>1.96,则表明序列存在显著的变化趋势。若UF>0,表明序列呈现上升趋势,UF<0表明呈下降趋势,UF = 0表明无变化趋势。若UF>1.96,则序列有显著上升趋势;UF<-1.96,则序列有显著下降趋势。若UF与UB在临界值之间出现交点则交点对应的时刻为突变开始时间。
2.3.2 贝叶斯模型
贝叶斯模型是目前解决非线性问题的有效工具,具有广泛的应用。
贝叶斯公式:
贝叶斯网络又称信度网络,是贝叶斯方法的扩展,是目前不确定知识表达和推理领域最有效的理论模型之一。其计算公式可以表述为:
令G = (L, E)表示一个有向无环图(DAG),其中L代表图形中所有的节点的集合,而E代表有向连接线段的集合,且令X = (xi), i∈L为其有向无环图中的某一节点i所代表的随机变量,节点x的联合概率可以表示为:
则称x为相对于有向无环图G的贝叶斯网络,其中
对于任意的随机变量,其联合概率可由各自的局部条件概率分布相乘而得出:
对贝叶斯模型的有效性检验,使用对数似然损失(Log-likelihood Loss)来验证,具体计算公式如下:
式中:Y为输出变量;X为输入变量;L为损失函数;N为输入样本量;M为可能的类别数;yij是一个二值指标,表示类别j是否是输入实例xi的真实类别;pij为模型或分类器预测输入实例xi属于类别j的概率。
3 结果与分析
3.1 滇中城市群IS的时空演化特征
滇中城市群的IS时空演化过程如图2。IS面积由1985年的768.13 km2,增加至2018年的2516.12 km2,34 a中IS面积增加了227.56%。对IS进行Mann-Kendall分析,1985—1987年(阶段Ⅰ),UF值 ≥ 0,表明IS为增加趋势,年均增加面积为73.87 km2,主要由于中国改革开放政策促进社会经济快速发展所致,据云南省统计年鉴数据,1978年全省城镇固定资产投资为0.20亿元,1980年为0.40亿元,1985年增加到3.85亿元,因此改革开放政策对云南城镇化发展具有重要影响;1988—1999年(阶段Ⅱ),UF值 ≤ 0,表明IS增加速度开始下降,年均增长速度比阶段Ⅰ时段下降了70.77%,经过10 a改革开发,云南城市基本建设完善,同时中国政府政策侧重于东部沿海地区,导致这一时段IS增速下降,在城镇固定资产投资上也呈现放缓趋势,1995年为9.92亿元,1999年为11.63亿元,2000年为10.38亿元;2000—2005年(阶段Ⅲ),其UF值 ≥ 0,说明IS增加速度开始上升,年增速比阶段Ⅱ时段快了52.50%,主要由于2000年后中国实施了西部大开发战略,加大了云南基础设施建设力度,主要体现在全社会固定资产投资上,2003年全省为1021.18亿元,2004年为1330.60亿元,2005年为1755.30亿元;2006—2008年(阶段Ⅳ),UF值继续增加,接近1.96达到显著水平,表明此阶段IS扩张速度进一步增加,其年均增加面积达到了63.66 km2,比阶段Ⅲ时段增长速度快了93.40%,主要由于经济与政策进一步向西部倾斜,城市化快速推进,导致IS快速扩张,此阶段社会固定资产投资大幅增加,2006年为2220.45亿元,2007年为2798.89亿元,2008年达到了3526.60亿元;2009—2018年(阶段Ⅴ),UF值≥ 1.96,表明IS扩张速度达到显著程度,年均增长面积达到了89.85 km2,为所有时段中扩张速度最快,主要原因是滇中城市群成为国家培育的19个城市群,导致IS增速达到高水平,2009年云南省社会固定资产投资增长率达到了28.4%,较2006—2008年高出近2%。总体而言,在过去的34 a中,滇中城市群IS演变主要分为5个阶段,第阶段Ⅰ为快速扩张阶段,第Ⅱ时段为增长停滞阶段,第Ⅲ时段为增长恢复阶段,第Ⅳ时段为增长加速阶段,第Ⅴ时段为增长高位阶段(表1)。
图2
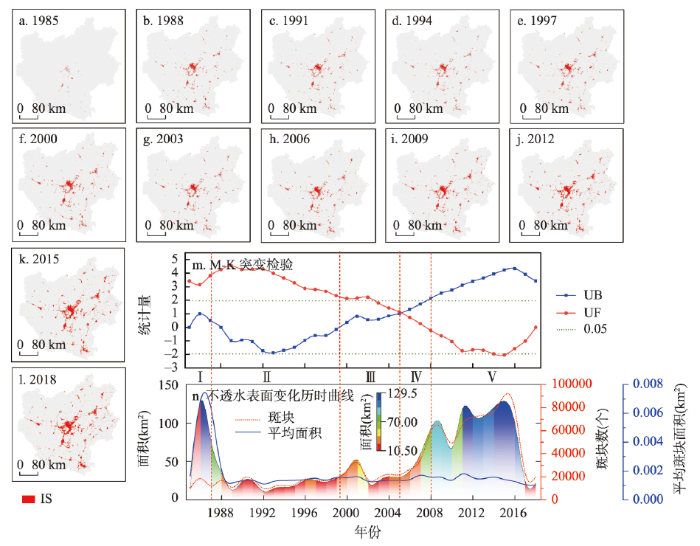
图2
1985—2018年滇中城市群不透水表面时空变化特征
注:Ⅰ~Ⅴ分别为滇中不透水表面变化不同的阶段,见
Fig. 2
Spatial and temporal changes of IS in the Central Yunnan urban agglomeration from 1985 to 2018
表1 1985—2018年滇中不透水表面变化特征
Tab. 1
| 阶段 | 时段 | 平均扩张速度(km2/a) | UF值特征 |
|---|---|---|---|
| Ⅰ快速扩张 | 1985—1987 | 73.87 | ≥ 0 |
| Ⅱ增长停滞 | 1988—1999 | 21.59 | ≤ 0 |
| Ⅲ增长恢复 | 2000—2005 | 32.92 | ≥ 0 |
| Ⅳ增长加速 | 2006—2008 | 63.66 | ≥ 0且持续增加,接近1.96 |
| Ⅴ增长高位 | 2009—2018 | 89.85 | ≥ 1.96 |
在空间上,分别计算1985—2018年E、N、NE、SE、S、SW、W、NW 8个方向的IS面积,并对各方向上的面积进行Mann-Kendall分析,结果如图3和表2。由表可知,IS主要向NE、SE、S、W 4个方向扩张,速度分别为7.68 km2/a、4.75 km2/a、17.28 km2/a和6.47 km2/a。在突变点上,E、S、SW、W 4个方向突变点为2007年,突变点后其IS增幅分别为264.39%、144.31%、94.62%和66.45%;N、NW的突变点为2006年突变点后增幅分别为214.36和29.56%,NW方向主要分布为湖泊和山地不利于IS扩张;NE方向的突变点为2003年,其UF值总体为增加趋势,即IS在各年份均在增加,2003年后为快速增加,增幅达到了283.63%,为8个方向中增速变化最大,主要原因是其位于大规模未开发的平地;SE方向的突变点位于2008年,突变时间较晚,但增幅较大,达到了195.67%。
图3
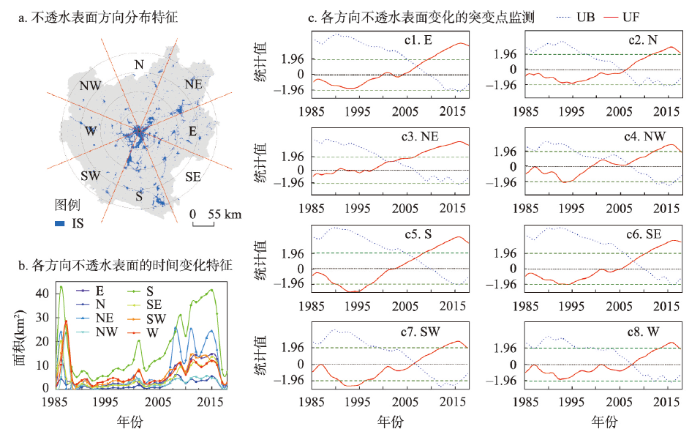
图3
滇中城市群不透水表面在各方向的增长特征与突变检验
Fig. 3
The growth characteristics and mutation test of IS in various directions in the Central Yunnan urban agglomeration
表2 滇中城市群不透水表面在8个方向的增长特征
Tab. 2
| 方向 | 平均增速(km2/a) | 突变点时间(a) | 突变点前速度(km2/a) | 突变点后速度(km2/a) | 增幅(%) |
|---|---|---|---|---|---|
| E | 5.30 | 2007 | 2.85 | 10.40 | 264.39 |
| N | 1.98 | 2006 | 1.13 | 3.54 | 214.36 |
| NE | 7.68 | 2003 | 3.41 | 13.91 | 283.63 |
| SE | 4.75 | 2008 | 3.01 | 8.91 | 195.67 |
| S | 17.28 | 2007 | 11.78 | 28.78 | 144.31 |
| SW | 6.79 | 2007 | 5.20 | 10.12 | 94.62 |
| W | 6.47 | 2007 | 5.33 | 8.86 | 66.45 |
| NW | 3.19 | 2006 | 2.89 | 3.75 | 29.56 |
总体而言,过去34 a滇中城市群IS主要向S扩张,E、S、SW、W方向于2007年后快速扩张,NE方向于2003年后开始快速扩张,N、NW方向于2006年后快速扩张,SW方向于2008年后开始扩张,NW方向增速变化最小,NE方向变化最大。
3.2 滇中城市群气候变化特征
通过重现滇中城市群过去34 a气象观测资料,并对其进行10 a等间隔统计如图4和表3。发现城市群内气温呈连续上升的趋势,2007—2018年气温相比1985—1995年升高了1.04 ℃,增幅为7.1%,为近30 a最热时期,表明城市群的气候呈偏暖趋势;降水量年际波动较大,呈先增加后下降的趋势,2007—2018年降水量较1985—1995年下降了18.59 mm,为滇中城市群最干的10 a,表明区内气候趋于干旱;比湿变化幅度较小,2007—2018年较1985—1995年下降了0.01 g/kg,近10 a比湿达到了极小值;风速总体为波动上升趋势,2007—2018年的风速较1985—1995年增加了12.2%,较1996—2006年增加19.3%,表明区内近10 a地表风速呈快速、剧烈增加趋势,主要由于东南季风加强所致;气压总体为持续上升趋势,2007—2018年较1985—1995年上升了108.42 Pa,主要由于副热带高压持续加强,面积增大所致;短波辐射2007—2018年较1985—1995年增加了0.55 W m2,总体变化不大,表明地表吸收的短波辐射呈增加趋势;长波辐射总体为波动上升趋势,2007—2018年长波辐射较1985—1995年增加了1.43%,较1996—2006年增加了0.74%,2018年较1985年增加了1.88%,总体而言,区内长波辐射在过去34 a为上升趋势,尤其2007—2018年增速显著加快。
图4
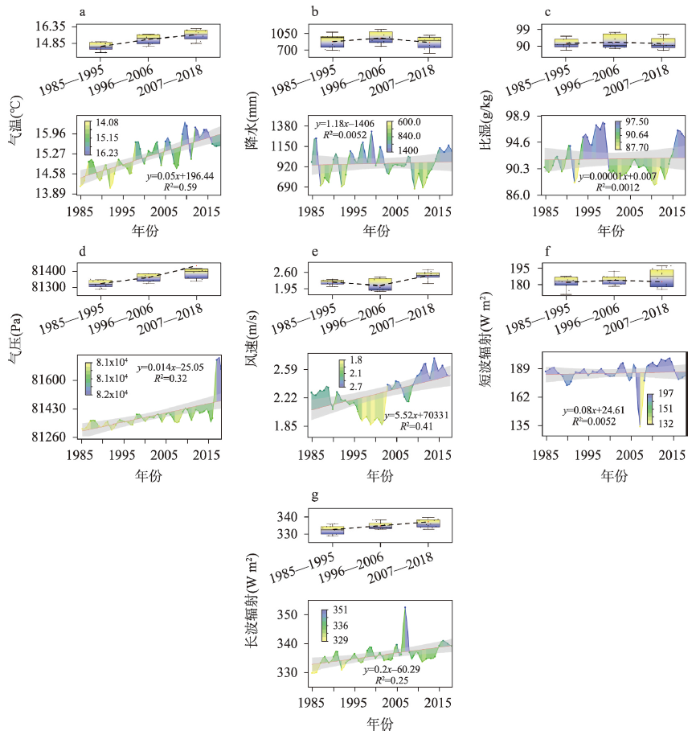
图4
1985—2018年滇中城市群各气象要素的变化特征
Fig. 4
Change characteristics of meteorological elements in the Central Yunnan urban agglomeration during 1985-2018
表3 1985—2018年滇中城市群各气象要素的变化统计
Tab. 3
| 气象要素 | 1985—1995年 | 1996—2006年 | 2007—2018年 |
|---|---|---|---|
| 气温(℃) | 14.62 | 15.27 | 15.66 |
| 降水(mm) | 895.91 | 971.95 | 877.32 |
| 比湿(g/kg) | 9.16 | 9.22 | 9.15 |
| 风速(m/s) | 2.20 | 2.07 | 2.47 |
| 气压(Pa) | 81322.77 | 81360.67 | 81431.19 |
| 短波辐射(W m2) | 182.08 | 184.07 | 182.63 |
| 长波辐射(W m2) | 332.50 | 334.78 | 337.26 |
综上,滇中城市群1985—1995年气温偏低,降水、湿度偏高,总体为冷湿气候;第1996—2006年气温相对偏高,降水、湿度最大,总体为暖湿气候;2007—2018年气温最高,降水和湿度最低,为暖干气候;在气象要素上,2007—2018年较1985—1995年气温上升了1.04 ℃、降水下降了18.59 mm、比湿下降了0.01 g/kg、风速增加了0.27 m/s、气压升高了108.42 Pa、短波和长波辐射分别增加了0.55和4.76 W m2。
3.3 不透水表面与透水表面的气象要素特征分析
分别提取1985—2018年IS和PS的逐年气温、降水、风速、短波和长波辐射、气压、比湿等要素,比较二者的差异,结果如图5。可知,IS和PS多年均温分别为15.91 ℃和15.27 ℃,且在时间序列上IS均高于PS,表明IS具有显著增温效应;IS与PS的风速差异较小,多年均值分别为2.26和2.29 m/s,PS风速总体高于IS,表明IS对风速具有减缓效应;IS多年长波辐射均值为338.46 W m2,PS为334.07 W m2,在时间序列上,IS长波辐射值均高于PS,表明IS具有更高的长波辐射量;IS多年比湿均值为9.72 g/kg,较PS多0.51 g/kg,且各年比湿值均高于PS,表明IS空气更湿;IS在1985—2018年年均降水量为941.32 mm,显著高于PS的903.05 mm,表明IS具有高降水的特征;IS与PS的短波辐射差异较小,二者的多年均值分别为184.99和185. 68 W m2,IS反射率低,吸收短波辐射能力强,但同时IS人类活动强,产生大量颗粒物,具有反射和散射作用,二者相抵导致其差异不大;IS多年平均气压为81927.43 Pa,较PS高602.64 Pa,表明IS气压更高。在时间序列上,气温、长波辐射、比湿和气压4个气象要素,各年IS值均高于PS,说明IS与PS之间存在显著、且稳定的差异。风速、降水和短波辐射3个气象要素,虽在均值上IS和PS呈现差异,但在时间上具有不连续性,即部分年份IS值高于PS,部分年份低于PS,说明IS和PS在上述3个气象要素上总体呈现差异化,但具有不稳定、不连续,易受外界干扰的特点。
图5
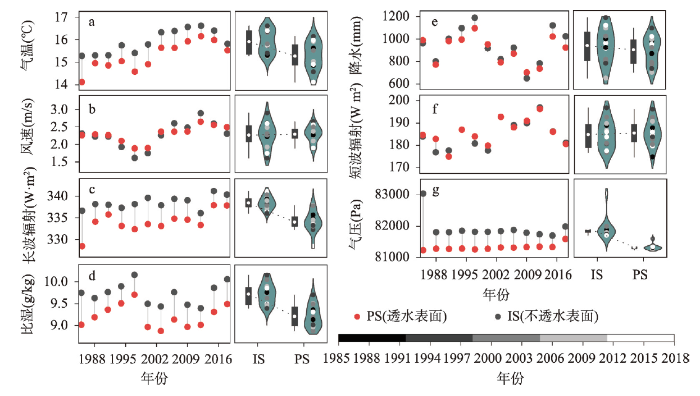
图5
滇中城市群不透水表面与透水表面的气候差异
Fig. 5
The climate difference between IS and PS in the Central Yunnan urban agglomeration
综上,IS较PS温度更高、气候更湿润、风速更慢、长波值更高、短波值更低、气压更高。IS与PS气候特征特具有显著差异,IS呈暖湿、少风、高压、以长波辐射为主的气候特征,PS呈干冷、多风、低压的气候特征。
3.4 不透水表面面积对气象要素的影响
通过构建贝叶斯模型,计算了IS覆盖比例与各气象要素的关系(对数似然损失值优于0.1),结果如图6。结果显示,滇中城市群的长波辐射主要分布在313~329 W m²区间内,IS与长波辐射在此区间内为正向关系,即随IS覆盖比例增加长波辐射分布的概率增加;比湿主要分布在8.9~9.9 g/kg区间,IS与比湿在区间内呈线性递增关系,表明随IS比例增加比湿分布的概率越大;气压主要分布在76235~79946 Pa区间,IS与气压的关系呈a>0的二次函数,即随着IS比例的增加,气压分布的概率先下降后上升;短波辐射集中分布在186~194 W m²区间内,IS与其呈线性递增关系,即短波辐射空间分布概率随IS比例增加而上升;降水主要集中分布在840~876 mm和876~998 mm两个区间内,第一区间内IS与降水为线性递减关系,第二区间内为线性递增关系,表明第一区间内降水随IS比例上升而下降,而在第二区间内为随IS比例上升而增加;风速主要位于2.08~2.38 m/s区间内,IS与风速为线性递增关系,即随IS比例上升分布概率增加;温度主要集中在13.85~15.85 ℃区间内,IS与温度呈线性递增关系,表明温度随IS比例增加而增加。
图6
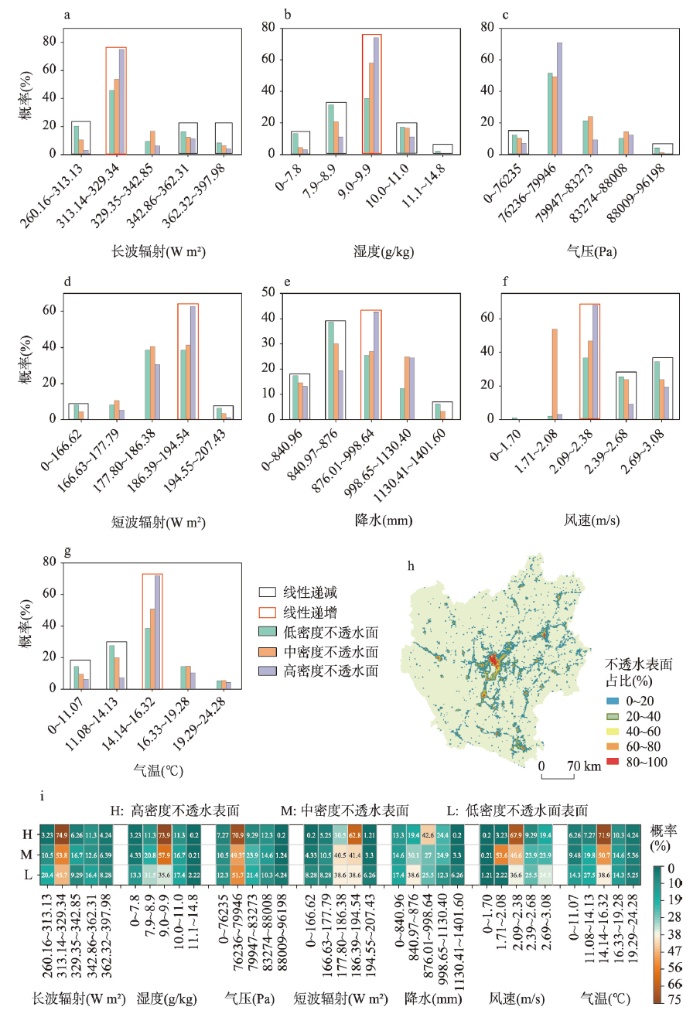
图6
滇中城市群不透水表面空间分布比例与各气象要素的关系
Fig. 6
The relationship between the IS spatial distribution ratio and various meteorological elements in the CYUA
综上,发现IS覆盖比例与气象要素关系具有以下规律:① IS对气象要素的影响具有一定的范围,在空间上只会在特定气象要素区间内产生显著效应,而不是整个研究区;② IS比例对气象要素在不同区间内具有完全不同的影响,总体来看IS比例增加会减缓研究区内气象要素极值分布概率;③ 滇中城市群的长波主要集中分布在313~329 W m²、比湿8.9~9.9 g/kg、气压76235~79946 Pa、短波186~194 W m²、降水840~876 mm和876~998 mm、风速2.08~2.38 m/s、气温13.85~15.85 ℃区间内,当各气象要素位于区间内时,显著受IS分布影响。
4 讨论
4.1 滇中城市群不透水表面变化的气候效应总体特征
如图7所示滇中城市群具有显著的“热岛效应”“雨岛效应”“湿岛现象”“风速低岛”“气压高岛”等效应与现象。
图7
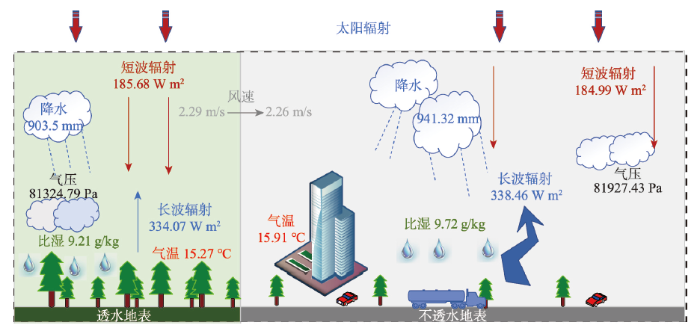
图7
滇中城市群不透水表面的气候效应
Fig. 7
The climatic effects of IS in the Central Yunnan urban agglomeration
在滇中城市群,随IS覆盖比例增加,气温显著升高。这与Sekertekin等[42]、Morabito等[22]、Yang等[23]的研究结论相似;同时IS的降水也多于PS,且随IS比例增加,降水显著增加。这与Braham等[48]、Changnon等[49]的研究结论一致;通过对比1985—2018年的滇中城市群风速数据,发现IS风速较其他区域更低,具有“风速低岛”,且与IS比例呈显著负相关关系。这与Li等[36]、Liu等[50]、Varquez等[51]、Xu等[52]、Lopes等[53]的研究结论一致;在辐射上,IS与PS的短波辐射差异较小,这与Oke等[41]的研究结果基本一致。而在长波上,本文发现IS显著高于透水面,且随IS比例增加,长波辐射显著增加,这与Sekertekin等[42]研究结论相似;但本文发现滇中城市群的IS与比湿和气压的关系与其他研究存在不一致,具有反常气候现象。
本文研究结论是基于1985—2018年数据得出的,研究目的是刻画IS对气候的影响,因此我们研究尺度是气候,根据世界气象组织的规定,一个标准气候计算时间为30 a。年、月、日、时等时间尺度属于天气和气象的研究时间范围,而不属于气候,因而我们没有对这些尺度进行分析;我们承认不同时间尺度下IS的气象、天气具有显著差异,但气候更多的是关注、侧重多年IS的气象、天气的平均结果,即是什么现象和天气占主导的问题。例如IS与PS的气温在日间与夜间、冬季与夏季具有显著的差异,但在气候尺度上我们更多关注的是多年平均结果,即IS增温问题。再如湿度,IS与PS的日间与夜间的湿度可能完全不同,具有“干湿岛转化”的现象,但在气候尺度上,侧重于总体是“干岛”还是“湿岛”,即IS的增湿问题;本文使用的气象数据是中国科学院青藏高原研究所基于3 h采样平均加权处理后,得到的年尺度数据产品,平均了研究区内,时、日、月等时间尺度上的气象特征,但目前的数据并没有区分日间和夜间气象要素的特征。虽然目前遥感技术具有了长足的发展,但在多年尺度上反演降水、气温、比湿、气压、短波辐射、长波辐射、风速等7个要素的日间与夜间数据仍有较高难度。尤其是在30 a以上的时间尺度上,目前仅有Landsat数据可以覆盖,但其时间分辨率为16 d,因此也无法获取日间和夜间数据。IS气候现象的时间多尺度研究,将是我们未来开展工作的主要方向。
4.2 不透水表面“湿度反常现象”形成的可能原因与机理
图8
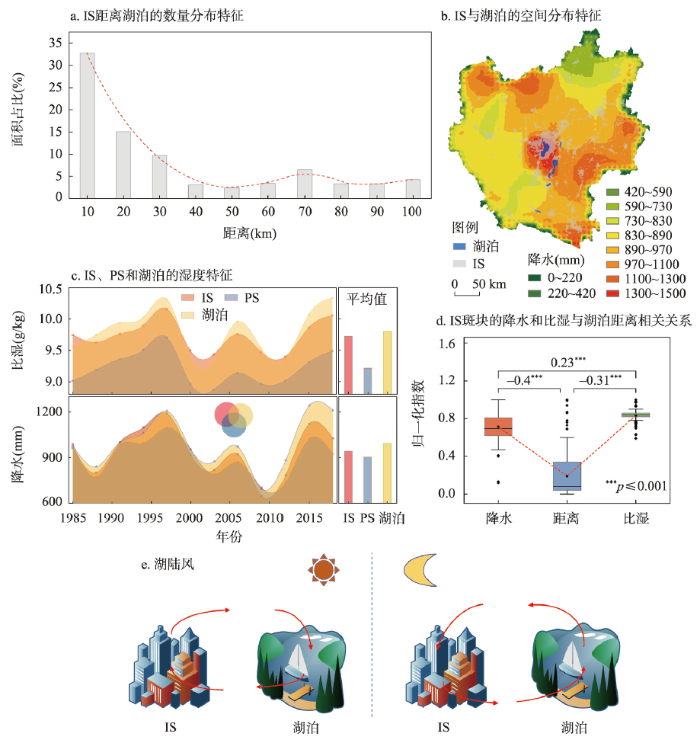
图8
滇中城市群不透水表面与湖泊空间关系
Fig. 8
Spatial relationship between IS and lakes in the Central Yunnan urban agglomeration
具有以下证据:
(1)滇中城市群具备“湖陆风”形成的基本条件,即湖和陆。滇中城市群分布有6个大型湖泊,总面积722.5 km2。在空间上IS紧靠湖泊分布,如图8a所示,距湖30 km内集中分布滇中城市群57.5%的IS。
(2)当地具有“湖陆风”湿度规律。“湖陆风”由湖泊向陆地输送湿润水汽,湖泊是源,陆地是汇,理论上湖泊湿度大于陆地。如图8c所示,滇中城市群在比湿和降水上均呈现:湖泊>IS>PS,表明湖泊是滇中城市群水汽含量最大区域,是调节区域气候的“水塔”,符合“湖陆风”湿度规律。
(3)当地具有“湖陆风”距离递减效应。理论上距离湖泊越近接收到的水汽越多,湿度越大。如图8d,可知IS的降水量和比湿与湖泊距离为负显著相关关系(r = -0.41和r = -0.31、p ≤ 0.001),表明随湖泊距离增加,IS的降水量与比湿呈显著下降趋势,说明湖泊是IS的主要水汽来源,且具有明显的距离效应。
4.3 不透水表面的“气压反常现象”形成的可能原因与机理
一般情况下,气压与温度呈负相关关系,即温度越高,气压越低。但本文结果显示,IS均温为15.91 ℃,气压为81927.4 Pa,PS均温为15.28 ℃,气压为81324.8 Pa,表现为温度越高气压越高,具有“气压—温度反常现象”。
本文认为造成滇中城市群IS“气压反常现象”的主要原因有两个,副热带高压和海拔。理论推理与假设:滇中城市群位于23°N~27°N之间,从全球大气环流来看,常年盛行下沉气候,表现为高压。赤道上升气流在23°N附近受地心引力、地转偏向力等影响,快速下沉,形成高压,越往北下沉的气流越少,因此滇中城市群气压在空间上应该呈现由南向北递减趋势。这种趋势下IS气压高的条件是其大部分要位于低纬高压区;在海拔上一般具有海拔越高气压越低的分布规律,因此IS气压高的条件是其海拔要低于PS;在温度上,IS一般具有的热岛现象,IS气温要高于PS的条件,是滇中城市群IS要具有显著的热岛现象。
具有以下证据:
(1)气压分布特征。绘制滇中城市群气压空间分布(图9b),发现随纬度增加,气压呈显著下降趋势,即越靠近23°N气压越高,符合副热带高压的纬度变化规律。
图9

图9
滇中城市群气压与海拔空间分布特征
Fig. 9
The spatial distribution characteristics of air pressure and DEM in the Central Yunnan urban agglomeration
(2)IS的气压分布特征。分别统计各个纬度上,气压、IS、透水面的分布特征(图9c),在25°10′N时IS增加幅度达到峰值,统计峰值前后的IS、透水面的占比及气压均值,发现25°10′N以南区域分布80.4%的IS和53.9%PS,以北IS为19.6%、PS为46.1%。而25°10′N以北区域(60330.1 Pa)气压显著低于南部(80106.9 Pa),说明大部分IS分布于南部的高压区域。
(3)IS与PS的海拔特征。分别统计IS与PS斑块的海拔值(图9d、9e),发现IS海拔均值为1769.70 m,PS为1898.02 m。IS的海拔更低,因此气压会更高。
(4)IS与PS的温度特征。IS具有“热岛现象”,会造成IS的气温高于PS。如图5a所示,1985—2018年滇中城市群IS的气温显著高于PS,因此具有显著的“热岛现象”。
综上,本文认为滇中城市群IS气压高于PS的原因可能是IS大部分位于低纬高压,同时IS海拔也低于PS,二者共同导致IS气压高于PS。IS气温高于PS的原因可能是受“热岛效应”影响。以上两方面共同作用造成了IS的“气压—温度反常现象”。但目前我们在大气环流的解释上还存在一定的局限性,需要进一步深化研究,完善证据链。
5 结论
过去30 a全球IS呈现快速增长,对全球气候变化、尤其是城市小气候产生了重要影响。虽然大量研究探讨IS时空变化特征及其“热岛”“雨岛”“风速低岛”“干岛”等气候现象,但较少关注IS气候反常现象。本文通过对滇中城市群1985—2018年来IS快速扩张分析,刻画其IS时空变化特征,对比IS与PS气候差异,探讨了IS气候反常现象。
1985—2018年滇中城市群的IS总体呈快速增加趋势,2009—2018年增长速度达到最大,主要在NE、SE、S、W 4个方向扩张,速度分别为7.68 km2/a、4.75 km2/a、17.28 km2/a、6.47 km2/a;相对1985—1995年滇中城市群的气温上升了1.04 ℃、降水下降了18.59 mm、比湿下降了0.01 g/kg、风速增加了0.27 m/s、气压升高了108.42 Pa、短波和长波辐射分别增加了0.55和4.76 W m2,气候总体转向干旱;IS与PS相比,IS的气温更高(+0.63 ℃)、湿度更大(比湿+0.51 g/kg,降水量+38.27 mm)、风速更慢(-0.025 m/s)、长波辐射量更大(+4.49 W m2)、短波辐射量更少(-0.68 W m2)、气压更高(+602.64 Pa),具有“热岛现象”“雨岛现象”“湿岛现象”“风速低岛现象”和“气压高岛现象”;IS比例与气象要素间具有以下规律:IS对气象要素的影响有限,在空间上只会在特定气象要素区间内产生显著效应,而不是整个区域。IS比例对气象要素在不同区间内具有完全不同的影响,总体来看IS比例增加会减缓研究区内气象要素极值分布概率。各气象要素显著受影响的区间为:长波313~329 W m2、比湿8.9~9.9 g/kg、气压76235~79946 Pa、短波186~194 W m2、降水840~876 mm和876~998 mm、风速2.08~2.38 m/s、气温13.85~15.85 ℃;IS与气压、比湿上具有“气压反温度现象”和“湿度反常现象”。IS的“热岛效应”与海拔和高压带由南向北递减可能是造成滇中城市群气压—温度反常的主要原因,湖泊及其“湖陆风”可能是造成IS比湿反常的主要原因。总体来看本文刻画了滇中城市群1985—2018年PS的时空变化特征、分析了IS的气候效应及其反常现象,这不仅有助于拓宽或深化我们对城市化气候影响因素的认识,同时也为全球持续变暖背景下的城市可持续发展提供了有价值的信息。
参考文献
Global change and the ecology of cities
MODIS detected surface urban heat islands and sinks: Global locations and controls
Mapping essential urban land use categories in China (EULUC-China): Preliminary results for 2018
Cities are the future
DOI:10.1126/science.352.6288.904 PMID:27199407 [本文引用: 1]
Application of high-resolution thermal infrared remote sensing and GIS to assess the urban heat island effect
The impact of impervious surface, vegetation, and soil areas on land surface temperatures in a semi-arid region using Landsat satellite images enriched with Ndaisi method data
Impervious surfaces are a significant issue of both urbanization and environmental assessment. However, it is a problem to classify impervious surface (IS) and soil areas as separate classes in land cover classification. The objectives of this study are to obtain impervious surface, vegetation, and soil areas clearly of an urban complex with a semi-arid climate and to better determine the relationships of IS, vegetation, and soil areas with land surface temperatures (LSTs). For this purpose, IS, vegetation, and soil areas in a semi-arid city of Turkey-Kayseri city were identified by using Normalized Difference Anthropogenic Impervious Surface Index (NDAISI) data and support vector machine (SVM) method together in the classification of different areas. Landsat 5, 7, and 8 satellite images of 1987, 2000, and 2013 were used, respectively, in this study. Afterward, the effects of these areas on LSTs were analyzed. Regression analysis was used to determine the relationships between land cover areas and surface temperatures. To better demonstrate these relationships, besides common pixel-based and classical regional-based approaches, a new density-based regional analysis approach was proposed. This study is an innovative one in terms of detecting IS and indicating relationships between land cover areas and surface temperatures in semi-arid regions. Another innovation of the study is related to the results produced. The results showed that decreasing LST values were observed with increasing IS and vegetation cover values and increasing LST values were observed with increasing soil areas. The present findings may provide significant contributions to the literature and will facilitate the development of urban planning strategies in semi-arid regions.
Climate response to rapid urban growth: Evidence of a human-induced precipitation deficit
Strong contributions of local background climate to urban heat islands
Six research priorities for cities and climate change
Impact of urbanization and land-use change on climate
Implications of agricultural transitions and urbanization for ecosystem services
Exploring the variation trend of urban expansion, land surface temperature, and ecological quality and their interrelationships in Guangzhou, China, from 1987 to 2019
Impacts of urbanization on the temperature-cardiovascular mortality relationship in Beijing, China
Impacts of climate change, population growth, and urbanization on future population exposure to long-term temperature change during the warm season in China
DOI:10.1007/s11356-019-07238-9
PMID:31902079
[本文引用: 1]

Climate change is anticipated to raise overall temperatures in the twenty-first century and is likely to intensify population exposure to heat during the warm season and, as a result, increase the risk of heat-related illnesses and deaths. While earlier studies of heat exposure and related health impacts generally focused on the acute effects of short-term exposure indicated by high daily temperature or several days of very hot weather, recent research has suggested that small changes in seasonal average temperature over a long period of time is likely to pose significant health risk as well. Using downscaled climate projections under three Representative Concentration Pathways emission scenarios, high-spatial-resolution population data, and the latest population projections by the United Nations, we aim at projecting future changes in long-term population exposure to summer heat across China in the mid- and late-twenty-first century resulting from global climate change. As the impacts of population growth are often overlooked in projecting future changes in heat exposure, we estimated changes in population-weighted average temperature in the warmest quarter over two future 20-year time periods and compared them with changes in temperature only. Our analysis shows that, nationally, population-weighted average temperature in the warmest quarter is projected to increase by 2.2 °C relative to the current situation in the 2050s and by 2.5 °C in the 2070s, as the result of climate change and population growth. Despite the foreseeable population stabilization in China, changes in population-weighted temperature are projected to be higher than changes in temperature itself for the majority of the 33 provinces (ranging from 0.02 °C to 1.27 °C, or 1% to 126% higher in the 2050s and from 0.02 °C to 1.16 °C, or 1% to 73% higher in the 2070s), with the largest differences mainly occurring in Western China. The impact of urbanization is projected to be relatively insignificant. Our findings provide evidence of possible underestimation of future changes in long-term exposure to summer heat if the effect of population growth is not factored in.
Urbanization and humidity shape the intensity of influenza epidemics in U.S. cities
Research on PM2.5 estimation and prediction method and changing characteristics analysis under long temporal and large spatial scale: A case study in China typical regions
Urbanization exacerbated the rainfall and flooding caused by hurricane Harvey in Houston
Climate change and sustainable development for cities
气候变化和城市可持续发展
Surface urban heat islands in Italian metropolitan cities: Tree cover and impervious surface influences
The relationship between land surface temperature and artificial impervious surface fraction in 682 global cities: Spatiotemporal variations and drivers
Impact of urbanization and land surface temperature changes in a coastal town in Kerala, India
Effects of landscape composition and pattern on land surface temperature: An urban heat island study in the megacities of Southeast Asia
Urbanization in megacities increases the frequency of extreme precipitation events far more than their intensity
Impact of urbanization on precipitation and temperature over a lake-marsh wetland: A case study in Xiong'an New Area, China
Nested high-resolution modeling of the impact of urbanization on regional climate in three vast urban agglomerations in China
Time series monitoring of impervious surfaces and runoff impacts in Metro Vancouver
Urban aerosols and their variations with clouds and rainfall: A case study for New York and Houston
Comments on "Rainfall Modification by Major Urban Areas: Observations from Spaceborne Rain Radar on the TRMM Satellite"
Effect of urbanisation on extreme precipitation based on nonstationary models in the Yangtze River Delta metropolitan region
Urban modification of convection and rainfall in complex terrain
Estimating the impact of the changes in land use and cover on the surface wind speed over the East China Plain during the period 1980-2011
Wind speed trends over the contiguous United States
Observed surface wind speed declining induced by urbanization in East China
The climate influence of anthropogenic land-use changes on near-surface wind energy potential in China
Changes in wind speed and extremes in Beijing during 1960-2008 based on homogenized observations
Spatiotemporal changes of urban impervious surface area and land surface temperature in Beijing from 1990 to 2014
Examining the impacts of urbanization on surface radiation using Landsat imagery
Simulation of future land surface temperature distribution and evaluating surface urban heat island based on impervious surface area
Urban/rural atmospheric water vapour pressure differences and urban moisture excess in Krefeld, Germany
Urban-rural humidity differences
Urban dry island phenomenon and its impact on cloud base level
Mapping global urban boundaries from the global artificial impervious area (GAIA) data
The first high-resolution meteorological forcing dataset for land process studies over China
Comments on "Uurban, topographic and diurnal effects on rainfall in the St. Louis region"
Heavy rainstorms in Chicago: Increasing frequency, altered Impacts, and future implications
The impact of urbanization on wind speed and surface aerodynamic characteristics in Beijing during 1991-2011
The effects of highly detailed urban roughness parameters on a sea-breeze numerical simulation
Steady decline of east Asian monsoon winds, 1969-2000: Evidence from direct ground measurements of wind speed
Urban boundary layer wind speed reduction in summer due to urban growth and environmental consequences in Lisbon
Rapid urbanization effect on local climate: Intercomparison of climate trends in Shenzhen and Hong Kong, 1968-2013
Urban heat island and urban dry island in Moscow and their centennial changes
Characteristics and numerical simulation of the lake/land breeze in Bosten Lake area
博斯腾湖的湖陆风特征及其数值模拟研究
DOI:10.7522/j.issn.1000-0534.2018.00072
[本文引用: 2]
采用基本气象站和区域气象站观测资料分析了2013年6月至2014年5月期间博斯腾湖的湖陆风日变化特征和季节特征,进而通过中尺度数值模拟分析博斯腾湖湖陆风的发展过程及其与天山山谷风的相互作用。结果表明,博斯腾湖北侧湖风与中天山南侧谷风叠加效应造成局地环流增强,从湖岸到山体,叠加效应造成的局地环流最大振幅表现出增大、减小、再增大的特点;湖岸区域湖风开始时间与距离的关系不显著,当离岸距离增大到约20 km以上,距离每增加约6 km,湖风开始时间推迟1 h;湖北侧湖风锋穿透内陆距离比受天山主体影响较小的湖南侧远约11 km;随着湖北侧湖风锋向天山靠近,湖风与谷风耦合作用不断加强。
Analysis of land-lake breeze characteristics of the east Dongting Lake
东洞庭湖湖陆风特征分析
Lake-induced atmospheric circulations during BOREAS
Observations and numerical modelling of lake Ontario breezes
Suppression of rain and snow by urban and industrial air pollution
Flood or drought: How do aerosols affect precipitation?
DOI:10.1126/science.1160606
PMID:18772428
[本文引用: 1]
Aerosols serve as cloud condensation nuclei (CCN) and thus have a substantial effect on cloud properties and the initiation of precipitation. Large concentrations of human-made aerosols have been reported to both decrease and increase rainfall as a result of their radiative and CCN activities. At one extreme, pristine tropical clouds with low CCN concentrations rain out too quickly to mature into long-lived clouds. On the other hand, heavily polluted clouds evaporate much of their water before precipitation can occur, if they can form at all given the reduced surface heating resulting from the aerosol haze layer. We propose a conceptual model that explains this apparent dichotomy.
