

1 引言
秦岭主脊平均海拔约在2500~3700 m,其中太白山主峰海拔3771.2 m,是秦岭的最高峰。认识秦岭山地的气象与气候要素特征及变化的首要手段是气象观测,当前秦岭以北的关中平原和以南的汉江盆地气象站相对密集,但气象站海拔都在800 m以下。而秦岭山地的气象站稀少,且位于谷地,海拔最高的是位于秦岭东段的华山站(海拔2065 m),其次是太白县气象站(海拔1543 m),其余气象站海拔均低于800 m。在海拔大于2000 m的秦岭核心区,因海拔较高(图1),几乎没有有效的降水观测资料,导致对秦岭高山地区的降水变化并不十分了解。比如利用秦岭及周边地区加密的气象站降水数据,发现夏季降水的空间变化表现为从汉江盆地向陕北递减[4],没有体现出秦岭降水高值区,而实际随海拔的升高,降水在秦岭山地有增大趋势[5-6]。利用薄盘样条插值方法,以经度、纬度和海拔为独立变量,由气象站观测资料建立了秦岭及其周边地区降水格点数据集[7-8],认为秦岭是年降水800 mm的分界线。但由于秦岭高海拔地区缺乏观测资料,造成在高山区,无法评判插值的结果是否反映实际的降水状况。
图1
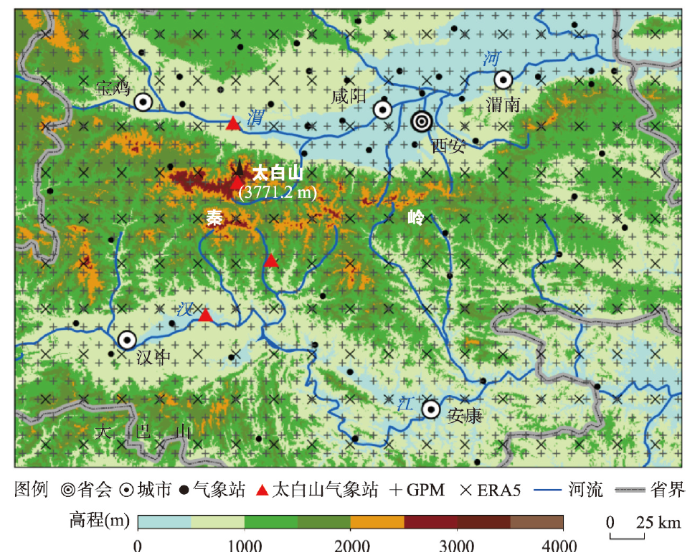
图1
研究区自然概况、气象站以及GPM和ERA5资料格点分布
注:红色三角点从南向北依次为洋县站、佛坪站、拔仙台站和眉县站。
Fig. 1
Profile of the study area, meteorological stations, and GPM and ERA5 data grid distribution
综观对秦岭山地的降水研究,直至目前关于秦岭高海拔地区降水研究十分有限,单靠低海拔的观测数据不能得到降水空间分布特征,对深入认识秦岭山地大气降水及其水资源变化十分不利。鉴于此,本文利用2018—2019年在秦岭太白山海拔3760 m处观测的降水数据,采用3种空间插值方法,结合GPM-cal数据和ERA5再分析资料,探讨秦岭山地降水垂直变化的规律并分析降水形成的水汽条件,以期深入认识秦岭作为南北气候过渡带的特征,以及为研究秦岭水资源变化提供基础数据和理论依据。
2 研究方法与数据来源
2.1 研究区概况
2.2 数据来源
2.2.1 秦岭太白山降水观测数据
本文作者2018年春季在秦岭太白山海拔3760 m拔仙台处(图1)架设了自动气象站,降水观测采用WUSH-WP称重式降水传感器,精度为0.1 mm,时间分辨率为30 min,研究时段是2018年6月1日—2019年5月31日,自动气象站观测的降水数据与同地点雨量桶观测数据进行了对比验证,观测期间数据连续且无异常。
2.2.2 气象站降水数据与DEM资料
秦岭周边62个国家气象站的降水数据,来自中国气象科学数据共享服务网(
2.2.3 GPM卫星降水数据与修正
GPM(Global Precipitation Measurement)是继TRMM(Tropical Rainfall Measuring Mission)之后的新一代全球卫星降水产品,相较TRMM产品,GPM具有覆盖范围广、时空分辨率高、反演算法精进及可探测微量降水等优点,广泛应用于气候变化和水文过程等研究领域[16⇓-18]。本文选用GPM-IMERG月降水滞时产品(Integrated Multi-satellite Retrievals for GPM)(
图2
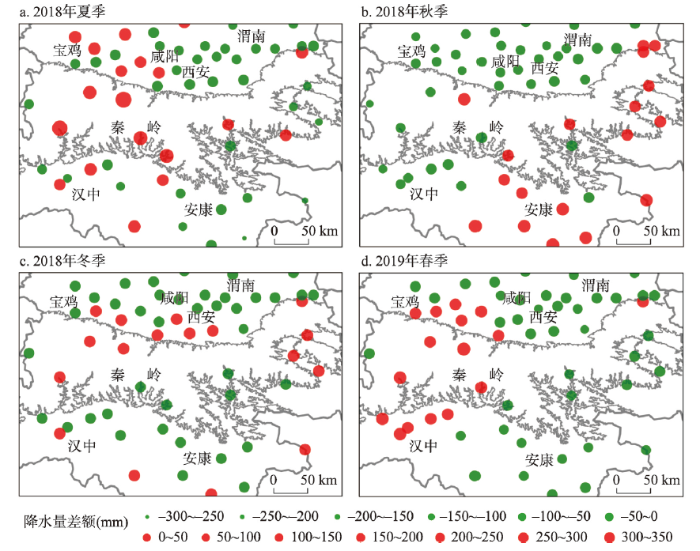
图2
研究区气象站季节降水观测值与GPM估算值差额的空间分布
Fig. 2
Spatial distribution of differences between rain gauges and GPM-derived seasonal precipitation in the study area
2.2.4 ERA5再分析资料
2.3 研究方法
为研究秦岭无观测高山区的降水变化特征,基于秦岭南北气象站点数据、GPM卫星降水数据及ERA5再分析资料,进行研究所需数据集的获取与结果的分析,流程如图3。细节如下:① 选取秦岭太白山107.8°E经线上的洋县、佛坪、拔仙台和眉县气象站降水观测资料,从日、月、季节和年尺度分析其降水变化特征。② 利用秦岭南北62个站点的降水资料,基于克里金、反距离加权及薄盘样条插值法[22-23]获取研究区2018年6月—2019年5月空间分辨率为30 m的降水栅格数据,结合气象站降水观测值与GPM估算值的差额以及克里金球形插值模型修正得到0.1°GPM-cal数据、0.25°ERA5再分析降水数据及拔仙台站观测降水数据,在拔仙台站进行多源降水资料的评估。③ 选择经过秦岭拔仙台的区域,范围为32.3°N~35.0°N、107.5°E~108.0°E,利用观测、空间插值、GPM及ERA5降水数据,探究秦岭山地降水随海拔高度的变化与秦岭降水空间分布的规律。 ④ 使用ERA5再分析资料的风、比湿数据,计算研究区107.75°E剖面上季节水汽通量值,对秦岭降水形成的水汽条件进行分析。
图3
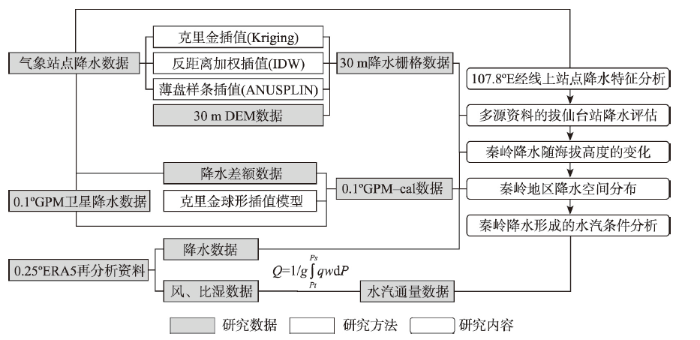
图3
研究区降水数据获取与分析流程
Fig. 3
Precipitation data acquisition and analysis process in the study area
3 结果分析
3.1 2018年6月—2019年5月秦岭太白山降水变化
图4为经过太白山拔仙台,沿107.8°E的秦岭山区地形随纬度的剖面图,同时绘出了沿107.8°E线附近的洋县、佛坪、拔仙台和眉县气象站2018年6月—2019年5月的年降水量及逐月降水量,4个站点年降水量(海拔)分别为:洋县737.9 mm(476 m)、佛坪941.2 mm(827 m)、拔仙台1298.7 mm(3760 m)和眉县633.8 mm(520 m);季节上,拔仙台降水量均高于另外3个站点,其降水量值是汉江、渭河盆地洋县和眉县站的1.5~2倍,可见整体上秦岭年和季节降水量随海拔的升高而增大。
图4
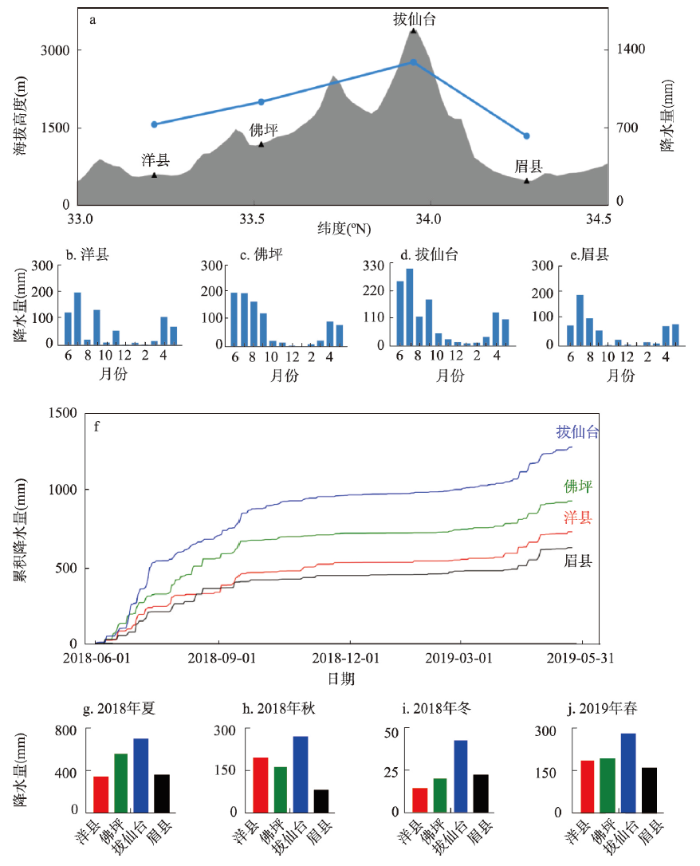
图4
2018年6月1日—2019年5月31日秦岭107.8°E经线附近4个气象站年降水、逐月降水、季节降水和逐日累积降水变化
注:图中阴影部分为秦岭山体。
Fig. 4
Annual, monthly, seasonal, and accumulated daily precipitation of four meteorological stations along 107.8°E in the Qinling Mountains between June 1, 2018 and May 31, 2019
在月降水变化方面,4个站点相似,表现为降水集中于4—9月。同一月份内拔仙台降水量均大于位于盆地的洋县和眉县站,说明海拔高度是导致这种差异的重要因素。图4给出了2018年6月1日—2019年5月31日4个站点逐日累积降水曲线,4个站点年内逐日降水累积曲线相似,都在2018年9月和2019年4月存在两个拐点,表征在秦岭山地降水主要发生于夏季和春季。其中,拔仙台降水最多,且各季节内累积速度最快,说明秦岭高海拔地区降水强度要大于低海拔地区。
3.2 多源降水资料的拔仙台站年和季节降水评估
表1 不同方案拔仙台站年和季节降水量和相对偏差
Tab. 1
| 指标 | 方案 | 全年 | 2018年夏季 | 2018年秋季 | 2018年冬季 | 2019年春季 |
|---|---|---|---|---|---|---|
| 降水量(mm) | 观测 | 1298.7 | 700.6 | 269.8 | 42.7 | 285.6 |
| 薄盘样条插值 | 1468.6 | 923.6 | 202.2 | 89.6 | 250.8 | |
| 克里金插值 | 814.4 | 482.0 | 124.1 | 26.4 | 178.7 | |
| 反距离加权插值 | 678.2 | 387.3 | 106.6 | 25.9 | 158.4 | |
| GPM-cal | 1287.8 | 583.4 | 265.3 | 26.1 | 246.3 | |
| ERA5 | 1578.9 | 983.0 | 247.0 | 76.0 | 272.9 | |
| 相对偏差(%) | 薄盘样条插值 | 13.1 | 31.8 | -25.1 | 109.8 | -12.2 |
| 克里金插值 | -37.3 | -31.2 | -54.0 | -38.1 | -37.4 | |
| 反距离加权插值 | -47.8 | -44.7 | -60.5 | -39.3 | -44.5 | |
| GPM-cal | -0.8 | -16.7 | -1.7 | -38.9 | -13.7 | |
| ERA5 | 21.6 | 40.3 | -8.5 | 78.0 | -4.4 |
注:表中灰色底纹为相对偏差最小的方案。
图5
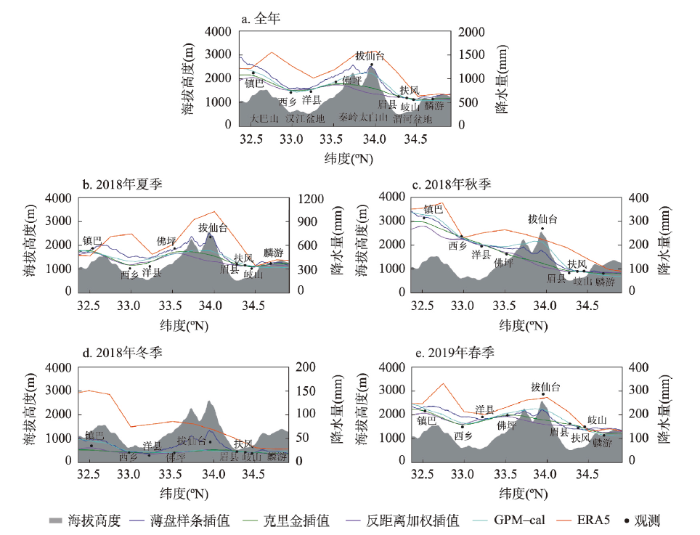
图5
观测、空间插值、GPM-cal和ERA5资料的年和季节降水随海拔高度的变化
Fig. 5
Variations with height of the precipitation, including observations, spatial interpolation, and GPM-cal and ERA5 data
采用降水差额和克里金球形插值模型修正GPM数据得到的拔仙台全年降水量相较其他方案最佳,相对偏差为-0.8%,这是由于考虑了拔仙台站降水观测值;由薄盘样条插值获取的拔仙台全年降水量较GPM-cal次之,相对偏差为13.1%;同时,GPM-cal数据2018年秋季、ERA5再分析资料2019年春季拔仙台的降水量与实测值绝对偏差分别为 -4.5 mm和-12.7 mm,对应的相对偏差为-1.7%和-4.4%,但2018年冬季各方案偏差均较大,相对偏差均在35%以上。就年降水量而言,评估结果依次为GPM-cal>薄盘样条插值>ERA5>克里金插值>反距离加权插值(表1)。
3.3 秦岭降水随海拔高度变化
选取经过秦岭最高峰拔仙台的区域(32.3°N~35.0°N, 107.5°E~108.0°E),分别从观测降水量、空间插值结果、GPM-cal数据和ERA5再分析降水,来探讨秦岭地区全年和季节降水随海拔高度的变化规律(图5)。
基于降水差额和克里金球形插值模型修正的GPM-cal降水数据,克服了“低值高估,高值低估”问题,基本能刻画秦岭年和季节降水随海拔变化的规律;同样,空间分辨率较粗糙的ERA5再分析降水,也能够反映地形起伏对降水形成和分布的影响。综合看,薄盘样条方法获取的秦岭全年和夏季降水插值结果较好,但对秋季、冬季和春季高山区降水的插值结果存在较大偏差。
3.4 秦岭地区降水空间分布特征
为表征秦岭地区降水的空间变化规律,分别从观测资料(62个气象站+拔仙台站)、薄盘样条插值结果、GPM-cal降水数据和ERA5再分析结果比较分析2018年6月—2019年5月秦岭地区的降水空间分布特征(图6)。
图6
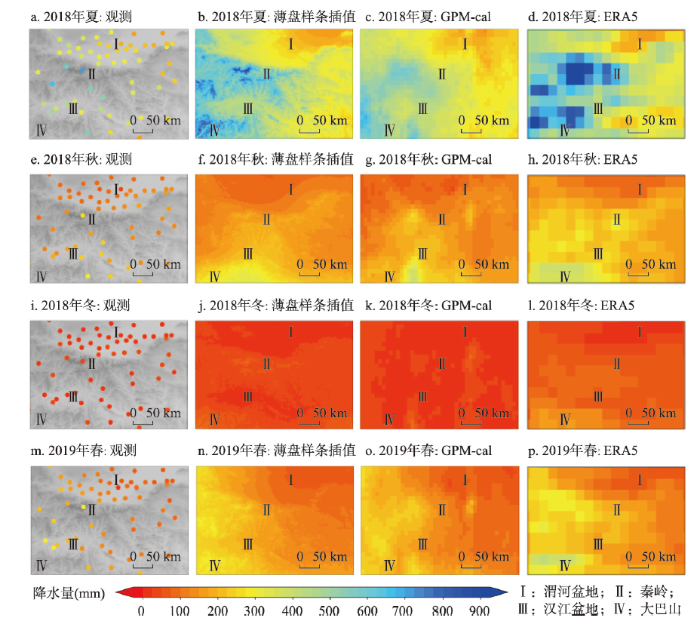
图6
观测、薄盘样条插值、GPM-cal和ERA5季节降水空间分布
Fig. 6
Spatial distribution of precipitation by observation, ANUSPLIN, GPM-cal, and ERA5 data
尽管在秦岭山区观测站点分布稀疏,但也反映出山区降水高、盆地降水低的特征。观测、薄盘样条插值结果、GPM-cal降水数据与ERA5再分析资料的降水空间格局大体一致,都表现为在秦岭和大巴山出现降水高值中心。薄盘样条插值、GPM-cal降水数据和ERA5再分析资料的分辨率分别为30 m、0.1°和0.25°,薄盘样条插值是基于低海拔站点和30 m DEM进行样条函数表面拟合获取的空间降水数据,30 m DEM足以显式解析山脉走向、海拔高度、坡度对降水的影响,能够再现秦岭山地真实的降水空间分布特征。GPM虽然是目前空间分辨率最高的卫星降水产品,但受降水反演算法、卫星传感器观测不确定性和复杂地形的影响,致使其在秦岭的估算结果与观测存在较大偏差;而GPM-cal考虑了秦岭高海拔降水观测资料对区域降水格局的控制作用,是引入研究区降水差额对GPM修正后的结果,解决了“低值高估、高值低估”问题,使其再现的降水空间分布特征较原数据更接近观测。相比之下,ERA5空间分辨率虽较GPM卫星降水粗糙,但ERA5作为ECMWF最新一代数据集,数据生成过程采用目前较高分辨率大气环流模式、较先进的数据同化技术及融合了多套观测资料,使得ERA5再现的秦岭山地降水场空间模态更接近实际,在大巴山、汉江盆地、秦岭和渭河盆地地区,都能够描绘地形剧烈起伏带来的降水场的空间分布差异。
3.5 秦岭降水形成的水汽条件
图7
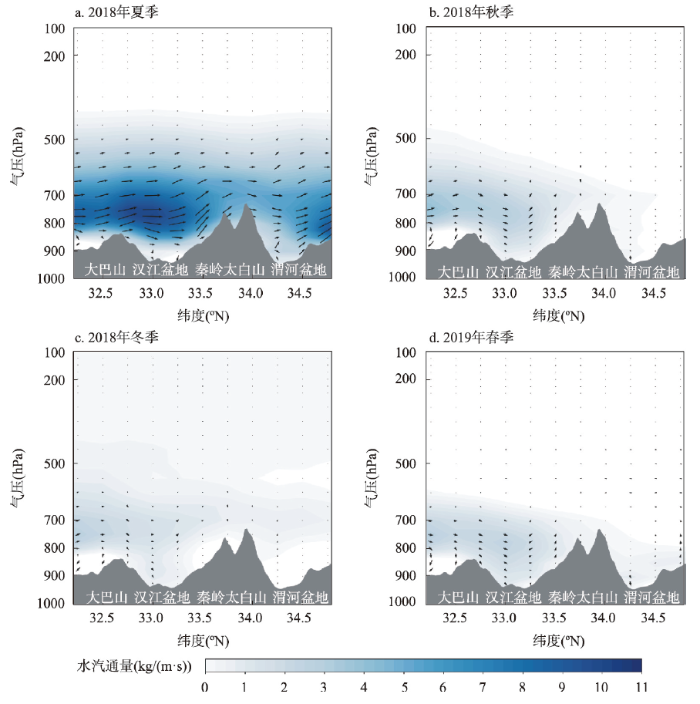
图7
107.75°E经线剖面上低层到高层的季节水汽通量
Fig. 7
Seasonal water vapor fluxes from low level to high level for the 107.75°E meridional profile
图7a~7d显示了在107.75°E剖面上各季节水汽输送状况,发现水汽输送过程主要发生于600 hPa高度以下。2018年夏季水汽通量值在750 hPa附近形成高值中心,最大值可达到11 kg/(m·s),为夏季降水的形成提供了充足的水分条件。2018年秋季、冬季和2019年春季(图7b~d)南来气流的水汽通量较夏季微弱,水汽通量值仅为0~4 kg/(m·s),水汽输送过程主要发生在700 hPa高度附近,这可能是秦岭山地与700 hPa西南低空急流的相互作用[27]。从图7看,秦岭对南来的湿润气流具有明显的阻滞作用,受秦岭地形阻挡,水汽集聚于汉江盆地,在地形强迫下气流爬升产生降水,使秦岭南坡形成降水高值中心。
4 结论与讨论
秦岭作为中国气候变化的关键带,不仅是南北气候的分界线,也是长江最大支流汉江和黄河最大支流渭河的重要水源地。深刻认识秦岭高山区的气候变化,是深入理解秦岭作为南北地理分界线特征,以及认识秦岭水文水资源变化的先决条件。针对在海拔大于2000 m的秦岭高山区缺乏气象观测这一事实,本文利用2018年6月—2019年5月在秦岭太白山海拔3760 m观测的降水资料,发现秦岭高海拔山区年降水量可达1300 mm,约2倍于汉江盆地和渭河盆地的降水量。
为探究秦岭降水随海拔高度的变化,采用克里金、反距离加权、薄盘样条插值方法、GPM-cal降水数据以及ERA5再分析资料,获得了研究区年和季节降水的空间分布。结果表明利用低海拔降水观测数据,由克里金、反距离加权插值不能得到准确的秦岭年和季节高海拔降水值。继TRMM产品之后新一代卫星降水产品—GPM,受传感器、反演算法及观测区域限制,也未能再现秦岭和大巴山降水高值中心;而考虑高海拔站点观测降水、采用降水差额和克里金球形插值模型得到的GPM-cal降水数据,获取的秦岭高海拔年、夏季和秋季降水值更接近观测,且具有再现秦岭降水模态的能力。ERA5再分析资料虽降水量值偏高,但具备再现研究区降水空间分布的能力。采用薄盘样条插值,结合观测资料和高分辨率DEM产品相较其他方案更能准确刻画秦岭山地降水随海拔高度的变化。
ERA5资料的水汽通量分析显示,研究区水汽输送主要发生于600 hPa高度以下,秦岭对水汽向北输送具有明显的阻滞作用。夏季降水占全年55%以上,来自海洋的湿润气流抵达该区域,受秦岭的地形强迫作用,湿润气流发生爬升,进而凝结降水,致使其南坡降水最为丰富。除此之外,春季、秋季和冬季区域气流水汽含量低,但秦岭仍然对水汽具有显著的拦截作用。因此,秦岭凭借着高大地形对水汽的阻挡、强迫和拦截作用使其成为区域降水高值中心。
秦岭作为湿润季风气候与半湿润季风气候的分界线,就目前而言,秦岭本身的气候变化并没有完全研究清楚。比如秦岭山地最大降水带处于什么高度?全球变暖背景下秦岭高海拔地区降水是增加还是减少?秦岭究竟是如何影响南北水汽输送的?这些问题目前都没有明确的答案。虽然在太白山海拔3760 m处进行了气象观测,但是对认识秦岭气候的垂直地带性显然不够。未来需要在秦岭高海拔地区进一步进行降水梯度的观测,注重加强高山地区对全球变化响应快速而强烈的山地特征“线”的连续监测,为全球变化的研究提供重要依据[28]。
参考文献
Subtropics of China
中国的亚热带
Origin of the Qinling Mountains
秦岭的由来
Ten major scientific issues concerning the study of China's north-south transitional zone
DOI:10.18306/dlkxjz.2019.03.001
[本文引用: 1]

Since the Qinling-Huaihe line was delimited as the boundary between north and south China in 1958, discussions on the local position of the line, criteria for dividing temperature zones, the line's environmental effect, among others, are ongoing. The National Basic Resources Investigation Program "Integrated Scientific Investigation of the North-South Transitional Zone" launched in 2017, introduced the concept of north-south transitional zone (Qinling-Daba Mountains) and planned to explore the north-south dividing line from the perspective of transitional zone, so as to strengthen and make some breakthroughs in the study of the north-south division. The Qinling-Daba Mountains are the main body of China's north-south transitional zone, with multi-dimensional zonal structures and high degree of environmental complexity, biological diversity, and climatic sensitivity. The following 10 scientific issues need to be dealt with in the years to come: 1) The relationship between the north-south dividing line and the north-south transitional zone; 2) improvement of criteria for identifying subtropical and warm-temperate zones; 3) integral north-south series and variation of vegetation and soil types; 4) relationship between global warming and spatial change of key bioclimatic criteria; 5) decomposition and integration of multi-dimensional zonal structures in the Qinling-Daba Mountains; 6) pattern and mechanism of biological diversity and endemics; 7) the corridor effect of the Qinling-Daba Mountains; 8) regional environmental effect of the Qinling-Daba Mountains and implications for the national ecological security; 9) significance and position of the Qinling-Daba Mountains for the history and development of China; and 10) significance of the geographic structure of Western Qinling Mountains for the origin of the Chinese civilization. These key issues are not only the results of previous research, but also the starting point for further exploration and study in the future. They are intended to inspire and encourage an in-depth study of China's north-south dividing line or transitional zone, and to provide new perspectives and framework for the exploration of physio-geographic theories, biodiversity, and ecological security, and even the birthplace of the earliest Chinese civilization.
中国南北过渡带研究的十大科学问题
DOI:10.18306/dlkxjz.2019.03.001
[本文引用: 1]
秦岭-淮河一线在60 a前被科学地确定为中国南北分界线。此后中国地学科学家一直在探索分界线的具体位置和划分指标改进问题;随着数据的积累和认识的加深,还发现了一些新的科学问题。2017年启动的国家科技基础资源调查专项“中国南北过渡带综合科学考察”将秦岭-大巴山定义为中国南北过渡带的主体,拟全面系统地调查和研究其自然地理要素与资源问题,从而实现中国南北分界线研究的全面深化和突破。秦岭-大巴山具有多维地带性结构,表现出高度的过渡性、复杂性、多样性和敏感性。目前面临和需要研究的主要科学问题包括:① 南北分界线与南北过渡带的关系?② 暖温带与亚热带划分指标如何改进?③ 植被-土壤在南北方向上的渐变序列及其形成机理?④ 全球变化与地区关键生物气候指标空间变动的关系?⑤ 秦巴山地的多维地带性结构如何分解与综合?⑥ 秦巴山区生物多样性、特有性的格局与机理?⑦ 秦巴山地东西向廊道效应?⑧ 秦巴山地的区域环境效应及对国家生态安全的意义?⑨ 秦巴山地在中国历史发展中的特殊意义?⑩ 西秦岭的地理结构与华夏文明起源的关系?这些问题既是过去研究工作和认识的总结,也是未来一段时间内需要关注和研究的重点。希望这样的归纳和梳理对于中国南北过渡带和南北分界线的科学研究具有一定的启发和促进作用,为中国自然地理学理论发展、生物多样性和生态安全研究,甚至为华夏文明起源的研究提供新的视角和框架。
Dominant modes of summer precipitation in Qinling and surrounding areas
秦岭及周边地区夏季降水的主模态分析
Characteristics of the summer microclimate in Mt. Taibai of Qinling Mountains
DOI:10.11821/xb198201010
[本文引用: 1]
1979年7月30日至8月15日我们曾在秦岭主峰太白山(最高点八仙点海拔3767米)南北两面不同高度的坡地、谷地和山顶设置了九个测点进行为期半个月的小气候观测,测点布置如图1所示。
秦岭太白山夏季的小气候特点
DOI:10.11821/xb198201010
[本文引用: 1]
1979年7月30日至8月15日我们曾在秦岭主峰太白山(最高点八仙点海拔3767米)南北两面不同高度的坡地、谷地和山顶设置了九个测点进行为期半个月的小气候观测,测点布置如图1所示。
Some characteristics of precipitation in the Qinling Mountains
秦岭山地降水的若干特征
A high-resolution grid dataset of air temperature and precipitation for Qinling-Daba Mountains in central China and its implications for regional climate
DOI:10.11821/dlxb201905003
[本文引用: 1]
In this study, we developed a high-resolution grid dataset of air temperature and precipitation for the Qinling-Daba Mountains in central China, which includes monthly precipitation and temperature, seasonal precipitation and temperature, annual precipitation and temperature. Spatial interpolation was performed using thin-plate smoothing spline in the software ANUSPLIN, with latitude, longitude and elevation as independent variables. Our dataset is consistent with the widely-used WorldClim 2.0 dataset, but has more accuracy, because it is based on a larger number of meteorological stations and higher-resolution elevation data. Our results show that the southern foot of Qinling Mountains is the 0 ℃ isothermal line in the coldest month (January). The Qinling-Daba Mountains has obvious vertical temperature zones. The maximum temperature lapse rate occurs in June, which is 0.61 ℃ per 100 m, while the minimum temperature lapse rate is 0.38 ℃ per 100 m, occurring in December. The annual mean temperature lapse rate is 0.51 ℃ per 100 m. Both summer and autumn precipitations decrease from southwest to northeast, with heavy rainfall center located on the southwestern slope of the Daba Mountains, while winter precipitation decreases from southeast to northwest. The Daba Mountains is the 1000 mm isohyetal line of annual precipitation and 500 mm isohyetal line of summer precipitation, while the Qinling Mountains is the 800 mm isohyetal line of annual precipitation and 400 mm isohyetal line of summer precipitation. Comparison with large-scale atmospheric circulation indicates that the spatial distributions of air temperature and precipitation in the Qinling-Daba Mountains are mainly controlled by the East Asian monsoon and topography. In summer, the Daba Mountains prevents the northward penetration of East Asian summer monsoon and therefore influences the spatial distribution of precipitation. In winter, the Qinling Mountains prevents the southward penetration of East Asian winter monsoon and therefore influences the spatial distribution of air temperature. In summary, our high-resolution grid dataset contributes to a better understanding of regional climate and will have many applications in future researches.
秦岭-大巴山高分辨率气温和降水格点数据集的建立及其对区域气候的指示
DOI:10.11821/dlxb201905003
[本文引用: 1]
本文建立了秦岭—大巴山高分辨率(~29 m×29 m)的气候格点数据集,包括逐月气温和降水、年均温和年降水、春夏秋冬气温和降水。空间插值方法采用国际上较为先进的ANUSPLIN软件内置的薄盘光滑样条函数,以经度、纬度和海拔为独立变量。空间插值结果与流行的WorldClim 2.0气候格点数据集具有一致性,但是比后者更精确、分辨率更高、细节更突出。本文揭示和证实:秦岭南麓是最冷月气温的0 ℃分界线。秦岭—大巴山气温具有明显的垂直地带性。6月气温直减率最大,为0.61 ℃/100 m;12月气温直减率最小,为0.38 ℃/100 m;年均气温直减率为0.51 ℃/100 m。夏季和秋季降水从西南向东北递减,强降水中心出现在大巴山西南坡。冬季降水从东南向西北递减。大巴山是年降水1000 mm分界线,夏季降水500 mm分界线;秦岭是年降水800 mm分界线,夏季降水400 mm分界线。与大尺度大气环流对比揭示:秦岭—大巴山气温和降水空间分布主要受到东亚季风和地形因子的控制。本文进一步明确了秦岭和大巴山的气候意义:大巴山主要阻挡夏季风北上,影响降水空间分布;秦岭主要阻挡冬季风南下,影响冬季气温空间分布。本文建立的高分辨率气候格点数据集,加深了对区域气候的认识,并将有多方面的用途。
Spatial-temporal variation of precipitation in Qinling area in recent 50 years based on Anusplin
基于Anusplin秦岭地区近50多年来的降水时空变化
Variability of the event-based extreme precipitation in the south and north Qinling Mountains
DOI:10.11821/dlxb202005008
[本文引用: 1]
Modeling extreme precipitation processes could provide a pathway for a better understanding of the questions concerning how much precipitation is extreme and how that extreme precipitation responds to warming in the climate change sensitive and ecological fragile zone of China over the coming decades. In this perspective, based on daily precipitation and temperature data from 72 meteorological stations released by the National Meteorological Information Center, the spatial-temporal variation of precipitation is investigated in the Qinling Mountains from 1970 to 2017, which is a critical geographical and climatic boundary between northern subtropical and warm temperate zone in China. Then we applied a framework to identify the dominant pattern of EEP in the study region, and time distribution pattern (TDP) of the event-based extreme precipitation (EEP) could be divided into four types, i.e. early, after, balance-phase and single day EEP, here after referred to as TDP1, TDP2, TDP3 and 1-day EEP. More specifically, the relationship between different EEP and local temperature is investigated through the cross wavelet transform and linear correlation. The result showed that from a long-term climate view, precipitation pattern is relatively stable in the Qinling Mountains in the past 48 years, and the 800 mm isohyetal line is still distributed in the south piedmont of Qinling Mountains. Moreover, precipitation analysis showed an obvious synchronous trend in the sub-region, which could be characterized as non-smooth and non-linear, and after 1997, there is an increasing trend in annual precipitation amount, a declining trend in rainy days, and a continuous increase of extreme precipitation intensity. Spatially, according to percentage of total precipitation amount of EEP, a wide distribution of TDP3 is clearly seen over most regions and 1-day EEP does not prevail, which demonstrates that daily precipitation extremes during an EEP could be mainly distributed at both the first and second half parts of the event duration. In north of Qinling Mountains, the dominant pattern combines TDP3 and TDP2. For south piedmont of Qinling Mountains, it witnesses fewer combinations of EEP. There exists difference between the east and west in Hanjiang River Valley, that is, TDP3 and TDP2 in the west is greater than in the east where the dominance of TDP1 and TDP3 is more prominent. However, based on the percentage of total frequency of EEP, TDP1 is observed in southern and northern Qinling Mountains, and the dominant pattern combines TDP1 and TDP2 in Hanjiang River Valley. Furthermore, in the past 48 years, the influence of local climate change, for the decadal variation of extreme precipitation, was more obvious on the time scale of 8-12 years than of on the time scale of 4-8 years. It is worth mentioning that changes in nearly all indices had a strong correlation to temperature in Hanjiang River Valley, especially TDP2 and 1-day EEP. This is particularly true of high temperature related to more precipitation intensity of single day, which in turn raises the expectation of more intense extreme short-duration rainfall events that could be assessed by the wavelet coherence analysis. Between 1998 and 2012, the phenomenon, 'global warming hiatus', occurred in the Qinling Mountains, which led to the decrease of 1-day EEP, and the increases of TDP1 and TDP3 in the north of Qinling Mountains, as well as the increase of TDP2 over the south piedmont of Qinling Mountains. All the above results are closely linked to lower temperature. The response of TDP3 and TDP2 is stronger than other types in Hanjiang River Valley. It should be noted that these results are helpful to understand the relationship between climate warming and extreme precipitation, but the response of different EEP to anthropogenic forcing and atmospheric oscillation is still complex and not explicitly resolved.
面向事件过程的秦岭南北极端降水时空变化特征
DOI:10.11821/dlxb202005008
[本文引用: 1]
基于72个气象站点1970—2017年逐日降水和气温数据,面向极端降水过程,对秦岭南北4种极端降水类型(偏前型、偏后型、均衡型和单日型)时空变化特征进行分析,进而探讨不同分区、不同类型极端降水与区域增温的响应关系。结果表明:① 从长期气候角度分析,秦岭南北降水格局稳定,3个分区降水变化空间响应具有一致性,共同表现出“降水以波动为主,降水量近期增加,降水日数下降,整体呈现极端化”的特征;② 在极端降水主导类型上,以累计降水量为判断标准,秦岭以北为均衡型主导,兼有偏后型;秦岭南坡类型组合关系较弱,为单一均衡型,汉江谷地西侧为“均衡型+偏后型”,东侧为“均衡型+偏前型”组合;以累积降水频次为判断标准,秦岭南北主导类型为偏前型,其次是偏后型,汉江谷地“偏前型+偏后型”组合形态更突出;③ 秦岭南北极端降水与区域变暖关系密切。当气温升高时,持续性极端降水呈下降趋势,单日型极端降水呈增加趋势。其中,秦岭以北偏前型和均衡型极端降水在下降,秦岭南坡响应密切的为偏后型,汉江谷地为均衡型和偏后型;④ 面向极端降水事件过程,将极端降水事件细化,可有效验证极端降水对气候变暖响应的结论,对未来研究方法完善和研究思路设计具有启示性。
Analysis of annual and seasonal precipitation variation in the Qinba Mountain area, China
Causation analysis of a short-time strong rainfall triggered by cold front at the northern piedmont
秦岭北麓一次冷锋触发的短时强降水成因分析
DOI:10.7522/j.issn.1000-0534.2017.00070
[本文引用: 1]
2015年8月3日秦岭北麓突发短时强降水,强度之大近年少有,并引发山洪造成人员伤亡。应用高空观测资料、地面加密资料、NCEP再分析资料,并结合风廓线雷达和多普勒天气雷达资料分析发现,此次降水过程具备较好的对流潜势及湿度条件,由冷锋系统触发,冷锋系统结构特点包括:锋区前近地面水汽含量>18 g·kg<sup>-1</sup>,锋面上升运动处于下沉运动之上、自由对流高度以下,850 hPa以下强冷平流造成该层浅薄逆温,锋前出现显著对流不稳定,均为对流性强降水发生创造有利条件。强冷平流带来水平锋生,对流不稳定产生垂直锋生,总体强锋生主要出现在对流层中下层,达到20×10<sup>-10</sup> K·s<sup>-1</sup>·m<sup>-1</sup>。秦岭的阻挡作用使得冷锋过境转为偏西风,并与强降水正反馈形成超低空强西风带。偏西风与迎面山体配合对降水产生增幅作用,并为降水区带来水汽输送,但超低空西风较强容易破坏雷暴单体的垂直结构,又使得降水不能长时间维持。风廓线雷达能够探测到冷锋系统的精细化垂直风场结构,反映了冷锋的垂直结构信息,并较其他气象要素更能提前预判系统发展,具有较强的预报指示意义。
Conceptual models of short-time heavy rainfall in the east of Northwest China
DOI:10.7522/j.issn.1000-0534.2015.00102
[本文引用: 1]
To study the temporal, spatial and climatic characteristics of short-time heavy rainfall in the east of Northwest China, by using the NCEP/NCAR 1° ×1° reanalysis data during 2001-2011 to classify the weather circulation situation which influences the east of Northwest China, focusing on the time and circulation state when the short-time heavy rainfall happens, together with the energy theory, four synoptic scale concept models is established including low vortex type, low trough type, cut the variant and southwest airflow type. The results show that the regional short-time heavy rainfall events in the east of Northwest China weather type have obvious seasonal characteristics and regional features. Temporally, in late spring and early summer as well as autumn, the short-time heavy rainfall is featured by low trough type while in middle summer, southwest airflow type and two high variant take the dominant role. Spatially, the Gobi desert is mainly home to short-time heavy rainfall of low trough type, the northeast Qinghai Tibet plateau slope zone is given priority to with southwest airflow type of short-time heavy rainfall, the loss plateau and the south of Qinling area is the most of southwest airflow type and low trough type.
西北地区东部短时强降水概念模型
DOI:10.7522/j.issn.1000-0534.2015.00102
[本文引用: 1]
利用2001-2011年NCEP/NCAR 1°×1°再分析资料对影响西北地区东部的天气环流形势进行分型,分析了各类天气型下短时强降水的时空特征和气候特征,以短时强降水发生的时间和环流状态为着眼点,结合能量天气学理论分类建立了西北地区东部短时强降水的低涡型、低槽型、两高切变型和西南气流型等4类天气学中尺度概念模型。结果表明:西北地区东部区域性短时强降水事件的天气型有明显的季节性特点和区域性特征。时间上,春末夏初和秋季主要为低槽型短时强降水,而盛夏主要为西南气流型和两高切变型;空间上,戈壁荒漠区以低槽型短时强降水为主,青藏高原东北边坡区以西南气流型为主,而黄土高原区和秦岭以南区以西南气流型和低槽型为主。
Performance of the WRF model in simulating intense precipitation events over the Hanjiang River Basin, China: A multi-physics ensemble approach
Spatio-temporal differentiation of climate warming (1959-2016) in the middle Qinling Mountains of China
Spatial distribution patterns of Pinus tabulaeformis forest and Pinus massoniana forest in Qinling-Daba Mountains and the boundary of subtropical and warm temperate zones
DOI:10.11821/dlxb202011002
[本文引用: 1]
Qinling Mountains is not only the geographical boundary between North and South China, but also the boundary between subtropical and warm temperate zones. It plays an important role in the geo-ecological pattern of China. However, there is controversy about the specific location of this geographical boundary in academic community due to the complexity, transition and heterogeneity of the transitional zone, as well as the differences in the delimitation indicators and research purposes. To further reveal the characteristics of the North-South transitional zone and clarify the specific location of the geo-ecological boundary between North and South China, combined with SRTM topographic data, temperature and precipitation data, Pinus massoniana forest and Pinus tabulaeformis forest, which represent subtropical coniferous forests in South China and temperate coniferous forest in North China respectively, were chosen to analyze their spatial distributions in the Qinling-Daba Mountains and the climatic conditions at their boundary with the climatic indexes of annual precipitation, the coldest month (January) average temperature, the warmest month (July) average temperature and the annual average temperatures. The results show that: (1) Pinus massoniana and Pinus tabulaeformis forests and the climate indicators of their boundary can be used as one of the vegetation-climate indicators for the delimitation of subtropical and warm temperate zones. The boundary between the subtropical coniferous forest (Pinus massoniana forest) and temperate coniferous forest (Pinus tabulaeformis forest) in Qinling-Daba Mountains is located along the south slope of Funiu Mountain to the north edge of Hanzhong Basin (the south slope of Qinling Mountains) at an altitude of 1000-1200 m, where the climatic indictors are stable: the annual precipitation is about 750-1000 mm; the annual average temperature is about 12-14 ℃; the coldest monthly average temperature is 0-4 ℃; and the warmest monthly average temperature is about 22-26 ℃. (2) It could be more scientifically to delimitate the boundary of subtropical and warm temperate zones in China by comprehensively considering the vegetation-climate indicators. Additionally, the boundary between subtropical and warm temperate zones in Qinling-Daba Mountains should be a transitional zone consisting of the boundaries of coniferous forests, broad-leaved forests and shrubs between subtropical and warm temperate zones. The results provide a scientific basis for the selection of delimitation indicators of subtropical and warm temperate zones.
秦巴山区马尾松林和油松林的空间分布及亚热带与暖温带界线划分
DOI:10.11821/dlxb202011002
[本文引用: 1]
秦岭不仅是中国南北的地理分界线,也是中国亚热带和暖温带的气候分界线,在中国地理生态格局中占有重要的地位和作用。由于过渡带的复杂性、过渡性和异质性以及划分指标、研究目的的不同,学术界关于这一南北地理—生态分界线的具体位置一直有争论。为了进一步揭示秦巴山区过渡带的特征,明确中国南北地理—生态分界线的位置,本文选择马尾松(Pinus massoniana)林和油松(Pinus tabulaeformis)林这两类分别代表中国南方亚热带针叶林和北方温带针叶林的植被,结合研究区SRTM地形数据、气温和降水数据等,以年降水、最冷月(1月)气温、最热月(7月)气温和年均温为气候指标,详细分析了这两类植被在秦巴山区的空间分布及二者分界线处的气候条件。结果表明:① 马尾松林和油松林的分界线及相应位置的气候指标可以作为亚热带与暖温带界线划分的植被—气候指标之一。秦巴山区亚热带针叶林(马尾松林)与温带针叶林(油松林)的分界线位于伏牛山南坡至汉中盆地北缘一线(秦岭南坡)海拔1000~1200 m处;分界线处气候指标稳定:年降水750~1000 mm,年均温12~14 ℃,最冷月气温0~4 ℃,最热月气温22~26 ℃。② 通过综合的植被—气候指标来划分秦巴山区亚热带和暖温带的界线,能更科学地确定气候带分界线的位置及过渡带的特征,更全面地反映地表植被—气候格局的变化。此外,秦巴山区亚热带与暖温带的界线应该是由亚热带与暖温带针叶林分界线、阔叶林分界线、灌丛分界线等组成的一个过渡带。本文的研究结果为亚热带与暖温带划分指标的选取提供了一定的科学依据。
Evaluation of the GPM IMERG V06 products for light rain over mainland of China
Two-decades of GPM IMERG early and final run products intercomparison: Similarity and difference in climatology, rates, and extremes
Impact of sampling of GPM orbital data on streamflow simulations
TRMM-data-based spatial and seasonal patterns of precipitation in the Qinghai-Tibet plateau
DOI:10.13249/j.cnki.sgs.2013.08.999
[本文引用: 2]
As the highest plateau on the Earth, the Tibetan Plateau influences the climate of its adjacent regions and even the whole Asia or the whole world. However, knowledge on its precipitation pattern is very limited due to the sparsely distributed rain gauges, especially in its western part. Besides, the plateau is geomorphologically complicated, making it even harder to carry out conventional meteorological observations. Satellite data for precipitation estimation has the advantage of full spatial coverage and can be used to solve the problem of climatic data shortage. In this article, the 0.25-degree resolution Tropical Rainfall Measuring Mission (TRMM) 3B43 product from 1998 to 2011 was analyzed to depict spatial and seasonal precipitation patterns over the plateau. But, TRMM 3B43 data often overestimate the amount of rainfall in the arid areas and underestimate rainfall in the extremely humid regions. Kriging interpolation method was chosen to improve the accuracy of TRMM data based on the difference between observational and TRMM-derived data. The results confirmed the generally recognized spatial patterns of precipitation decreasing from southeast to northwest and from south to north, the existence of rain shadow in the northern flank of the Himalaya Mountains and the cold-arid core of the Eurasia. Some new spatial patterns of precipitation were also revealed, such as the dry region in the Ali-Karakoram Mountains, a relatively humid region in the heartland of the plateau and a comparatively arid region in the central part of the Hengduan Mountains. Seasonal patterns of precipitation in the Tibetan Plateau vary greatly from southeast to northwest. The ratios of precipitation in Spring (from March to May), Autumn (from September to November) and Winter (from December to February) to annual precipitation are all 20~30% in the northwest of the plateau, while the ratio for Summer (from June to August) is 30%~40%, a little more than that in other seasons. In the southeast, precipitation occurs mainly in summer (40%~60%), some in spring and autumn (20%~30% each), and less in winter (lower than 10%).
基于TRMM数据的青藏高原降水的空间和季节分布特征
DOI:10.13249/j.cnki.sgs.2013.08.999
[本文引用: 2]
庞大的青藏高原不仅影响其周围的气候,也影响整个亚洲甚或全球的气候,而且本身还形成了独特的高原气候。但高原上气象观测站点极为稀少,降水资料奇缺,难以完整、深刻地认识高原降水的时空分布格局。选用热带降雨测量计划卫星(Tropical Rainfall Measuring Mission,TRMM)3B43月尺度降水率数据,并根据114个气象站点数据与TRMM数据的差额和克里格球形插值模型对原数据进行了修正,克服了原数据低值高估、高值低估的问题,并以此分析了青藏高原1998~2011年的多年平均降水的空间格局与季节分布特征。研究结果证实了青藏高原降水的空间格局呈现自东南向西北递减、自南向北逐渐减少的基本分布规律,包括喜马拉雅山北坡雨影区、高原西北部“寒旱核心”的存在;还发现了一些新的规律,包括阿里喀喇昆仑山少雨区、高原腹地相对湿润区、横断山脉中心相对干旱区等。高原降水的季节分配不均匀,其中,西、北部春(3~5月)、秋(9~11月)和冬(12~2月)的降水占全年降水比例均为20%~30%,夏季(6~8月)降水稍多,比例为30%~40%;东南部降水主要集中在夏季,比例高达40%~60%,春、秋降水比例为20%~30%,冬季降水比例低于10%。
Numerical simulation of meteorological elements of a pollution episode in Sichuan Basin based on two reanalysis datasets
基于两种再分析资料的一次四川盆地大气污染过程气象要素数值模拟研究
ANUSPLIN Version 4.2 User Guide
Interpolating mean rainfall using thin plate smoothing splines
Spatial interpolation methods of annual average precipitation on Qinling Mountains
秦岭主脊区年降水量空间插值最优方法研究
Effects of different combinations of WRF parameterization schemes on 2 m temperature, precipitation simulation in Qinba Mountain area
基于WRF模式的不同参数化方案组合对秦巴山区2 m温度、降水模拟研究
Analysis of the spatial distribution of precipitation and topography with GPM data in the Tibetan Plateau
The moisture sources and transport processes for a sudden rainstorm associated with double low-level jets in the northeast Sichuan Basin of China
