

1 引言
地表温度(Land Surface Temperature, LST)直接影响地球陆地表层系统能量平衡,是地球物理循环过程的关键参数,也是环境、生态、气候、水文、农业等研究领域的重要指标[1⇓⇓-4]。现阶段LST的相关研究多集中于城市热岛效应[5⇓⇓-8]、地方旱情监测[9-10]、冻土冻融特征分析[11]和区域生态环境质量评价等方面,而对全球、国家等大尺度上的时空格局分异和变化驱动机制等方面尚显不足,特别是对大尺度区域的地带相似性和区域差异性研究不够全面深入。中国气候复杂地形地貌多样,在不同特质的自然地理环境与不同强度的人类活动的综合影响下,LST表现出显著的区域特征和时空差异[12⇓-14],从而影响区域生态环境的形成演变以及生产方式的转化变革。因此,全面分析中国LST时空分布格局可为区域资源保护与开发、农业生产布局、气象灾害防治等提供科学依据,探究中国生态地理分区LST空间异质性及演变特征将为气候变化监测与应对、地表环境模式解析等提供基础理论支撑。
气象站点实测是精确获取LST数据的可靠手段,但由于站点数量有限且分布不均,难以实现对复杂地形或人迹罕至区域LST的精细刻画。随着遥感技术的发展与应用,基于多种卫星数据(Landsat、MODIS、AVHRR、ASTER等)的遥感定量反演为大尺度、时空连续的LST快速获取提供了新途径,其中MODIS地表温度产品良好的时空分辨率可满足大、中尺度的研究要求[15⇓⇓-18],已在青藏高原、黑河流域、东北冻土区、天山等区域的气温反演研究中取得较好的效果[19⇓⇓⇓⇓-24],说明该数据产品在复杂地形下对地表能量的刻画仍具备科学性与可靠性。以往研究多将LST作为研究对象分析其自身变化特征或作为重要指标用以探寻其它地理现象或过程的内在机理,但由于数据来源/种类、时间序列、处理方法和过程等不尽相同,导致不同研究中各区域LST时空异质性的对比存在一定的不确定性或甚至难以类比的情况。因此,使用相同处理标准、相同尺度以及适宜精度的数据是进行全国尺度LST研究的前提与关键,运用统一的时空序列数据和变化驱动因子,可客观探究和比较全国尺度下LST的时空异质性及其格局成因。
中国由于气候类型多样、地形地貌复杂、生态环境百态、人类活动强度各异等地理特征导致各生态地理分区中影响LST变化的因子组合也存在差异,因子间的交互组合使LST演变呈多样化和复杂性[25⇓-27]。因此,在综合考虑地理空间与生态环境诸多因子的基础上,寻求合适的地统计分析方法来识别与诠释不同分区内主导LST变化的因子及类型就显得尤为重要。地理探测器能够充分表征地理事物的空间异质性,亦可客观反映出各地理综合体中各要素影响的优先级[28],已在驱动力定量分析、生态地理空间划分、健康风险评估等领域均取得了丰硕成果[29⇓⇓⇓⇓⇓-35]。地理探测器所遵循的“自变量若对因变量存在重要影响,则两者在空间分布上具备一定相似性”核心假设[28]为LST异质性主导因素的识别和成因分析提供了客观有力的理论基础。本文基于MODIS地表温度数据,定量刻画中国2001—2020年LST的时空分异规律,借助地理探测器识别不同生态地理分区下LST变化的主导因子及过程机制,可为应对气候变化、协调人地关系和区域可持续发展等提供科学参考。
2 数据及方法
2.1 数据来源及预处理
本文选取2001年1月—2021年2月覆盖中国的17幅MOD11C3数据产品,用以LST时空分异特征研究;并选取降水、日照时数、人口、NDVI、DEM、土地利用等数据用于LST异质性归因分析(表1)。
表1 数据说明
Tab. 1
| 数据 | 时段/分辨率 | 空间分辨率 | 数据来源 | 说 明 |
|---|---|---|---|---|
| 中国生态 地理分区[36] | - | - | 中国科学院资源环境科学数据中心 ( | 基于温度和干湿划分48个分区。为便于分析,本文在原分区基础上依据地貌特征和空间邻接关系,将其归并至38个分区(SHAPE格式, |
| LST (K) | 2001-01—2021-02 逐月 | 5500 m | LAADS DAAC ( | MOD11C3(HDF格式),经MRT软件镶嵌及重投影。 |
| 日照时数 (h) | 2001—2020 逐日 | 1000 m | 中国气象数据网 ( | 中国833个气象站点逐日日照时数数据,剔除无效、异常值后,借助ArcGIS软件合成年数据并进行spline空间插值获得栅格数据(TIFF格式)。 |
| 降水 (mm) | 2001—2020 逐年 | 1000 m | 中国科学院资源环境科学数据中心 ( | 中国1980年以来逐年年平均气温空间插值数据集,基于全国2400多个气象站点日观测数据,通过整理、计算和使用ANUSPLIN插值软件处理生成(GRID格式)。 |
| 人口密度[37] (人/km²) | 2015 | 1000 m | 中国人口空间分布公里网格数据集,基于行政单位人口统计值结合土地利用类型、夜间灯光亮度、居民点密度等数据的加权计算(GRID格式)。该数据既可表征中国人口的空间分布特征,也能定量刻画人类活动强度。 | |
| 土地利用[38] | 2020 | 1000 m | 中国多时期土地利用土地覆被遥感监测数据集(CNLUCC),基于2020年Landsat 8影像解译生成(GRID格式),一级分类体系为:耕地、林地、草地、水域、城乡/工矿/居民用地、未利用地、海洋。 | |
| DEM (m) | - | 250 m | 中国海拔高度(DEM)空间分布数据,基于SRTM V4.1数据重采样生成(GRID格式)。借助ArcGIS软件提取坡度、坡向和地形起伏度数据。 | |
| NDVI[39] | 2001—2018逐年 | 1000 m | 中国年度植被指数(NDVI)空间分布数据集,基于SPOT/VEGETATION以及MODIS等数据经MVC法合成(TIFF格式)。 |
注:除土地利用数据外,其余数据均重采样至5.5 km×5.5 km分辨率。
(1)MOD11C3单位换算
式中:LST为地表温度值(℃);DN为像元灰度值(K)。
(2)月、季节、年平均LST数据合成
MOD11C3包含日间和夜间地温数据,使用算术平均法计算LST日均、月均、季均和年均数值。其中,以3—5月为春季,6—8月为夏季,9—11月为秋季,12—次年2月为冬季。
2.2 研究方法
2.2.1 LST时空变化分析
(1)LST倾向率
回归分析可确定两种或两种以上变量间相互依赖的定量关系,使用一元线性回归方法计算倾向率以分析LST随时间的变化幅度。
式中:slope为一元线性回归方程的斜率;Ti为时间变量;n为研究时段,本文取值为20;LSTi为第i年的中国地表温度值;slope < 0和slope > 0分别表示LST在研究时段内随时间递减与递增,绝对值越大则表示LST上升/下降的速率越快。
(2)显著性检验与分析
显著性检验用于描述抽样误差造成方程拟合差异的可能性大小,可用于验证与描述式(2)中LST与时间的拟合效果,使用F检验对式(2)所得斜率进行显著性检验,F越大则说明拟合效果越佳,LST变化趋势越明确。
式中:U为回归平方和;Q为剩余平方和;yi是第i年地表温度值;
(3)相关性分析
使用相关性系数表征LST与海拔、NDVI等因子之间相关性的强弱关系。
式中:相关性系数rxy的范围是[-1,1],rxy>0时,代表两者关系呈正相关;rxy<0时,代表两者关系呈负相关,rxy的绝对值越大代表其相关性就越强。
(4)质心模型
使用升/降温区的质心位置及其偏移量以分析其季节性移动距离、速度和方向。
式中:n等于要素总数;xi和yi是要素
2.2.2 地理探测器
地理探测器是检验单因子空间分异性和多因子耦合性的有效手段。本文使用地理探测器的因子探测模块定量检测因子是否影响了LST变化的空间异质性并测定该因子的影响程度。公式如下:
式中:h = 1, 2, …, L为变量Y或因子X的分层,即分类或分区;Nh和N分别为h层和全区的单元数;σh2和σ2分别是层h和全区Y值的方差。SSW和SST分别为层内方差之和和全区总方差。
影响LST变化的因素多样且过程机制复杂,但大致可归为自然、人为两方面[40⇓-42]。自然因素主要包括气候、地形、植被等,其中日照时数与降水等气候因子可直接影响地表接收太阳辐射的总量;海拔、坡度、坡向、地形起伏度等地形因子影响地表在不同高度、方向所能接收的太阳辐射量[43];NDVI是表征地表植被覆盖度的重要因子,植被既可直接阻隔到达地表的太阳辐射,又可通过其自身蒸散发作用对周边环境进行增湿降温[44⇓-46]。人为因素由人类活动强度和土地利用方式共同表征,前者使用中国科学院的人口统计数据结合夜间灯光亮度、居民点密度等数据加权计算所得的人口密度数据表征[37],主要以人类的聚集程度来表征对自然环境的改造强度;后者主要包括人类改变地表土地利用类型引起下垫面物理/化学性状的改变,从而增强/削弱地表吸收/反射太阳辐射,进而导致升/降温效应,二者均可客观描述人为因素对地表热量分布的扰动程度[47-48]。
通过地理探测器的因子探测对各地理分区上述因子的q值进行计算和排序,q值越高,则该因子对于LST变化的解释力更强[28],在剔除不具备统计学意义的因子后,取因子中解释力最强的两个因子作为主导类型的划分标准,第一因子为主导因子,第二因子为辅助因子,若以上两个因子处于同一主导类型中,则选择排名第三的因子为辅助因子,以此类推。最后根据贡献率识别各区的LST变化驱动因子并进行归因分析。
3 结果分析
3.1 中国LST时空格局及变化特征
3.1.1 中国LST时空格局
2001—2020年中国LST气候平均值为9.6 ℃,空间差异性显著,整体呈东南及西北干旱区高、东北及青藏高原低,平原高、山区低的基本格局(图1、表2)。除D3外,中国的LST高值区均处于东南部,且均温普遍高于15 ℃;其中,LST最高值区为J2,气候平均值高达24 ℃。中部偏北主要为LST中值区(气候平均值5~15 ℃),LST低值区主要分布在西南部及东北、西北端,仅BE1、G1和AC1的气候平均值低于0 ℃,其中BE1温度最低,为-3 ℃。LST受太阳辐射纬向递变控制而总体呈现由南向北逐渐降低的宏观基调,由J2、A5、C4、J1等东南沿海的高值区,自南向北递减至东北北部(如A1、B7等)和新疆北部(如BD1等)低值区。LST分布同时受垂向递变规律制约,青藏高原大部及天山、大兴安岭等高大山体均呈显著低温,特别是青藏高原气候平均值显著低于同纬度的中、东部地区;D3、F1等分区因植被稀疏、地表裸露也属同纬度相对高值区。可见太阳辐射决定了LST的宏观格局,而海拔和下垫面性状将直接影响局部地表热力性质和热量分布,从而强化LST空间异质性。
图1
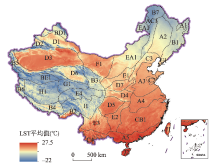
图1
2001—2020年中国平均LST空间分布
注:基于自然资源部标准地图服务网站GS(2020)4630号标准地图制作,底图边界无修改。
Fig. 1
Spatial distribution of LST average value in China, 2001-2020
表2 中国生态地理分区
Tab. 2
| 编号 | 名称 | 编号 | 名称 | 编号 | 名称 | 编号 | 名称 | 编号 | 名称 |
|---|---|---|---|---|---|---|---|---|---|
| A1 | 三江平原 | D5 | 四川盆地 | B1 | 东北东部山地 | AC1 | 三河山麓平原丘陵 | A4 | 淮南与长江中下游平原 |
| A2 | 东北平原 | E2 | 贵州高原 | B3 | 青东祁连山地 | C1 | 辽东胶东山地丘陵 | A5 | 闽粤桂山地丘陵平原 |
| A3 | 华北平原 | J1 | 台湾诸岛 | C2 | 鲁中山地丘陵 | B2 | 东喜马拉雅南翼 | BD1 | 阿尔泰山与塔城盆地 |
| B4 | 藏南山地 | J2 | 琼雷诸岛 | C3 | 华北山地丘陵 | BE1 | 昆仑山高山高原 | CB1 | 江南丘陵与岭南山地 |
| B6 | 阿里山地 | E3 | 云南高原 | C4 | 滇南谷底丘陵 | E1 | 晋中陕北甘高原 | D3 | 塔里木与吐鲁番盆地 |
| B7 | 大兴安岭 | B5 | 昆仑山北翼 | D7 | 晋南关中盆地 | E4 | 果洛那曲丘状高原 | I1 | 川西藏东高山深谷 |
| D2 | 伊犁盆地 | D1 | 准噶尔盆地 | H1 | 羌塘高原湖盆 | EA1 | 内蒙古高平原 | ||
| D4 | 汉中盆地 | D6 | 柴达木盆地 | G1 | 青南高原宽谷 | F1 | 阿拉善及河西走廊 |
为进一步探讨沿纬向的三级阶梯LST与DEM的空间关联性,沿邻近“秦岭—淮河”一线的34°N纬线分别对LST与DEM作剖面线(图2)。显而易见,LST与海拔呈显著负相关,相关系数达-0.66,即海拔由第三阶梯到第一阶梯逐步上升,LST则呈显著下降趋势。二者在第一阶梯的负相关性最为显著,其次为第二阶梯,第三阶梯呈现较弱负相关。以百米为海拔梯度,使用分区统计计算各阶梯LST递减率(表3),中国LST依海拔梯度带的平均递减率为0.41 ℃/100 m,其中第二阶梯地形以高原、大盆地为主,与第一、第三阶梯邻接区域分布着一系列高山,地形起伏度较大,LST随海拔递减的幅度最大,高至0.57 ℃/100 m;其次是第一阶梯,青藏高原平均海拔约4000 m以上,尽管外缘的川藏高山峡谷区和祁连山地等地表起伏剧烈、海拔落差大,但高原面内部藏北高原、藏南谷地和柴达木盆地等广大区域地形起伏度较低,故LST倾向率小于第二阶梯,为0.44 ℃/100 m;第三阶梯地形较为平坦开阔,LST变化受海拔影响有限,主要由人类活动、植被等下垫面因素共同影响,LST垂直递减率仅为0.15 ℃/100 m。中国LST总体空间格局依地形地貌表现出显著的区域差异性,在山盆结构区、高海拔区差异性尤为突出;海拔因素削弱了中国LST依太阳辐射量纬向递减的趋势,使其出现同纬低温或同纬高温的空间分异格局。
图2
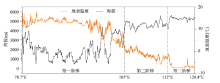
表3 LST与DEM相关性
Tab. 3
| 区域 | 相关系数 | 海拔梯度递减率(℃/100 m) |
|---|---|---|
| 中国 | -0.66 | 0.41 |
| 第一阶梯 | -0.76 | 0.44 |
| 第二阶梯 | -0.29 | 0.57 |
| 第三阶梯 | -0.17 | 0.15 |
3.1.2 中国LST年际变化
中国20年LST倾向率为0.21 ℃/10 a,升温区占国土面积的78%,整体呈现出“多核式升温,轴线式降温”的空间特征(图3a)。升温区以长三角、华北平原、四川盆地、藏东南及内蒙古大部为核心,其中AC1(0.54 ℃/10 a)升温最为显著(图3c)。降温区集中于“昆仑山—柴达木南缘”“环东北平原—大兴安岭—太行山—秦岭”及“环四川盆地—云贵高原东缘”3条轴线上,整体呈“Y”型交汇于汉中盆地西部,此外阿里—藏南山地降温亦较为显著;降温区多为山脉高原沿线地带,降温幅度最高地区为B6分区(-0.13 ℃/10 a)。贵州高原的LST变化率仅为-0.002 ℃/10 a,为LST稳定区,故下文不做讨论。
图3
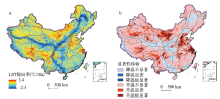
图3
2001—2020年中国LST空间变化及统计结果
注:基于自然资源部标准地图服务网站GS(2020)4630号标准地图制作,底图边界无修改。
Fig. 3
Spatial variation and statistical results of LST in China in 2001-2020
就升温区分布特征来看,A4、A3和A5区升/降温特征类似(图3a),分别以长三角、京津冀和珠三角等城市集群为升温核心,且显著性检验达到显著/极显著(F ≥ F0.01)(图3b),其中A4升温效应最强,为0.3 ℃/10 a。中国北部与西南中部的高平原也存在两条升温带,主要分布于内蒙古与东北地区的F1、EA1及青藏高原中、南部的I1、E4、B4、H1等地区。中国降温带主要出现在山区,但新疆天山区出现了多个升温斑块(图3a),且显著性极强(F ≥ F0.01)(图3b),特别是D2西部,其原因可能是气候变暖背景下,山区积雪存积时间变短,山地冰川加速消融,岩石裸露增加易吸收更多太阳辐射形成小范围升温[24]。较为特殊的是,D5四川盆地作为典型升温核心镶嵌于中国“Y”形降温带的中南部,LST倾向率为0.24 ℃/10 a,其升温核心区以“下玄月”状坐落于盆地西南部,该分布特征与其山盆地形特征有较大关联。
中国沿山脉走向特征分布的“Y”型降温带将主要升温区分为3部分:北部盆地—高平原带状升温区、西南高原—山谷嵌入式升温区和东部平原—盆地多核心聚集式升温区。中国LST整体上呈现升温状态,升温强度高且面积广,有多核心扩散为带状区域升温的趋势,降温强度低且分布呈破碎和边缘化趋势。
3.1.3 中国LST季节分异
图4
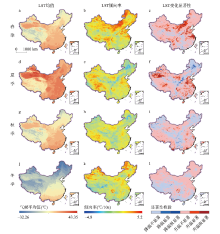
图4
2001—2020年中国LST季节时空分布及变化
注:基于自然资源部标准地图服务网站GS(2020)4630号标准地图制作,底图边界无修改。
Fig. 4
Spatial distribution and variation of LST in different seasonsin China in 2001-2020
表4 中国LST季节均温及变化率
Tab. 4
| 季节 | 春季 | 夏季 | 秋季 | 冬季 |
|---|---|---|---|---|
| LST均温(℃) | 11.080 | 21.020 | 10.050 | -4.390 |
| 均温标准差 | 8.030 | 8.640 | 7.730 | 10.380 |
| LST变化倾向率(℃/10 a) | 0.450 | 0.164 | 0.080 | 0.157 |
| 倾向率标准差 | 0.045 | 0.048 | 0.038 | 0.050 |
| 升温区气候平均值(℃/10 a) | 0.610 | 0.440 | 0.330 | 0.450 |
| 降温区气候平均值(℃/10 a) | -0.230 | -0.360 | -0.280 | -0.310 |
| 升温区面积占比(%) | 80.210 | 65.770 | 60.070 | 61.220 |
| 降温区面积占比(%) | 18.790 | 34.230 | 39.930 | 38.780 |
中国各季节LST仍以升温为主,各季升温区面积占总国土面积之比均大于60%(图4)。升温效应最强的季节为春季(4.5 ℃/10 a),其次是夏季,秋季最弱,仅为0.08 ℃/10 a(表4)。春季升温区面积占比80%,北方的升温幅度及面积占比均高于南方,主要包括大兴安岭—太行山—阴山—祁连山—天山以北,同时华北平原、山东半岛、江淮平原以及西南山盆等亦呈较高的显著性等级(F0.05<F<F0.01)。夏季升温区面积显著减少至65%,东部升温区较春季变化不大,祁连山—横断山以西的盆地与高原的升温强度有所增加且显著性等级较高,四川盆地的升温强度较春季有所降低,但显著性仍处于较高等级(图4);东北平原降温明显可能与东北冷涡关系密切,其形成的连续阴雨天气在夏季发生频率增加、活动天数增多且强度增大[49],对LST降温效应显著。秋季升温区进一步减少至60.07%,以四川盆地及新疆(尤其是北疆)地区降温最为明显。冬季升温区面积有小幅增加,如新疆、东北地区及四川盆地,而青藏高原降温显著,尤其是藏南及果洛那曲地区。总体上看,中国大部分地区LST变化随季节发生小幅度波动,青藏高原、新疆及东北地区LST的季节性升/降温,一定程度可反映其气候敏感性和指示性。
质心运动轨迹可直观反映中国LST升/降温区的季节性转移规律。2001—2020年中国升/降温区质心运动均呈环状轨迹移动,且方向呈现出对应的季节性反向(图5),升温区质心在春—夏季沿西南方向移动,降温区质心则向东北移动。升温区主要以季节性北移为主,且以秋—冬季质心偏移量最大,表明北方地区升温幅度大于南方,因此暖冬在高纬度地区相对更为显著;而降温区以季节性南移为主,以春—夏季质心偏移量最大,由此可知东北部夏季减温幅度大于南方。升/降温质心在夏—秋季偏移均呈最小值,春、冬季质心位置也均较为接近。综合升/降温区的质心偏移量,降温区质心移动幅度更大,说明中国降温区的区域差异性和季节变异性较大,与其空间分布的分散性和破碎性有关,而升温区域差异性和季节变异性均较小,进一步印证了中国LST增温的普遍趋势。
图5
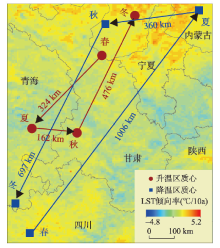
图5
2001—2020年四季升/降温区质心运动轨迹
Fig. 5
Trajectory of centroid in warming/cooling zones in different seasons in China in 2001-2020
3.2 中国LST变化主导因子识别
基于地理探测器,按照因子q值排序可确定LST变化主导因子、类型及其交互作用。探测发现中国LST变化主导因子可归为自然(气候、地形、植被)主导型和人为主导型(图6),同时受因子组合、叠加等不同方式和强度影响下,各地理分区LST的增强/减弱又呈现一定的差异性和规律性。
图6
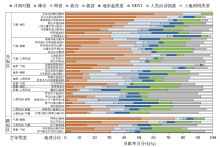
图6
LST变化率因子探测结果及主导类型划分
Fig. 6
The factor detection results of LST change rate and the division of dominant types
LST格局和演变是诸多因子共同作用的结果。中国升温区中气候主导型的分区数量多达16个,人类活动、植被覆盖和地形主导型的区域分别为7个、3个、6个(图6)。就各气候主导型的因子组合影响整体来看,日照时数对LST变化的贡献率略高于降水量,如B2分区日照时数对LST变化的贡献率占绝对优势(59.95%),但个别分区亦存在二者贡献率接近或降水影响略显著的现象,如BD1、D2分区日照时数贡献率分别为22.76%、12.74%,降水贡献率分别为25.18%、18.28%,二者对LST影响相当;B5分区降水因子贡献率达39.37%,高于日照时数影响。同时,气候因子多与地形因子结合共同影响区域升温,其中海拔因子的贡献较其他地形因子更突出,如E4和I1分区的海拔贡献率高达23.32%和21.06%;另外,气候要素中的降水因子与植被覆盖度关系密切,如F1、A1和B5分区的植被因子贡献率均高于18%,降水与植被二者组合亦对LST升高具有双重影响;在气候—人类活动组合类型中,除A3分区以降水的贡献率(36.42%)远高于日照时数(6.9%)外,其它区域均以日照时数控制气候因子与人类活动强度组合共同影响区域升温。海拔在地形主导型的升温区中是主要的控制因子,如H1、G1等分区;而C1分区的地形起伏度与海拔贡献率相当。植被主导型的升温区除B4分区(人类活动强度因子贡献率24.1%)外,其他地区多受地形因子中的海拔、气候因子中的日照时数组合显著影响。人类活动主导型区域往往同时受海拔因子的显著影响,如D7、C2、C3分区其海拔因子贡献率分别达33.0%、19.66%、17.22%;人类活动强度对LST变化的影响具有区域差异性,东部地区以人类活动为主导因子的升温区显著多于中部、西部地区且各主导因子的组合形式也存在差异。
中国降温区主要受气候和植被因子影响,其中日照时数和降水均有较大贡献率,而受地形因子影响较小,如B6和A2分区气候因子总贡献率分别高达74.01%和55.86%,而E1分区的植被与降水因子的贡献率较为接近,分别为34.15%和27.51%。仅有D4为人为主导型,人类活动强度贡献率为24.24%,同时降水因子亦有较大贡献率(20.93%)。
总体来看,中国各升/降温区LST变化的因子主导类型和组合方式多样,但对地理分区LST的影响强度仍存在一定的规律性。气候—地形、气候—植被组合类型为主导的区域最多、面积最大。气候主导型区域日照时数贡献度最大,且多处于高原、山盆地区。地形主导型区域海拔的贡献度最高。在人为因素主导型区域中,由于人类活动及其导致的土地利用类型改变直接影响了人口聚集区地表物质和能量的转换,因此人类活动与地形组合而导致的升温类型更为常见。上述主导因子相互耦合、紧密互馈,在周期性、规律性、地带性和局地性等因素共同驱动下,形成了不同地理分区LST及其变化的时空分异格局。
3.3 中国LST变化空间异质性归因分析
地形地貌对中国气候、水文、植被和人口分布有着深刻的影响,生态地理分区下的LST升/降类型也大致依地貌分界线呈较显著的集聚/分异特征(图7)。因此本文以“三级阶梯”为基本框架开展LST与前述主导因子间的空间相关性分析,以探究中国LST的空间差异性及变化原因。第一阶梯地形以高原、山地为主,是全球气候变化敏感区和预警区[49],此处LST变化原因多以气候—地形为主导;第二阶梯以“山—盆”综合体、高平原为主,是中国重要的气候、生态过渡带[50],该区域多以气候—植被为主导;第三阶梯以平原、丘陵为主,是中国主要的人口密集区域,分布多个大型城市群,多以人类活动—地形/气候为主导。整体看来,自然与人为两大主导类型有着“泾渭分明”的空间分布特征(图7),二者分界线与人口空间格局分界线—“胡焕庸线”高度吻合,后者既是气候、植被、地形地貌等自然地理格局的重要分界线,同时也划分了人口、交通、能源、城镇化率、国民经济总量等社会经济因子的大格局[51⇓-53],为此下文就以该经典且重要的地理分界线为界具体分析其两侧LST变化的原因。
图7
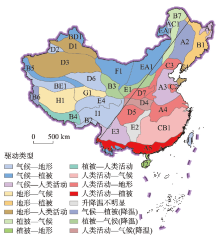
图7
基于生态地理分区的LST变化驱动力类型分布
注:基于自然资源部标准地图服务网站GS(2019)1819号标准地图制作,底图边界无修改。
Fig. 7
Driving force types of LST variation based on eco-geographic zones in China
“胡焕庸线”以东的地理分区(以下简称“以东区域”)多以人类活动强度主导因子与地形因子共同作用于区内LST变化(图7)。由于自然条件和人文历史等原因造成了长久以来中国区域发展的非均衡格局,以东区域地势相对平坦开阔且气候适宜,人口密度远高于西部地区,对地表的改造更加悠久且彻底,在长期抵御、适应及运用自然之力的基础上形成了稳固宜居、规模不一的城市集群或城市经济圈,造就了独有的人类生态系统,其人类活动强度较周围地区呈现显著高值,改变了自然环境下热量的“源—汇”格局[54]。下垫面是气候形成的重要因素,对地表热量、动量、水汽交换及地气交互过程均有重要影响[4⇓-6],如人工不透水表面因其高吸热率、低比热容及由于城市建筑的辐射截获效应而具备的高蓄热特征[2-3],人类生产与生活不断释放的热量、由于温室气体排放而加强的大气保温与逆温效应[1],显著受人为影响的植被分布及演替等[7-8],均直接或间接并持续性地影响着城市及周边区域热量收支平衡和空间分布,易形成特殊的局地气候模式,如热岛效应,雨岛效应等。正如IPCC第六次评估报告指出:全球气候变暖背景下,气候变化的某些方面在城市及其周边可能会被放大[55-56]。以东区域在人为因素主导下的LST升温是明确且显著的(图7),且一般以城市群、经济圈为核心向四周辐射且升温效应随距离增加迅速衰减,因而影响广度相对有限;而地形(主要为海拔)则通过其对人口分布及活动强度的基础性限制作用而间接影响LST。该区域内的降温区则多与全球变暖背景下季风区降水事件增多变强有关。
“胡焕庸线”以西的地理分区(以下简称“以西区域”)主要包括青藏高寒区和非季风区,气候受海洋影响较小且以陆上内循环为主,植被稀疏,人口数量较少,人类活动强度相对较弱,地表以自然下垫面为主,故LST变化多以自然因素为主导(图7)。其中气候要素是地表升温的重要原因,而地形、植被覆盖、人类活动等因子的组合效应增强/削弱了LST变化幅度。气候因子中日照时数直接表征了地表接收太阳辐射的时长,从而显著影响地表升温过程,其对LST的影响大于降水。以西区域的日照时数变率为11.67 h/a,除B6分区LST因日照时数显著减小而呈降温趋势外,其余大部均有所增加。高海拔区域由于地形复杂与生态脆弱等原因,更易引起下垫面能量转化与物质转运[55-56],如大范围的冻土融化、季节性积雪减少以及冰川持续消融引发的吸热过程使得LST处于阶段性降温状态;但随着冰雪消融后地表的反照率降低、吸收太阳辐射能力提高,使其极易向持续性升温状态转变[57]。植被是标志区域生态敏感性与脆弱性的重要指标,在LST变化过程中也有不可替代的影响。普遍而言,植被通过反射和吸收部分太阳辐射使到达地面的太阳辐射层层减少,故植被变化与LST变化呈显著负相关[41],特别是西部干旱/半干旱区人类农林业增长、生态修复等活动对区域LST降低有一定贡献,如D1、D3两大盆地的内陆河流域沿线出现了人造降温斑块,但由于荒漠戈壁广阔,植被稀疏,人类作用范围有限,整体上仍旧表现LST升温状态,而升温类型为地形—人类活动主导型,这与周围山区、平原有较大差别。由此可见中国20年的LST变化虽仍以自然因素主导,但人为因素的驱动效应也不可忽视。
综上所述,现阶段中国全域地理空间中影响LST变化的主导因素以“胡焕庸线”为界呈现显著地域差异,与不同因子组合共同形成了中国LST变化格局。地形因素作为较为稳定的本底因素直接地通过海拔递减、阴阳坡、峰谷地形等相对固定的限制因素影响LST,同时高大山体的气候效应也使得LST变化更加复杂;而日照时数和植被等重要的自然因子主要通过对太阳辐射的增消作用影响LST,其作用范围广、持续性强且相对稳定,存在一定波动性但可通过能量盈亏弥补。人为因素在东部区域以城市为核心向四周辐射且衰减迅速,其作用范围较小,且存在以小时、周、月、季节、采暖期和非采暖期等时间尺度的周期性变化和随机性变化。中国2001—2020年LST变化表明,人为因素可增强/减缓某些自然过程的影响;如IPCC第六次报告指出:人类活动对气候系统多圈层影响显著,其影响程度极有可能决定未来区域气候变化的方向[55-56]。整体而言,自然因素与人为因素相互影响,使得气候变化具有复杂性和不确定性,仍需要进一步的长期监测和深入探讨。
全球变暖是全球性的气候问题,但变暖幅度存在时空差异,温室气体亦存在不同尺度的迁移转化过程。本文的LST变化归因分析虽以全球变暖为基本气候背景展开,但并未对其做定量和分区域的考量,因此对于人口稀疏地区的人类活动对LST的影响可能存在一定程度的低估。
4 结论
本文基于MODIS地表温度数据,分析了2001—2020年中国地表温度及其变化的时空分异格局,并采用地理探测器,结合中国生态地理分区和“胡焕庸线”,探测中国不同区域地表温度变化的主导因子及其成因。结论如下:
(1)中国2001—2020年LST平均值为9.6 ℃,整体呈东南及西北干旱区高、东北及青藏高原低,平原高、山区低的基本格局。LST与海拔呈显著负相关,相关系数达 -0.66,二者在第一阶梯负相关性最为显著,LST递减率达0.57 ℃/100 m,而第三阶梯则呈现较弱正相关。太阳辐射决定了地表温度的宏观格局,而海拔和下垫面性状则强化和细化了LST空间异质性。
(2)中国2001—2020年LST倾向率为0.21 ℃/10 a,升温区占国土面积的78%,整体呈现出“多核式升温,轴线式降温”的空间特征。升温区以长三角、华北平原、四川盆地、藏东南及内蒙古大部为核心向外辐射。降温区则集中于“昆仑山—柴达木南缘”“环东北平原—大兴安岭—太行山—秦岭”及“环四川盆地—云贵高原东缘”3条轴线呈“Y”型交汇于汉中盆地西部,分布呈破碎和边缘化趋势。
(3)中国LST及变化具有显著的区域差异性和季节变异性。冬、夏两季均温空间分布差异较大且波动明显。升降/温区域的质心移动轨迹呈环状,且运动方向呈现出对应的季节性反向,降温区质心移动幅度更大,说明降温区的区域差异性和季节变异性较大,与其空间分布的分散性和破碎性有关。
(4)中国LST变化的因子主导型和组合方式多样,气候—地形、气候—植被等自然因素组合是LST变化主导类型,其中日照时数和海拔是关键因子。自然与人为两大类型的主导区域在空间分布上与“胡焕庸线”吻合,其以东区域多以人类活动强度为主导并与地形因子共同作用,而以西区域则以自然因素为主导,与气候、地形及植被等因子相耦合从而增强/削弱LST变化幅度。
参考文献
Spatio-temporal pattern and evolution of the urban thermal landscape in metropolitan Beijing between 2003 and 2017
2003-2017年北京市地表热力景观时空分异特征及演变规律
DOI:10.11821/dlxb201903006
[本文引用: 3]

利用2003-2017年MODIS地表温度数据,分别从数量、形状和结构角度揭示北京市不同季相和昼夜间地表热力景观时空分异特征,并进一步通过热力等级变化图谱及质心迁移轨迹揭示城市热力景观空间演变规律,探究热力景观等级转换生态过程。结论如下:① 城市地表热力景观季节和昼夜空间特征差异显著;② 中温区在城市热环境中占主导地位。白天中温区是最不稳定的热力景观等级;夜间次低温区和次高温区不稳定性增加;③ 地表热力景观等级变化以稳定型占主,反复变化型和前期变化型次之。地表热力景观等级通常呈现逐级递增或递减规律,山区呈现逐级降温趋势,北部城郊—山地交错地带表现出次低温和中温的反复转向,南部地区有一定的升温趋势;④ 2003-2017年高温区面积增大且质心向城市中心集中,低温区质心向城市外围扩散。生态涵养发展区对北京市地表热力景观质心迁移贡献率最高。热力景观时空分异特征及演变规律可为有效缓解城市热岛效应提供管理决策支持。
Spatial relationship of urban development to land surface temperature in three cities of southern Fujian
DOI:10.11821/dlxb202103006
[本文引用: 3]
Exploring the influence mechanism of expansion for urban areas on thermal environment is significant for improving urban ecological environment. In this study, nighttime light (NTL) can be regarded as an evidence of urban development. Based on Landsat remote sensing data, DMSP/OLS nighttime light data and NPP/VIIRS nighttime light data of Xiamen, Zhangzhou and Quanzhou in southern Fujian during 1996-2017, this study applied the overall coupling model and coordination model to discuss the spatio-temporal coupling and coordination relationship between urban development and land surface temperature (LST) distribution. Additionally, the spatial response law was analyzed by standard deviation ellipse, bivariate spatial autocorrelation and landscape index. The results show that during 1996-2017, the spatial distribution patterns of LST and NTL show that urban development is closely related with factors such as geographical location and terrain. In the western inland areas with high elevations, forests are obviously concentrated with relatively low LST, while in the eastern plain areas, more urban areas are distributed with relatively high LST. In the three cities, the overall coupling situation of NTL and LST is constantly strengthening, and the proportion of coordination for NTL and LST is gradually increasing. In the early stage of urban development, the influence of NTL on LST is hysteretic. In the late stage, the influence of NTL on LST is in advance. There is a positive correlation between NTL and LST, and a spatial spillover effect is obvious. The correlation coefficient and bivariate spatial autocorrelation Moran's I value gradually increase, indicating that NTL has an increasing influence on the change of LST. The HH (High-High)-type and LL (Low-Low)-type agglomeration areas continue to expand. Influenced by the trend of integrated development of the three study cities, HH-type agglomeration area is gradually concentrated in regions connecting the cities, such as Xiamen, Jinjiang, Shishi and central urban area of Zhangzhou. The influence of urban development on LST is related to the development condition of itself. Compared with Zhangzhou and Quanzhou, NTL has a more significant influence on the LST in Xiamen. The study results provide a scientific guidance for the optimization of thermal environment in the three cities of southern Fujian.
闽南三市城镇发展与地表温度的空间关系
DOI:10.11821/dlxb202103006
[本文引用: 3]
基于厦门、漳州、泉州三市1996—2017年的Landsat遥感数据与夜间灯光数据,应用总体耦合态势模型及协调性模型探讨了城镇发展与地表温度的时空耦合规律,并运用标准差椭圆、双变量空间自相关及景观指数分析两者之间的空间响应规律,结果表明:1996—2017年,闽南三市表征城镇发展变化的夜间灯光与地表温度的空间分布呈现出与地形、区位等因素的空间耦合性。三市夜间灯光与地表温度的总体耦合态势不断加强,协调类型逐渐增多;城镇发展早期,夜间灯光对地表温度的影响存在滞后性,在城镇发展后期,夜间灯光则对地表温度的影响呈超前性;夜间灯光与地表温度呈正相关关系,空间溢出效应明显。夜间灯光对地表温度的正向影响逐渐加强,其与地表温度的HH、LL聚集不断扩张;HH集聚连片趋势明显。厦门的城镇发展对地表温度的影响更显著,而在泉州、漳州则较弱。本文可为闽南三市热环境优化提供科学指导。
Dynamic monitoring of the footprint and capacity for urban heat island in Beijing between 2001 and 2012 based on MODIS
基于MODIS的2001年-2012年北京热岛足迹及容量动态监测
Beyond intensity of urban heat island effect: A continental scale analysis on land surface temperature in major Chinese cities
Characteristics of land surface temperature clusters: Case study of the central urban area of Guangzhou
Progress in urban heat island monitoring by remote sensing
DOI:10.18306/dlkxjz.2016.09.002
[本文引用: 2]
Rapid and high intensity urbanization is currently occurring in the world, resulting in increasingly more serious urban heat island phenomenon. Urban heat islands have direct and indirect impacts on various eco-environment factors of cities, regions, and the world, which are closely related to the human well-being. Remote sensing method has been widely used for Surface Urban Heat Island (SUHI) monitoring for its obvious advantages, such as wide range, huge amount of information, short observation cycle, among others. Considering the issue that existing studies have not systematically summarized the thermal infrared data sources, monitoring indicators, and the spatiotemporal variation patterns of monitoring results, and the related information needs to be updated, this study conducted a review of progress of surface urban heat island monitoring by remote sensing. First, we presented and classified the thermal infrared remote sensing data sources for the SUHI monitoring by remote sensing in previous studies. Second, we divided the monitoring indicators into three types, including land cover types-driven kind, Land Surface Temperature (LST) pattern-driven kind, and complex kind driven by both land cover types and LST pattern. We introduced the main indicator calculation methods and application cases in detail and analyzed their advantages and disadvantages. We then reviewed the intraannual spatiotemporal change regulation of the SUHI from three aspects, including diurnal variation, nocturnal variation, and comparative variations between day and night. We also considered the patterns of interannual changes. Finally, we proposed several key issues and potential research directions based on the research areas in which conflicting conclusions are found or research needs to be deepened in the existing studies.
基于遥感监测的城市热岛研究进展
DOI:10.18306/dlkxjz.2016.09.002
[本文引用: 2]
全球正经历快速、高强度的城市化,导致城市热岛加剧,并对城市、区域乃至全球许多的生态环境要素直接或间接地产生多方面的影响,与人类福祉密切相关。遥感具有宽覆盖、信息量大、重复观测周期短等优点,已成为地表城市热岛(Surface Urban Heat Island, SUHI)监测广泛采用的一种方法。针对前人相关研究对热红外数据源、监测指标及SUHI时空变化规律尚缺乏系统总结且内容需要更新等问题,本文首先分类评述了SUHI遥感监测所采用的热红外遥感数据源。其次将现有的SUHI监测指标分为土地覆盖类型驱动型、地表温度格局驱动型及两者复合驱动型3类来述评,详细介绍了它们的计算方法、应用案例及优缺点;并从日间变化、夜间变化及昼夜对比的变化3个方面述评了SUHI的年内时空变化规律;归纳了其年际变化规律。最后,依据现有研究结论中相互冲突或尚需深化的地方,指出几个潜在的关键问题或研究方向。
Spatiotemporal diversity and regionalization of the urban thermal environment in Beijing
北京市热环境时空分异与区划
Agricultural drought monitoring in north Jiangsu by using temperature vegetation dryness index
基于温度植被干旱指数的江苏淮北地区农业旱情监测
The comparison of FY-3A/VIRR and TERRA/MODIS data for drought monitoring
基于FY-3A/VIRR和TERRA/MODIS数据藏北干旱监测对比
Spatiotemporal variations of soil freeze-thaw state in Northeast China based on the ERA5-LAND dataset
DOI:10.11821/dlxb202111012
[本文引用: 1]
The soil freeze-thaw cycle plays an important role in land surface processes. Repeated freeze-thaw cycles can have profound effects on land-atmosphere energy exchange, surface runoff, plant growth, ecosystems and soil carbon & nitrogen cycles. Using spatial analysis functions of geographical information system and python programming language, this paper analyzed the spatial distributions and temporal variations of soil freeze-thaw state in Northeast China based on the ERA5-LAND hourly soil temperature dataset for the period 1981-2019. The results suggest that the start dates of the four soil freeze-thaw periods for the near-surface layer are mainly determined by latitude and topography. The start dates of freeze-thaw transition period in spring (SFTTP) and complete thawing period (CTP) show a southeast-northwest gradient with later starts in the northwest part, while the start dates of freeze-thaw transition period in autumn (AFTTP) and complete freezing period (CFP) exhibit a latitudinal pattern with earlier starts in the north. For most parts of the study area, the average annual number of days for SFTTP is less than 30, with higher values in the south and west compared to the north and east. The number of days for AFTTP, however, is below 10 per year for most parts of the region, with just a slight difference in the study area. The CTP is the longest compared to the other three periods, varying from 150 days in the northwest to 240 days in the southeast. The CFP, which comes next, ranges from 90 to 180 days per year, presenting a dustpan-shaped spatial pattern with higher values in the north and lower values in the south. Trend analysis shows that with the advance of start date for SFTTP and the delay of start date for AFTTP, the number of days for CTP has increased with a rate of 0.2 d/a. The number of days for SFTTP in the Liaohe Plain, the western part of the Da Hinggan Mountains and the northern part of Hulun Buir Plateau shows a decreasing trend, while in other regions an increasing trend is observed. In the western part of the Da Hinggan Mountains and the northern part of the Hulun Buir Plateau, the CTP starts earlier. The start date of AFTTP is significantly delayed in the Songnen Plain and Changbai Mountains, and the trend for the number of days varies substantially with an increase in the north and a decrease in the south. The start date for CFP occurs later in the vast area of the Northeast China Plain and occurs earlier in the Da Hinggan Mountains, Xiao Hinggan Mountains, Changbai Mountains, Eastern Liaoning Peninsula and Western Liaoning Hills. The number of days for CFP shows a declining trend throughout the study area, especially in the seasonally frozen area located in the central part with an annual decreasing rate of more than 0.2 d/a.
基于ERA5-LAND的中国东北地区近地表土壤冻融状态时空变化特征
DOI:10.11821/dlxb202111012
[本文引用: 1]
土壤冻融交替是陆地表层极其重要的物理过程,土壤冻融状态的频繁变化对地气能量交换、地表径流、植被生长、生态系统及土壤碳氮循环等均具有重要的影响。本文基于1981—2019年ERA5-LAND逐小时土壤温度数据,借助GIS空间分析功能,利用Python编程处理分析了中国东北地区近地表土壤冻融状态的时空变化特征。结果表明:从不同冻融状态起始日期的空间分布来看,近地表不同阶段的起始日期主要受纬度和地形的影响,具有明显的纬度地带性和垂直地带性。春季冻融过渡期和完全融化期的起始日期由东南向西北均呈逐渐推迟趋势,而秋季冻融过渡期与完全冻结期起始日期则由东南向西北随纬度升高越来越早。就不同冻融状态发生天数的空间分布而言,研究区南部春季冻融过渡期发生天数多于北部,西部多于东部,年均发生天数均在30 d以内;秋季发生冻融的天数空间差异不大,研究区一半以上的地区年均发生天数在10 d以内。完全融化期发生天数最多,从东南向西北呈逐渐减少趋势,年均发生天数主要介于150~240 d之间;完全冻结期发生天数则由南向北日益增多,其空间分布表现为一向南开口的簸箕形,各地年均发生天数集中于90~180 d之间。从时间变化趋势来看,近年来春季冻融过渡期起始日期以提前趋势为主,而秋季冻融过渡期起始日期总体表现为延后,致使完全融化期发生天数以增加趋势为主,年均变化速度高达0.2 d/a;大兴安岭以西、呼伦贝尔高原以北地区及辽河平原春季冻融过渡期发生天数呈减少趋势,其他地区为增加趋势;大兴安岭以西地区、呼伦贝尔高原以北地区完全融化期起始日期明显提前;松嫩平原和长白山区秋季冻融过渡期起始日期推迟显著,发生天数的变化趋势呈北增南减的空间分异特征;不同地区完全冻结期起始日期的变化趋势差异显著,中部广大的平原区呈不显著的推迟趋势,而大、小兴安岭、长白山、辽东半岛和辽西丘陵则提前进入完全冻结状态;研究区完全冻结期发生天数呈减少趋势,研究区中部的季节冻土区完全冻结期明显变短,年均减少速度大于0.2 d/a。
Near-surface air temperature lapse rates and seasonal and type differences in China
DOI:10.18306/dlkxjz.2016.12.010
[本文引用: 1]
The lapse rate of near-surface air temperature is a critical parameter for obtaining high-precision air temperature products, especially in mountainous areas. The average lapse rate for the troposphere is 0.65℃/100 m, which cannot depict the seasonal and type differences in near-surface air temperature. This study used data from 839 Chinese national-level meteorological stations in 2000-2013 to calculate the lapse rates of seasonal mean air temperature (lrmeanT), seasonal mean minimum air temperature (lrminT), and seasonal mean maximum air temperature (lrmaxT) based on a multiple regression method at the national and regional scales, respectively. A spatial interpolation algorithm was used to validate the reliability of these lapse rates, and the seasonal and type differences were analyzed. The following results were obtained: (1) At the national scale, all the lapse rates are smaller than 0.65℃/100 m. The seasonal differences of lrminT, lrmeanT, and lrmaxT are 0.05, 0.13, and 0.24℃/100 m, respectively. Generally, the lapse rates of the summer are greater than those of the winter. The differences among the three types of lapse rates of air temperature are 0.12, 0.05, 0.11, and 0.26℃/100 m, respectively, in spring, summer, fall and winter. Generally, lrminT is the largest, while lrmaxT is the smallest. (2) At the regional scale by the comprehensive physical geographical regionalization, the lapse rates are also mostly smaller than 0.65℃/100 m. There are spatial differences for each type of lapse rate—the spatial ranges of annual lrminT, lrmeanT, and lrmaxT are 0.27-1.66℃/100 m, 0.22-1.03℃/100 m, and-0.10-0.83℃/100 m, respectively. The seasonal differences of lapse rates are mostly greater than or equal to 0.10℃/100 m, and the lapse rates of the summer are mostly greater than those of the winter. The differences among the three types of lapse rates in half of the regions are greater than 0.10℃/100 m. lrmaxT is larger than lrminT and lrmeanT for half of the regions in spring, summer, and fall, while lrminT is usually the largest in winter. Because of the seasonal differences, spatial differences, and differences among the three types of temperature lapse rates, temperature lapse rate should be determined for each season, region, and temperature type.
中国近地表气温直减率及其季节和类型差异
DOI:10.18306/dlkxjz.2016.12.010
[本文引用: 1]
近地表气温直减率是推测近地表气温空间分布的重要参数。中国幅员辽阔,气候和地形地貌条件复杂,直接使用反映对流层平均状况的单一气温直减率(0.65℃/100 m)很难表征中国近地表气温直减率的季节和类型差异。本文利用中国839个国家气象站点2000-2013年的近地表气温数据,分别在国家尺度和综合自然区划尺度上使用多元回归分析方法计算各个季节的平均气温直减率(lr<sub>meanT</sub>)、平均最低气温直减率(lr<sub>minT</sub>)和平均最高气温直减率(lr<sub>maxT</sub>),并借助空间插值算法对气温直减率的可靠性进行了验证,最后分析了其季节和类型的差异。结果表明:①在国家尺度上,3种气温直减率均小于0.65℃/100 m;lr<sub>minT</sub>、lr<sub>meanT</sub>和lr<sub>maxT</sub>的季节差异分别为0.05、0.13和0.24℃/100 m,且一般有夏季最大、冬季最小的季节规律;春、夏、秋、冬季气温直减率的类型差异分别为0.12、0.05、0.11和0.26℃/100m,且有lr<sub>minT</sub>>lr<sub>meanT</sub>>lr<sub>maxT</sub>的规律。②在综合自然区划尺度上,气温直减率大多低于0.65℃/100 m,且存在明显的地域差异;夏季气温直减率一般大于冬季气温直减率,季节差异大多超过0.10℃/100 m;气温直减率类型差异半数区域超过或等于0.10℃/100 m,在春、夏、秋季,半数左右的区域lr<sub>maxT </sub>>lr<sub>minT</sub>,在冬季,多数区域的lr<sub>minT </sub>>lr<sub>maxT</sub>,lr<sub>meanT</sub>一般处于lr<sub>maxT</sub>和lr<sub>minT</sub>之间。
Study of the temporal and spatial evolution law of land surface temperature in China
中国地表温度时空演变规律研究
Comprehensive physiographic regionalization of China using GIS and SOFM neural network
基于GIS与SOFM网络的中国综合自然区划
Review on validation of remotely sensed land surface temperature
DOI:10.11867/j.issn.1001-8166.2017.06.0615
[本文引用: 1]
Land Surface Temperature (LST) is an important input parameter for many land surface models. Retrieving LST from remote sensing is the main approach for modelling the radiance balance and energy budget at both regional and global scales. Validation of remotely sensed LST is helpful to evaluate its accuracy and stability. Furthermore, it is meaningful for the retrieval and application of remotely sensed LST. Here, first, theories and methods of LST retrieval were reviewed. Second, four validation methods, including the Temperature-based (T-based), Radiance-based (R-based), cross comparison and Time-series analysis, were reviewed and compared. An in-depth examination was conducted for the T-based method from the aspects including the approaches for acquiring the ground truth value, the target LST products, the uncertainty sources. Finally, some important issues in LST validation were discussed.
卫星遥感地表温度的真实性检验研究进展
DOI:10.11867/j.issn.1001-8166.2017.06.0615
[本文引用: 1]
地表温度是多种地表过程模型的输入参数,遥感反演地表温度是估算区域及全球尺度上地表辐射平衡和能量收支的关键手段。对遥感地表温度开展真实性检验有利于客观评价其精度和稳定性,对遥感地表温度的反演及应用都具有重要意义。简单回顾了通过遥感手段反演地表温度的基本原理和常用方法。回顾并分析了基于实测地表温度的检验方法、基于辐亮度的检验方法、交叉比较以及时间序列分析4种典型地表温度真实性检验方法的优缺点。在此基础上,重点总结了地表温度直接检验方法中地面观测数据获取方法、检验对象,分析了直接检验中的不确定来源。最后,对地表温度真实性检验中存在的问题进行了讨论。
Review of methods for land surface temperature derived from thermal infrared remotely sensed data
热红外地表温度遥感反演方法研究进展
The validation of Chinese land surface temperature products retrieved from moderate resolution imaging spectroradiometer data
中国MODIS地表温度产品验证
Estimation of land surface temperature retrieved from EOS/MODIS in Naqu area over Tibetan Plateau
青藏高原那曲地区MODIS地表温度估算
Verification of high-resolution land surface temperature by blending ASTER and MODlS data in Heihe River Basin
黑河流域ASTER与MODIS融合生成高分辨率地表温度的验证
Estimation of land surface temperature from MODIS in Northeast China
DOI:10.11821/dlyj201711017
[本文引用: 1]
Land surface temperature (LST) is an important parameter driving dynamics of biogeophysical processes on Earth surface. It has significant impacts on the distribution of permafrost and the change of the active layer depth. Conventional acquisition of LST data usually comes from weather station monitoring in a small and discrete scope. NASA's MOD11 A1 surface temperature product can provide a wide range of surface temperature data. In winter, however, the confusion of clouds and snow often leads to a large amount of data missing in the MOD11 A1 products in the permafrost region. In this paper, an improved split-window algorithm was selected to re-build the LST products in Northeast China, one of the major permafrost regions in China. Within the common land covers extracted from remote sensing classification results, such as vegetation, bare soil, water and snow. We extracted LST in each cover type from four cloud-free MODIS 1B satellite images in 2006. Both our results and the original MOD11 A1 products were statistically compared with ground measurements at weather stations. The average difference between our results and measurements at meteorological stations was small, reaching a room-mean-square error (RMSE) of 1.24 ℃. In comparison with the original MOD11 A1 products, our results took advantage of land covers and revealed better distributions of land surface temperature in snow area, and had a high consistency with the surface temperature products. This study provides a good approach to filling in the gaps of current land surface temperature products due to confusion caused by the cloud and snow.
东北冻土区MODIS地表温度估算
DOI:10.11821/dlyj201711017
[本文引用: 1]
地表温度作为重要的地表参数是驱动土壤热状态的主要因子,对冻土分布和活动层厚度变化的研究具有重要意义。常规方式获取地表温度数据往往来自气象站点监测,范围小且不连续。NASA官网提供的MOD11A1地表温度产品可以提供大范围地表温度数据,但在冬季由于对云与雪的混淆导致大量的数据缺失,影响该产品在东北冻土区的使用。根据对东北冻土区植被、裸土、水体、积雪等常见下垫面状况的遥感分类结果,利用劈窗算法反演2006年四幅少云或无云的MODIS1B卫星影像,并分别以气象站实测数据和MODIS温度产品进行验证和对比分析。结果表明:该方法得到地表温度结果与气象站点实测数据误差较小,平均绝对误差仅为1.24 ℃。且可根据分类情况较好的得到积雪区域地表温度的空间分布状况,与地表温度产品的一致性较高,弥补地表温度产品因为云和积雪的混淆所导致的数据缺失,得到较为完整的地表温度空间分布数据。
Validation of algorithms for retrieving land surface temperature based on MODIS data: A case study in the upper reaches of Heihe River
针对MODIS数据的地表温度反演算法检验: 以黑河流域上游为例
MODIS-based air temperature estimation in the Hengduan Mountains and its spatio-temporal analysis
基于Modis地表温度的横断山区气温估算及其时空规律分析
Spatial-temporal characteristics of land surface temperature in Tianshan Mountains area based on MODIS data
Based on the MODIS/MOD11A2 data from 2001 to 2013, this paper researched the characteristics of land surface temperature (LST) of Tianshan Mountains area. The results indicated that the average of LST in the study area was 1.73 °C, and LST was much higher in the east than in the west. The inter-annual variation range of LST in the northwest was significantly large than in other regions, with the largest above 0.55 °C in some areas. The LST tended to slowly increase with time, and the increase rate was 0.147 °C. a-1. It showed a significant seasonal difference, and the fluctuation of winter was significantly larger than in other seasons with the coefficient of variation reaching 12.7%. The LST difference of day time was greater than that at night, and that in summer was greater than in other seasons. The LST differed with land use types, and the fitted results were inconsistent between the LST and NDVI. With the increase of NDVI of woodland and grassland, the LST decreased dramatically. The LST of construction land and cropland under the influence of human activities had higher sensitivity with NDVI than other land types.
基于MODIS数据的天山区域地表温度时空特征
基于2001—2013年MODIS地表温度产品及TM影像遥感解译的土地利用类型数据,对天山区域地表温度时空特征进行分析.结果表明: 2001—2013年,研究区地表平均温度达1.73 ℃,呈东高西低的特点,西北部分地区的地表温度年际变化幅度明显高于其他地区,局部地区在0.55 ℃以上;地表温度呈逐年缓慢增加趋势,增加率为0.147 ℃·a<sup>-1</sup>,季节性差异明显,冬季地表温度波动幅度较大,变异系数达12.7%,地表温度的差异白天大于夜晚,夏季明显高于其他季节;不同土地利用类型的地表温度之间存在差异,与对应像元的归一化植被指数之间存在不同的拟合效果.随着植被盖度的增加,林地、草地地表温度下降明显,归一化植被指数每下降0.1时,林地和草地的地表温度降幅为3.74、5.04 ℃;受人为活动影响较多的城镇用地和农地的地表温度与归一化植被指数之间的敏感性高于其他土地利用类型.
Surface temperature variations and their relationships with land cover in the Pearl River Delta
Scale effect of the spatial correlation between urban land surface temperature and NDVI
DOI:10.18306/dlkxjz.2018.10.006
[本文引用: 1]
The spatial correlation between urban land surface temperature (LST) and vegetation coverage (NDVI) has been widely studied, but its scale effect is often ignored, which brings uncertainty to the results. Taking Zhengzhou City as an example and based on four Landsat8 images, this study retrieved the land surface temperature by the radiation conduction method, and identified the spatial correlation analysis scale of the land surface temperature by using the semivariance function. It then combined the spatial correlation index Moran's I to discuss the spatial correlation between land surface temperature and vegetation coverage from three aspects: multi-scales, multi-seasons, and multi-adjacent ranges. The results show that: (1) Both the univariate spatial autocorrelation scale and bivariate spatial correlation scale of LST and NDVI are around 300 m; (2) Within the 300 m correlation scale, there is a significant scale effect in the univariate spatial autocorrelation, but the scale effect of bivariate spatial correlation is much weaker by comparison; (3) The univariate spatial autocorrelation and bivariate spatial correlation scale effects of LST and NDVI show significant seasonal differences; (4) With the increase of adjacent range, the spatial autocorrelation of LST and NDVI weakens, and the scale effect is more obvious. Therefore, to measure the spatial correlation between LST and NDVI, spatiotemporal scale effect should be taken into consideration. This study should be helpful for further understanding the scale effect of spatial correlation between LST and NDVI.
城市地表温度与NDVI空间相关性的尺度效应
DOI:10.18306/dlkxjz.2018.10.006
[本文引用: 1]
城市地表温度与NDVI的空间相关性已被广泛研究,但是其尺度效应常常被忽略,给研究结果带来不确定性。本文以郑州市为例,基于四幅Landsat8影像,经辐射传导法反演地表温度(LST),运用半变异函数识别地表温度的空间相关性分析尺度,并结合空间相关指数Moran's I,从多尺度、多季节、多邻接范围3个方面对地表温度与植被覆盖的空间相关性的尺度效应进行了探讨,结果表明:①LST和NDVI的单变量空间自相关和双变量空间相关尺度均在300 m左右;②300 m相关尺度内,单变量空间自相关性存在显著尺度效应,相比之下双变量空间相关性尺度效应较为微弱;③LST和NDVI的单变量空间自相关性和双变量空间相关性尺度效应均表现出明显的季节差异;④随着邻接范围增大,LST和NDVI的空间自相关性减弱,尺度效应更明显。因此度量LST和NDVI的空间相关性要考虑时空尺度效应,本文研究结果有助于进一步认识LST和NDVI间空间相关性的尺度效应。
Analysis of factors affecting mountainous land surface temperature in the summer: A case study over Mount Tai
山区夏季地表温度的影响因素: 以泰山为例
Geodetector: Principle and prospective
DOI:10.11821/dlxb201701010
[本文引用: 3]
Spatial stratified heterogeneity is the spatial expression of natural and socio-economic process, which is an important approach for human to recognize nature since Aristotle. Geodetector is a new statistical method to detect spatial stratified heterogeneity and reveal the driving factors behind it. This method with no linear hypothesis has elegant form and definite physical meaning. Here is the basic idea behind Geodetector: assuming that the study area is divided into several subareas. The study area is characterized by spatial stratified heterogeneity if the sum of the variance of subareas is less than the regional total variance; and if the spatial distribution of the two variables tends to be consistent, there is statistical correlation between them. Q-statistic in Geodetector has already been applied in many fields of natural and social sciences which can be used to measure spatial stratified heterogeneity, detect explanatory factors and analyze the interactive relationship between variables. In this paper, the authors will illustrate the principle of Geodetector and summarize the characteristics and applications in order to facilitate the using of Geodetector and help readers to recognize, mine and utilize spatial stratified heterogeneity.
地理探测器: 原理与展望
DOI:10.11821/dlxb201701010
[本文引用: 3]
空间分异是自然和社会经济过程的空间表现,也是自亚里士多德以来人类认识自然的重要途径。地理探测器是探测空间分异性,以及揭示其背后驱动因子的一种新的统计学方法,此方法无线性假设,具有优雅的形式和明确的物理含义。基本思想是:假设研究区分为若干子区域,如果子区域的方差之和小于区域总方差,则存在空间分异性;如果两变量的空间分布趋于一致,则两者存在统计关联性。地理探测器q统计量,可用以度量空间分异性、探测解释因子、分析变量之间交互关系,已经在自然和社会科学多领域应用。本文阐述地理探测器的原理,并对其特点及应用进行了归纳总结,以利于读者方便灵活地使用地理探测器来认识、挖掘和利用空间分异性。
Spatial-temporal evolution of vegetation NDVI in association with climatic, environmental and anthropogenic factors in the Loess Plateau, China during 2000-2015: Quantitative analysis based on geographical detector model
Spatio-temporal evolution and driving factors of national development zones of China based on geodetectors
基于地理探测器的中国国家级开发区时空演化过程及其驱动力研究
Contribution analysis on spatial tradeoff/synergy of karst soil conservation and water retention for various geomorphological types: Geographical detector application
Spatiotemporal change and drivers analysis of desertification in the arid region of northwest China based on geographic detector
Delimitation of the northern boundary of the subtropical zone in China by Geodetector
DOI:10.11821/dlyj020191026
[本文引用: 1]
The boundary between warm temperate and subtropical zones is an important natural boundary in physical regionalization; however there is controversy about the specific location of the boundary. Because the earlier physical regionalization was mainly based on qualitative methods with expert knowledge, and the regionalization objectives and the adopted indicators were different, scholars had differences in the divisions of physical regions. Based on the idea of spatial differentiation, this paper used geodetector to quantitatively examine the impact of climate indicators on the northern boundary of subtropical zone of China, selected the important indicators with a large q value as the dominant factor and refered to the vegetation and soil data to explore the location of the subtropical northern boundary. The results show that: (1) The geodetector method can quickly and accurately screen the main climate indicators of physical regionalization, decide the precise location of the boundary, which improves the technical level of physical regionalization research and the objectivity of physical regionalization. (2) The new boundary delimitated in this paper is located at the altitude of 1000-1600 m on the south slope of the Qinling Mountains in the western part of the study area, slightly south compared to the previous boundaries (it is consistent with that of Zheng Du and Xi Chengfan in the east of Shaanxi); and it is north compared to the previous boundaries (especially in the north of eastern Henan and northern Anhui) in the eastern part of the study area. While maintaining the integrity of natural elements, the new boundary has a larger q value, indicating that it can well reflect the difference between the warm temperate zone and the northern subtropical zone, and the division results are reasonable.
基于地理探测器的中国亚热带北界探讨
DOI:10.11821/dlyj020191026
[本文引用: 1]
暖温带与亚热带的分界线,是自然区划中一条重要的自然界线,它的划分问题曾引起诸多学科学者的争论。由于早期综合自然区划研究多以定性、专家集成方法为主,同时区划目的、使用指标等多有不同,导致不同学者所划分的自然区多存在一定的差异。本文基于空间分异性思想,使用地理探测器定量探测气候指标对中国亚热带北界的影响,选择其中q值较大的指标如日均温≥0℃天数、最冷月1月均温、年降水和湿润指数等作为主导因子并参考植被、土壤数据探讨亚热带北界界线的位置。结果表明:① 地理探测器法可以快速、准确地筛选自然区划的主要气候指标,并确定分界线的准确位置,提高了自然区划研究的技术水平和区划界线的客观性。② 使用地理探测器划分的新界线在研究区西部位于秦岭南坡1000~1600 m的位置,与以往界线相比略偏南;在研究区东部河南东部、安徽北部比以往界线略偏北。在保持自然要素完整性的同时,新界线具有更大的q值,表明新界线可以很好的反映暖温带与北亚热带2个区划带之间的差异,划分结果具有合理性。
Analysis of spatial clustering and influencing factors of hand-foot-mouth disease in Nanning based on kenel density and geodetector
基于核密度和地理探测器的南宁市手足口病空间聚集及影响因素
Delineation of the northern border of the tropical zone of China's mainland using Geodetector
DOI:10.11821/dlxb201701011
[本文引用: 1]
The northern border of the tropical zone of China has been the focus of studies on comprehensive physical regionalization. Based on different indexes and methods, the border was delineated by different scholars, but their results varied greatly. Based on the Geodetector model and regionalization thought of spatial stratified heterogeneity, the northern border of the tropical zone of China's mainland was investigated. Climatic elements were used as dominant demarcation partitioning indexes, combined with auxiliary indexes such as soil and multiple cropping types. The key results were as follows: (1) Using Geodetector, the northern border of the tropical zone was delineated. From west to east, the border goes through Lincang, Simao, Yuxi and Gejiu in Yunnan, Baise, Mashan, Guigang and Wuzhou in Guangxi, Zhaoqing, Guangzhou, Huizhou, Heyuan and Meizhou in Guangdong, and Zhangzhou, Quanzhou and Putian in Fujian. It generally agrees with the 12℃ isotherm of the coldest monthly mean temperature, soil border between lateritic red soil and red soil, and border of double cropping rice or its continuous thermophile dry framing and single (double) cropping rice or its continuous chimonophilous dry framing. (2) The q average value of all indexes for the border was 0.40. Using this model, regionalization principles—homogeneity of the within-strata value and heterogeneity of the between-strata value—were satisfied. The border meets the requirements of zonal heterogeneity between tropical and subtropical zones. Therefore, it is reasonable to use Geodetector in studies of comprehensive physical regionalization, and it can provide high-precision technical support.
基于地理探测器的中国陆地热带北界探讨
DOI:10.11821/dlxb201701011
[本文引用: 1]
热带北界一直是中国综合自然区划研究中争议较大的问题之一,不同学者基于不同区划指标和方法等划定的中国热带北界界线差异较大。基于空间分异性的综合自然区划思想,依托最新的基于统计学原理的地理探测器模型,以气候要素为主导指标,辅以土壤类型与作物熟制等,探讨中国陆地热带北界的界线。结果表明:① 依据地理探测器模型所确定的中国陆地热带北界,自西向东依次经过滇、桂、粤和闽的临沧、思茅、玉溪、个旧、百色、马山、贵港、梧州、肇庆、广州、惠州、河源、梅州、漳州、泉州和莆田等地附近,其与最冷月均温12 ℃等温线、赤红壤与红壤界线及双季稻或双季稻连作喜温旱作与单(双)季稻连作喜凉旱作的分界线等基本吻合;② 利用地理探测器确定的中国陆地热带北界新界线的各项指标决定力q值的均值为0.40,分异明显,满足层内同质性和层间异质性最大的区划原则,完全达到了热带与亚热带的区域空间异质性要求,其划分结果合理可信,表明地理探测器模型可为综合自然区划提供良好的技术支撑。
Kilometer grid data set of China's population spatial distribution
中国人口空间分布公里网格数据集
Multi period land use and land cover remote sensing monitoring data set in China (CNLUCC)
中国多时期土地利用土地覆被遥感监测数据集(CNLUCC)
Spatial distribution data set of annual vegetation index (NDVI) in China
中国年度植被指数 (NDVI)空间分布数据集
Spatial downscaling of land surface temperature with the multi-scale geographically weighted regression
多尺度地理加权回归的地表温度降尺度研究
Mountain elevation effect of the Alps and its implication for forest line
DOI:10.18306/dlkxjz.2021.08.012
[本文引用: 1]
The Alps, a typical mountain in the Eurasia Continent with mountain elevation effect (MEE), plays an important role in determining the geo-ecological pattern of Europe. The cause of the MEE is that the uplifted plateau or mountain absorbs more solar radiation. Most of the previous studies used the difference of temperature at the same altitude or base height inside and outside the mountain to quantify the MEE. However, the above methods may have some errors. This study chose the Alps as the study area and analyzed the spatial distributions of the solar radiation, temperature, and forest line in the Alps based on the collected meteorological observation data, forest line data, and digital elevation data, as well as the solar radiation data calculated by the hemispheric horizon algorithm. For the purpose of exploring the implication of MEE for the forest line, this study used solar radiation as the representation of MEE to build a forest line distribution model. The results show that: 1) The Alps has great MEE, and solar radiations of the inner mountain are much higher than that on the edge of the mountain. It is also the main reason that the temperature and the height of forest line in the inner mountain are far higher than that in the mountain edge areas. The solar radiation in the warmest month, the coldest month, and the whole year is 10-20, 20-40 and 200-400 kWh/m2 higher than that on the edge of the mountain, respectively. 2) Solar radiation can better quantify the MEE, and forest line distribution model established with solar radiations as the substitute factor of MEE has higher simulation accuracy. The accuracy of the forest line distribution model in this study (R2 = 0.736) is higher than that of the model based on temperature and precipitation (R2 = 0.522), and the contribution rate of solar radiation to forest line distribution is the highest (34.75% in January and 27.82% in July), which exceeds the contribution rates of temperature and precipitation (26.24% and 11.17%, respectively).
阿尔卑斯山山体效应及其对林线的影响分析
DOI:10.18306/dlkxjz.2021.08.012
[本文引用: 1]
阿尔卑斯山是欧亚大陆上著名的山地,对欧洲的地理生态格局具有重要的影响。山体效应产生的原因在于隆起的高原或山地吸收了更多的太阳辐射。因此,论文以阿尔卑斯山为研究对象,利用收集到的气象台站观测数据、林线、数字高程数据,以及基于半球视域算法计算得到的太阳辐射数据等,分析阿尔卑斯山气温的空间分布格局以及最热月、最冷月、全年的太阳辐射量,同时以太阳辐射作为山体效应的代用因子,采用逐步回归分析方法构建了阿尔卑斯山林线分布模型,探究该山地的山体效应及其对林线的影响。研究结果表明:① 阿尔卑斯山具有明显的山体效应,山体内部的太阳辐射量远高于山体边缘地区,这也是山体内部气温和林线高度都高于山体边缘地区的主要原因。最热月、最冷月和全年总太阳辐射量在山体内部比边缘地区分别高10~20、20~40和200~400 kWh/m<sup>2</sup>。② 太阳辐射能更好地定量化山体效应,以太阳辐射为山体效应代用因子建立的林线分布模型具有更高的精度。与基于气温、降水构建的林线分布模型(R<sup>2</sup>= 0.522)相比,该模型具有更高的模拟精度(R<sup>2</sup> = 0.736),同时太阳辐射对林线分布的贡献率最大(1月、7月太阳辐射的贡献率分别为34.75%、27.82%),超过了气温和降水的贡献率(分别为26.24%和11.17%)。
Comparative study on the correlations between NDVI, NDMI and LST
DOI:10.18306/dlkxjz.2017.05.006
[本文引用: 1]
Through the comparative study of the correlations between the normalized difference vegetation index (NDVI), normalized difference moisture index (NDMI) and land surface temperature (LST), the suitability to research LST using NDVI and NDMI was verified. Based on Landsat 8 remote sensing imagery in the Zhengzhou-Kaifeng metropolitan area, LST was retrieved, and both NDVI and NDMI were calculated. At the overall, regional, and pixel levels, the correlations between LST and NDVI, NDMI were analyzed. Using GEO-Da, the spatial correlations between LST and NDVI, NDMI were simulated with the data of three sampling intervals of 150 m, 300 m and 450 m. The conclusions are as follows. First, there is a stronger linear negative correlation between LST and NDMI, and sectional analysis shows that NDMI resembles a mirror image of LST, whereas the correlation between LST and NDVI is much weaker. Second, buffer analysis shows that with the increase of distance from the down town and increase of the number of land use types, the correlation between NDMI and LST also increases gradually. Third, in the analysis of Moran's I spatial correlation, the negative correlations between LST and the two indices were significant, but because of the great difference between the values of water body in the two indices, NDMI and LST show stronger negative correlation, while the correlation between NDVI and LST is relatively weak. In general, compared with NDVI, NDMI is more suitable as an effective indicator for quantitative analysis of LST.
NDVI、NDMI与地表温度关系的对比研究
DOI:10.18306/dlkxjz.2017.05.006
[本文引用: 1]
通过研究归一化植被指数(NDVI)、归一化水汽指数(NDMI)与地表温度(LST)的相关关系,对比NDVI和NDMI定量分析LST的适宜程度。以Landsat 8遥感影像为数据源,以郑汴都市区为例,反演LST,计算NDVI和NDMI。从整体、分区、像元等不同层面分析NDVI和NDMI与LST的相关关系,并利用GEO-Da软件,分析150 m、300 m、450 m三种不同采样间隔数据的NDVI、NDMI与LST的空间相关性。主要结论为:①NDVI与LST的线性拟合度较差,而NDMI与LST具有很强的线性关系,剖面分析显示NDMI与LST呈显著负相关关系。②缓冲区分析结果表明,随着距城市中心距离的增加,用地类型增多,LST和NDMI之间的相关性逐渐增强。③在Moran's I空间相关性分析中,不同采样间隔下两指数与LST的负相关关系均比较明显,但由于水体在2个指数中数值的差异,使NDMI与LST表现出更强的空间负相关性,而NDVI与LST空间相关性则相对较弱。因此,总的来说NDMI是热环境研究的有效指标,与NDVI相比,NDMI与LST的负相关关系更强、更稳定,也更适宜于对LST的定量分析。
Relationship between vegetation index and ground surface temperature on the Tibetan Plateau alpine grassland
青藏高原高寒草地植被指数变化与地表温度的相互关系
Vegetation-water vapor-land surface temperature correlation analysis of typical deserts and oases in Xinjiang
新疆典型沙漠和绿洲植被-水汽-地表温度相关性分析
Mapping bioclimatic indices by downscaling MODIS land surface temperature: Case study of the Saint-Emilion Area
Spatio-temporal variation of the urban heat island in Santiago, Chile during Summers 2005-2017
The objective recognition and classification of northeast cold vortex and the northern hemisphere atmospheric circulation characters in May to August
DOI:10.13249/j.cnki.sgs.2015.08.1042
[本文引用: 2]
Based on the NCEP/NCAR daily reanalysis data of 500 hPa geopotential height, objective identification method by computer is used to search the Northeast China cold vortex(NECV) activities ongoing process in summer(May to August) from 1948 to 2012 in this study. Results show that the NECV process occured 956 times in total, the average annual occurred about 14.7 times in May-August. And the NECV events of 4 129 days, wherein 14、18、18 and 14 days are occured in May to August, respectively, a total of 64 days 52% of the total number of days. The NECV process main sustained 3-6 days, maintaining position between the 121°E-131°E and 48°N-53°N. Simultaneously, the NECV occurrence frequency and active days significant increases. In July-August, the strong NECV year,Lake Baikal to the Sea of Okhotsk blocking high regularly simultaneoued with the NECV. On the contrary, in the weak NECV year, Lake Baikal to the Sea of Okhotsk blocking high was not prevailed,and in most year the NECV happenned after the blocking high.The Differences in geopotential height anomaly distribution between the strong NECV year and the weak NECV year appear anti-phase distributed, moreover this feature in the middle(500 hPa) and senior(200 hPa) convection showed a nearly hemispherical scale wave train distribution. However their composite differences in geopotential height were similarity, showed a significant meridional "+,-" wave train(exceed 99% confidence level),this wave train was located in the Pacific Northwest region and the Sea of Okhotsk to the Bering Sea region, corresponding to the senior convection cyclonic and anticyclonic circulation.
5-8月东北冷涡客观识别分类及北半球大气环流特征分析
DOI:10.13249/j.cnki.sgs.2015.08.1042
[本文引用: 2]
采用美国国家环境预报中心(NCEP)500 hPa高度场逐日再分析资料,基于计算机客观识别方法,统计了1948~2012年5~8月东北冷涡活动过程。结果表明:共计发生东北冷涡过程956次,平均每年5~8月发生约14.7次;东北冷涡活动共4 129 d,5~8月平均分别为14 d、18 d、18 d和14 d,共64 d,占5~8月总天数的52%;5~8月东北冷涡过程以持续3~6 d为主,冷涡活动主要位于121°E~131°E,48°N~53°N区间;5~8月东北冷涡发生频次和活动天数均存在显著增长趋势。7~8月东北冷涡活动异常多年份,贝湖至鄂海阻高与东北冷涡多同时发生,异常少年份,贝湖至鄂海阻高亦不盛行,且阻高先发生冷涡后发生年份占多数。5~6月和7~8月东北冷涡典型特多年高度距平合成场与特少年的主要异常区分布呈反位相,且这种反位相特征在对流层中、高层(200 hPa、500 hPa)均呈近半球尺度的波列分布;5~6月和7~8月东北冷涡活动特少年和特多年差值高度场合成分布相近,均呈现显著的南北向"+、–"波列分布(置信度水平≥99%),正负波列分别位于西北太平洋区域和鄂霍次克海至白令海区域,该波列对应高度层风场中的相对位置为气旋和反气旋式环流。
Ecological risk assessment based on terrestrial ecosystem services in China
DOI:10.11821/dlxb201903003
[本文引用: 1]
The ecological risk assessment was previously explored according to ecological entity characteristics, such as point source threat and regional landscape pattern change, and ignored the factors related to the human well-being. The academic contribution of the essay is to integrate ecosystem services into assessment system of ecological risk in a new perspective. In this paper, the spatial mapping of ecosystem services on China's land is reconstructed with the aid of GIS and RS. Moreover, the ecological risk analysis model is established in order to quantitatively expound the spatial pattern of the ecological risk based on ecosystem services, and identify ecological risk control priority regions at different confidence levels. The results showed that: (1) From 2000 to 2010, the average annual value of total terrestrial ecosystem services index in China was between 0-2.17, and slightly fluctuated between 0.30-0.57 over the years. Some 24.7% of the regions with significantly increasing value included Taiwan, Yunnan-Guizhou Plateau, inland Xinjiang of northwest China, 37.1% of the regions with significantly decreasing value, including northeast China, Qinghai-Tibet Plateau, central and eastern regions of China; (2) The risk losses of ecosystem services were exposed to different situations under different confidence levels. When the confidence level was 90%, the potential loss ratio of the total ecosystem services index was 24.19%, and the ecological risk index was 0.253. Furthermore, by analyzing the relationship between confidence level and ecological risk index, when the confidence level was high, the probability of risk was reduced correspondingly, but the losses correspondingly increased when risk occurred; (3) We investigated the scenario as an example under the 90% confidence level. The different eco-regions with the risk characteristics are as follows: the top six eco-regions with average ecosystem services risk index are Inner Mongolia Plateau, North China Plain, Loess Plateau, Northeast China Plain, Hengduan Mountain Region, and Qinghai-Tibet Plateau. The proportions of the eco-regions with extreme risk are 55.89%, 26.63%, 24.35%, 20.62%, 18.70% and 25.12%, respectively.
基于生态系统服务的中国陆地生态风险评价
DOI:10.11821/dlxb201903003
[本文引用: 1]
传统的生态风险评价主要依据是点源性威胁、区域景观格局变化等生态实体特征指标,忽略了与实体功能属性密切相关的人类福祉因素。将生态系统服务纳入生态风险评价体系是一个新的研究思路。本文运用GIS和遥感技术重构了中国陆地生态系统服务的空间图谱,采用生态风险分析模型给出了基于生态系统服务的中国陆地生态风险格局的定量描述和空间分布,划定了不同置信水平下的生态风险管控优先区。结果表明:① 2000-2010年中国陆地生态系统年均总生态系统服务指数取值在0~2.17之间,年际间呈现小幅波动趋势,年平均总指数在0.30~0.57之间变化,其中24.7%的区域显著增加,主要分布在台湾、云贵高原及新疆西北内陆区,37.1%的区域显著减少,主要分布在东北、青藏高原及中东部地区;② 不同置信水平下的中国陆地生态系统服务存在的风险损失不尽相同。如当置信水平为90%时,总生态系统服务指数的可能损失比例为24.19%,生态风险指数为0.253。比较置信水平和生态风险指数间的关系,发现当置信水平较高时,生态系统服务蒙受风险的概率相应降低,但此时出现风险时所承受的损失也对应增加;③ 以90%置信水平为例,中国生态地理区划的风险特征表现为:平均生态系统服务风险指数居前列的六位依次为内蒙古高原生态区、华北平原生态区、黄土高原生态区、东北平原生态区、横断山生态区、青藏高原生态区,极重度风险所占区域面积比例依次为55.89%、26.63%、24.35%、20.62%、18.70%、25.12%。
Population distribution in China: Statistical tables and density maps are attached
DOI:10.11821/xb193502002
[本文引用: 1]
China is the most populous country of the world.Besides her great numberof population she has also the most densely inhabited regions which are notcomparable with any other country of the world.
中国人口之分布: 附统计表与密度图
DOI:10.11821/xb193502002
[本文引用: 1]
年来中外学者,研究中国人口问题者,日见其多,中国人口是否过剩,国境以内,是否尚有大量移民之可能,此实当今亟须解答之间题,各方对此之意见,甚为纷歧;或则谓中国人口,实已过剩,此可由社会生计艰难,失业问题严重,以及海外侨民之多可以证之;或则谓中国人口,实未过剩,以全国面积除全国人口,计算其密度,较之欧西诸国,尚不及远甚,国境西北部,地旷而人稀,将来实大有移民之可能.
Bole-Taipei Line: The important function and basic conception as a line for regional balanced development
DOI:10.11821/dlxb202002001
[本文引用: 1]
Promoting regional coordinated development strategy is one of the most important strategies in the new period of China. Faced with the reality of unbalanced and insufficient regional development in China, it is objectively necessary to construct one or more main axes supporting the coordinated and balanced development of regions to become the identification line representing the pattern of coordinated regional development. The results show that the Bo-Tai line, the northwest-southeast axis connecting Bole of Xinjiang and Taipei of Taiwan, can be built into a national development backbone line and regional balanced development line, just perpendicular to the Hu Line. In 2016, the area of southwest half and northeast half of Bo-Tai Line accounts for 59:41, while the population accounts for 45:55, the economic aggregate accounts for 40:60, the per capita GDP ratio accounts for 44:56, the population density ratio accounts for 38:62, the economic density ratio accounts for 32:68, and the urbanization level ratio accounts for 48:52. The main average indicators gradually tend to present a balanced development pattern. Further analysis shows that Bo-Tai Line is a strategic shoulder pole connecting two core zones of the Belt and Road, and is the peaceful reunification line of China's national tranquility and Taiwan's return. The Bo-Tai Line is also a solid line supported and connected by comprehensive transportation channels and a Pipa type symmetrical line for the development of cities and urban agglomerations. It is the backbone of the two-way opening up and the linkage development line between land and sea. It is also an important dividing line that promotes the coordinated development of the eastern, central and western regions, and addresses the imbalance and inadequacy of regional development. The Bo-Tai Line plays an irreplaceable strategic role in promoting the coordinated and balanced regional development. It is suggested that the construction of Bo-Tai Line should be included in the national development strategy, and the development strategic plan of Bo-Tai Line should be formulated to fully release the multiple potential functions. We should build three strategic support points (the northwest endpoint, the central strategic node and the southeast endpoint), carry out a comprehensive scientific investigation of the Bo-Tai Line, and strengthen the scientific cognition and publicity, and promote China's development in a higher-level, higher-quality, more coordinated, safer and more civilized direction. And we should make the Bo-Tai Line known to China and the world, and let the Bo-Tai Line truly become the backbone of the great rejuvenation of the Chinese nation.
博台线: 中国区域发展均衡线的重要功能与建设构想
DOI:10.11821/dlxb202002001
[本文引用: 1]
推动区域协调发展战略是中国新时期的重大战略之一,面对中国区域发展不平衡不充分的现实,客观上需要构筑一条或多条支撑区域协调均衡发展的主轴线,成为表征区域均衡发展格局的标志线。反复审视中国区域发展版图并计算发现,垂直于胡焕庸线的博台线(连接新疆博乐市与台湾省台北市的西北—东南走向的轴线)可建成中国区域发展均衡线。2016年博台线西南半壁与东北半壁国土面积占比为59:41,而两侧人口占比约为45:55,经济总量占比约为41:59,并分别向50:50的平衡格局演变;两侧人均GDP比值为44:56,人口密度比值为38:62,经济密度比值为32:68,城镇化水平比值为48:52,主要均量指标都逐步趋向1:1的均衡发展格局。进一步分析发现,博台线是连接“一带一路”双核心区的战略扁担线,是国家安宁和台湾回归的祖国和平统一线,是综合交通运输通道支撑连接的实体线和国家城市与城市群发展的琵琶型对称线,也是双向对外开放的中坚线、海陆联动发展的对接线,更是促进东中西部、南北协调发展、解决地区发展不平衡不充分的重要分界线,博台线对推动国家区域协调均衡发展具有不可替代的重要功能与战略作用。建议将博台线建设纳入国家发展战略,制定博台线发展战略规划,充分释放博台线承载的多重潜在功能,突出建设博台线上西北端点、中部战略节点和东南端点三大战略支撑点;开展对博台线的综合科学考察,加大对博台线的科学认知与宣传力度,让中国认识博台线,让世界了解博台线;把博台线建成国家发展的战略脊梁线,让博台线成为破解胡焕庸线、缩小地区发展差距的新路径。
Study on the stability of Hu Line and different spatial patterns of population growth on its both sides
DOI:10.11821/dlxb201504004
[本文引用: 1]
The Hu Line for population distribution in China has been regarded as one of the greatest geographical discoveries in China because it reveals the significant spatial characteristics of China's human-land relationship. Thus, the stability and significance for spatial development of Hu Line have become a major concern after the dramatic economic and social changes since China's reform and opening-up in 1978. With the support of GIS, this paper conducts a statistical analysis and systematic investigation on the stability and spatial patterns of population growth on both sides of Hu Line by constructing the spatial database of China's census data from 1982 to 2010 and initiating a new method for identifying the spatial patterns of population growth. The findings are as follows: (1) The Hu Line has been rather stable, while a new tendency of population change has emerged. On the whole, the ratio of population on both sides of Hu Line has roughly been kept at 94:6 (the southeastern side: the northwestern side) in the last 30 years. However, the proportion of population on the southeastern side of Hu Line has been slightly decreasing, while that on the northwestern side of Hu Line has been slightly increasing, which is benefited from its higher rate of natural population growth. (2) The spatial patterns of population growth on both sides of Hu Line were quite different. The agglomeration degree of population distribution on the southeastern side of Hu Line increased greater. The areas with negative population growth rate have rapidly expanded, mainly located south of the Qinling Mountains - Huaihe River line and the northeastern China, while the areas with the fast population growth rate concentrated in the areas such as the Yangtze River Delta, the Pearl River Delta and Beijing-Tianjin metropolitan region. Thus, the spatial pattern of population growth on the southeastern side of Hu Line presented an aggregating and diffusion mode of Matthew effect. (3) The spatial pattern of population growth on the northwestern side of Hu Line could be referred as the relative balance type. In this region, the positive rate of population growth and the lower agglomeration degree of population have been identified. There were lots of ethnic groups located on the northwestern side of Hu Line, and they generally lived dispersedly but with a higher rate of natural population growth due to preferential population policy. However, there were also some areas with negative rate of population growth on the northwestern side of Hu Line and they were mainly distributed close to the Hu Line and new Eurasia Land Bridge. (4) In the future, the spatial patterns of population growth on both sides of Hu Line will continue to change. On the southeastern side of Hu Line, the capacity of population agglomeration for those small and medium-sized cities and towns should be enhanced. As for the northwestern side of Hu Line, the emphasis should be placed on promoting its urbanization and enhancing the capacity of population agglomeration for major cities.
“胡焕庸线”的稳定性及其两侧人口集疏模式差异
DOI:10.11821/dlxb201504004
[本文引用: 1]
“胡焕庸线”是反映中国人地关系的重要地理发现之一。在当今中国经济社会背景下,“胡焕庸线”所表达地理意义及其对城镇化发展的指导作用受到广泛关注。在GIS的支持下,构建了改革开放以来4次人口普查的县级空间数据库,提出人口时空扩张的识别方法,对“胡焕庸线”两侧的人口数量、集疏格局进行统计、分析,主要得出以下结论:① “胡焕庸线”两侧人口数量94:6的大数一直相对稳定,但东南半壁人口持续微减、西北半壁人口持续微增。得益于较高的自然增长率,西北半壁具有较高的人口增长速度。② “胡焕庸线”两侧呈现出迥然不同的人口集疏模式。东南半壁人口集中化程度提升较快,负增长区在“秦岭—淮河”以南、东北等地区大面积扩张、人口正增长优势逐步极化到长三角、珠三角、京津等少数地区,呈现“马太效应”式的集疏模式。主要是由于东南半壁内部区域经济差异及快速城镇化带来的剧烈人口流动。③ 西北半壁则呈现“相对均势”的人口集疏模式,多数地区的人口普遍表现为正增长,但是空间分布广袤、增长不集中,人口集中化程度提升缓慢。主要是由于少数民族“多分散、少聚居”造成了自然增长优势的不集中。然而均势是相对而不是绝对的,同样存在一定的负增长区,主要分布在“胡焕庸线”和“新欧亚大陆桥”两条带上。④ 未来时期,“胡焕庸线”两侧的人口分布及集疏格局将进一步演化,东南半壁应关注内陆腹地及中小城镇对人口的吸纳作用,西北半壁应关注将分散的人口增长优势向少数城镇进行集聚,以期为人口地理学研究以及城镇化发展提供参考。
Analysis of factors influencing the "source-sink" landscape contribution of land surface temperature
DOI:10.11821/dlxb202201004
[本文引用: 1]
Urban heat island aroused by urbanization has become one of the most serious environmental problems in China. To solve such an "urban disease" and achieve sustainable development, the relationships between urban heat and natural, socio-economic, and landscape pattern factors need to be explored. Firstly, this study identified the "source-sink" landscape of urban heat islands based on the identification of Heat Source and Sink Landscapes (HSI). Secondly, the contribution index (CI) of the "source-sink" landscape and its ratio was calculated to analyze spatial and temporal evolution. The spatial Durbin model was used to analyze the influence of natural, socio-economic, and landscape morphology factors on the CI of "source-sink" landscapes. The results are as follows: (1) During 2005-2015, more provinces could alleviate the heat island effect in winter than they could in summer. In winter, the "strong" and "weak" Landscape Index regions were concentrated in northern and southern China, whereas in summer, the "strong" Landscape Index areas were concentrated in the northern region. (2) Considering local factors, the landscape shape had a great impact on the contribution of the "source" or "sink" landscape. Therefore, to reduce the heat island effect, adjacent small "sink" patches can be combined to lessen the dispersion of the surface temperature of "sink" landscapes. In addition, to achieve the best cooling effect during the summer, the relative humidity and vegetation coverage needs to increase in the "source" landscape, and the building density and height of the "source" landscape and "sink" landscape need to be strictly controlled. (3) The relative humidity and building density of neighbourhoods showed significant impact on the local heat island. Thus, by increasing the dispersion of "source" landscapes and their edge density, or by increasing the concentration of "sink" landscapes and simplifying their shape, it is possible to alleviate the heat island effect in neighborhoods.
地表温度“源-汇”景观贡献度的影响因素分析
DOI:10.11821/dlxb202201004
[本文引用: 1]
在中国快速城市化进程中,城市热岛是严重的环境问题之一。探究城市热岛的影响因素,建立与自然因子、社会经济因子、景观形态因子的关联,对解决中国“城市病”,实现可持续发展具有重要的意义。本文首先在全国尺度上基于地表温度“源—汇”景观指数识别地表温度的“源”景观/“汇”景观,在此基础上计算“源—汇”景观贡献度及其效应,分析其时空演变规律;其次,基于空间杜宾模型分析自然因子、社会经济因子和景观形态因子对“源—汇”景观贡献度的影响,结果发现:① 2005—2015年间,可缓解热岛效应的省份冬季较夏季多,冬季“强”和“较弱”景观贡献度比值区域集中分布在中国北部和南部;夏季“强”的“汇”与“源”景观贡献度比值区域集中分布在中国北部地区。② 对于本地因子,景观形态对“源”或“汇”景观贡献度的影响较大,缓解热岛效应将附近小“汇”斑块结合来降低地表温度“汇”景观的离散度;其次,夏季适当在“源”景观里增加相对湿度、并增加其植被覆盖率,严格控制“源”景观和“汇”景观的建筑密度及建筑高度,可达到最佳降温效果。③ 邻域因子中相对湿度和建筑密度的影响更大,景观形态中增加“源”景观的离散度及其边缘密度,或增加“汇”景观集聚度,简化其形状均有利于缓解邻域的热岛效应。
Interpretation of IPCC AR6 on human influence on the climate system
IPCC AR6报告解读: 人类活动对气候系统的影响
The climatic impact-driver framework
IPCC AR6报告解读: “产生影响的气候因子”评估框架
Signal and impact of wet-to-dry shift over Xinjiang, China
DOI:10.11821/dlxb202101005
[本文引用: 1]
Xinjiang, a unique natural unit, is sensitive to the global warming. Studies on the spatial-temporal variation and impacts of drought and wetness in Xinjiang have a significant effect on the adaptability of future climate change. Based on observations of monthly mean temperature, monthly precipitation, and calculated standardized precipitation evapotranspiration index (SPEI), this paper analyzes the drying trend and impacts of climate change on the water resources and vegetation dynamics over Xinjiang, China. The results can be shown as follows: (1) The climate experienced a significant shift from warm-wet to warm-dry over Xinjiang in 1997 based on the SPEI data, after which the frequency, trend, dry months and percentage of stations of drought increased sharply. (2) The increased meteorological drought severity had a direct effect on the normalized difference vegetation index (NDVI) and river discharge. The NDVI exhibited a significant decrease during the period 1998-2015 compared with 1982-1997, which was found to be caused by increased soil moisture loss. (3) The hydrological drought was very complicated and not entirely comparable to the SPEI droughts. Hydrological records indicate that runoff in most rivers in the Tianshan Mountains has increased, while it remained stable or even decreased slightly in the Kunlun Mountains over the past 20 years. The runoff in Xinjiang is strongly influenced by glacial melt, and it is getting worse due to global warming. The climatic shift and intensified climate extremes over Xinjiang have resulted in SPEI-drought severity. These changes also have possibly intensified the instability of water cycle system and ecosystem. The results provide valuable decision-making reference for the regional drought disaster prevention, reduction and emergency management over Xinjiang, China.
新疆气候“湿干转折”的信号和影响探讨
DOI:10.11821/dlxb202101005
[本文引用: 1]
新疆是对全球变化响应最敏感地区之一,分析全球变暖背景下新疆干湿气候变化及其影响,对应对和适应未来气候变化带来的影响具有重要意义。基于气象水文观测资料,对新疆区域干湿气候变化及其影响评估进行了探讨。结果表明:① 20世纪80年代中后期以来新疆气温升高,降水量增加,呈“暖湿化”特征;但1997年之后,干旱变化趋势、干旱频率、干旱发生月份等均有明显增加,导致70%以上的区域变干,新疆气候出现了从“暖湿化”向“暖干化”转折的强烈信号,即发生了“湿干转折”;② 新疆气候转折对区域生态和水资源造成明显的影响,归一化植被指数(Normalized Difference Vegetation Index, NDVI)经历了先增后减的变化过程,1982—1997年植被趋于“变绿”,但1997年之后植被长势迟滞,土壤水分明显下降,生态逆转,生态负效应凸显;③ 新疆河流径流变化出现明显的区域差异,对干湿气候转折响应复杂,受冰雪融水对径流补给比例的影响,发源于天山的河流径流对区域干湿变化有正响应,但发源于昆仑山的河流径流响应不明显。研究结果表明气候“湿干转折”和极端气候事件加剧背景下新疆干旱化急剧增加,水循环系统和生态系统不稳定性加剧,相关成果可为区域干旱灾害防灾减灾和风险管理提供有价值的决策参考。
