

1 引言
气候变化是当今人类面临的巨大挑战之一,已成为影响和制约经济社会可持续发展的重要因素[1⇓-3]。气候变化极大地改变着农业生产要素时空格局及农业生产过程,进而威胁全球粮食安全[4⇓-6]。气候变化致使全球主要粮食作物水稻、小麦产量分别下降了约0.3%和0.9%[7]。未来情景下,2050年全球大豆可能减产14%~43%,春小麦减产约14%~52%[8],农业生产力总体下降2%~15%[9]。21世纪末,全球水稻、小麦等四大作物平均减产可达5.6%~18.2%[10]。因此,强化气候变化对农业生产的影响机制研究,增强适应气候变化能力已成为全球及区域可持续发展的重要战略任务。部分学者发现作物产量波动主要受制于平均气温变化[11-12],平均气温每升高1 ℃,玉米减产5.8%[12],小麦减产5.7%[13],水稻减产3.2%[10]。然而,也有学者指出未来全球降水波动异质性强,作物产量对降水的敏感性高于气温[14-15]。农业生产是一个多因素综合作用的复杂过程,尽管大量研究通过联合多种作物模型模拟探究气候变化的可能影响,涵盖作物种类不断丰富、响应指标更加全面、机理探析日趋深入,但由于模型自身结构、前提假设以及输入参数等原因,结果仍具有一定不确定性[16-17]。另一方面,大多数作物模型虽然考虑了气候变化、作物水分供需及生长季缩短/延长等关联过程,但对其级联效应定量化尚需深入[10,18]。
东北地区是北半球三大黑土区之一,也是中国最大的商品粮生产基地[19],玉米、水稻和大豆等农作物产量约占全国总产量的30%[20-21]。多年来,由于过度开垦利用、不合理的耕作活动以及长期的重用轻养观念等原因,东北黑土区水土流失严重、土层变薄肥力下降[22-23],土壤养分效率低,环境风险增大[23-24]。同时,东北黑土区也是中国气候变化的敏感区和影响显著区之一。近50年来,区域平均气温上升速率为0.38 ℃/l0a,高于全国平均水平[25]。未来情景下东北黑土区平均气温将进一步增加[26],降水量总体上呈现波动增加态势,但异质性增强[27]。水热条件改变在一定程度上提高作物生产潜力,为农业生产带来了巨大机遇,但也可能导致农业气象灾害加剧。《中国水旱灾害公报2019》指出,东北地区农作物旱涝受灾面积分别达3.29×106 hm2和4.60×10⁶ hm2,未来农业生产脆弱性与风险可能加大[28]。黑土地保护与科学利用由此成为保障国家粮食安全战略的核心议题。习近平总书记也多次强调“把黑土地用好养好、把中国人的饭碗牢牢端在自已手中”。可见,明晰气候变化下东北黑土区作物生产的响应特征及定量辨识农业气象灾害风险程度不仅是解决国计民生的科技攻关,也是落实中央指示的重大政治任务。
多年来,国内外学者借助田间实验、遥感反演以及模型模拟等手段,围绕东北地区气候变化对农业生产的可能影响开展了深入研究,取得了丰硕成果[29⇓⇓-32]。例如,Chu等探讨了农业热量资源和降水资源空间分布及其变化趋[31],Zhang等[26]和Lv等[33]分析了玉米、水稻等作物产量的波动特征及未来趋势。也有研究指出了作物开花期与成熟期等物候现象的响应规律[34-35]以及作物物候对作物生长的影响[32]。但鲜有研究以物候为链接,解析气候变化与物候响应对农业生产的综合效应。此外,农业气象灾害风险评估中定量辨识气候因子总体贡献与风险等级定量化程度不足[36],难以为决策者提供更加精准的信息。鉴于此,本文基于气候变化—物候响应—生产力动态—风险评估的全链条工作思路,旨在开展 ① 明确东北黑土区气候变化特征与作物物候响应规律;② 阐明气候因子与作物物候变化对农业生产的综合影响;③ 定量预估不同温升目标下农业风险演变过程及空间格局特征,以期为科学制定应对气候变化管理策略、保障国家粮食安全提供支撑。
2 数据来源与分析方法
2.1 研究区概况
东北地区包括辽宁省、吉林省、黑龙江省和内蒙古自治区呼伦贝尔市、兴安盟、通辽市、赤峰市等地,总面积约125万km2 [37],本文将此范围界定为研究区域。该区属于温带大陆性季风气候,夏季高温多雨、冬季寒冷干燥,年平均气温为-1~9 ℃,年降水量约500~800 mm,6—9月降水量占全年的60%~70%,无霜期约为140~170 d[25]。东北地区黑土集中连片,黑土区涉及146个县级行政区,总面积约55.6万km2 [38],黑土土壤肥沃,大豆和玉米产量分别占全国总产量的45.8%和32.8%(
2.2 数据来源
数据包括:① 东北黑土区矢量边界。采用刘宝元等[38]界定的东北典型黑土区边界,通过数字化获取,包括蒙东黑土亚区、松嫩黑土亚区和三江黑土亚区。② 土地利用数据。2000年和2015年1 km分辨率土地利用数据来自中国科学院资源环境科学与数据中心(
首先借助ArcGIS 10.4将东北黑土区矢量边界及土地利用数据转为1 km栅格数据(投影与气候插值数据一致),并采用2000年和2015年土地利用中耕地分布区域进行黑土区掩膜提取,尽量减少研究时段内由土地利用类型变化所导致的不确定性,同时剔除4月初至生长旺季(EVI峰值)间平均EVI值小于0.05的植被稀疏区,最终生成东北黑土区农业种植范围(图1)。将EVI数据重采样为1 km分辨率,并且空间上配准使其与气候插值数据逐像素精确对应。
图1
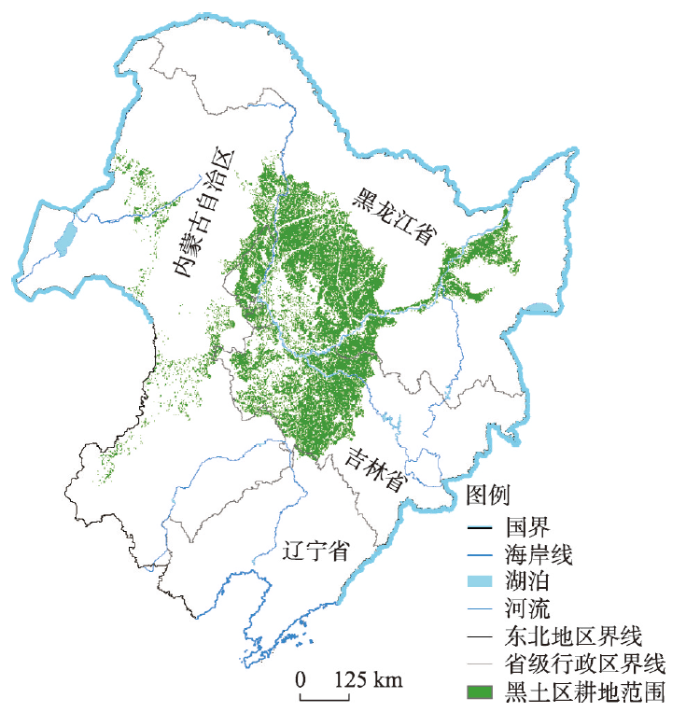
图1
东北黑土区耕地空间分布
Fig. 1
Spatial distribution of crop planting area in the black soil region of Northeast China
2.3 研究方法
2.3.1 作物物候提取
基于EVI累积曲线的四参数Logistic函数拟合曲线曲率求导法提取黑土区作物生长季开始期(SOS)和结束期(EOS),该方法能够有效克服环境干扰(如干旱、虫灾)引起的植被物候异常[42]。为了尽可能消除初春或秋冬季节降雪、降雨对EVI曲线的干扰,根据东北单季作物生长规律,确定4月初(第13期影像)至10月底(第38期影像)为作物生长时段,开展生长季开始期与结束期提取。为了进一步消除生长季初期环境因素的干扰,采用作物生长时段最大EVI值之前的最小EVI值代替该最小值之前的原始EVI值。具体计算如下:
式中:t表示8 d间隔的日期;
2.3.2 作物物候气候滞后效应
农业作物生长活动不仅与气候因素有关,也受到诸如作物品种更新、施肥、灌溉等人类活动的强烈干扰。本文采用差分法来辨识作物生长季开始期、结束期与气候因子的关系,该方法能够尽可能消除长期人类活动的影响,为定量辨识气候变化的影响提供了一种可靠途径[43]。具体计算如下:
首先对作物物候指标与气候因素数据分别进行差分(即未来年与当年之差值),重新生成作物物候指标与气候因素数据时间序列,然后对新生成的数据序列进行相关分析。
式中:xi为作物SOS/EOS差分数据;Tj为滞后月数;y为气候因素(平均气温、平均最高/最低气温、降水量)在滞后月数Tj内均值的差分数据;
2.3.3 作物生产力气候影响
EVI可以表征植被的光合能力,并与总初级生产力(GPP)等植被生产力具有较好的相关性。故本文将作物生产力定义为生长季内EVI的平均值,生长季长度由研究区平均生长季开始期和结束期所在月份确定。采用多元线性回归分析方法探讨气候因素及SOS、EOS对作物生产力的影响程度。具体如下:
式中:
2.3.4 不同温升目标下粮食生产风险评估
式中:
本文以校正后的未来时段粮食总产量相对于基准时段的变化程度作为粮食生产风险的评价指标。具体计算如下:
式中:Q表示未来粮食产量的变化程度;Yt为未来t时段(1.5 ℃和2.0 ℃)的粮食产量;Y0为基准期的粮食产量。
结合农业部门和应急部门减灾活动要求,粮食产量减产2%的年份定义为歉年,减产5%的年份定义为灾年,本文以此作为未来粮食生产风险评价的临界值[48],具体表达为:
此外,针对未来粮食总产量增加部分(即Q ≥ 1),应用标准差法进一步划分等级,以便精准地揭示未来粮食生产的区域分异特征。具体划分标准如下:
式中:
2.3.5 不同温升目标下干旱危险性评估
采用吴绍洪等[49]提出的干旱事件危险性评估方法,基于综合气象干旱指数计算全球温升1.5 ℃和2.0 ℃时段东北黑土区干旱危险性指数,预估未来干旱事件对东北黑土区粮食生产的潜在影响。具体计算如下:
首先,根据综合气象干旱指数值的大小将其划分为3个等级,轻度干旱、中度干旱和重度干旱。再以综合气象干旱指数连续10 d达到轻度干旱(中度干旱或重度干旱)以上等级记为一次轻度干旱(中度干旱或重度干旱)过程,计算不同等级干旱发生的频率:
式中:
3 结果分析
3.1 气候变化特征与物候动态
2000—2017年东北黑土区年平均气温波动起伏明显,其中2000—2007年平均气温逐渐上升,2008—2011年波动下降,而2012之后又再次上升,速率约为0.24 ℃/a(P = 0.11)。相比而言,2000—2017年该区降水量呈现显著增加态势,增加速率为8.28 mm/a(P = 0.02),但在2012年后明显减少(图2a)。2000—2017年东北黑土区各季节气候变化与年均变化规律整体较为一致,但也存在阶段性差异,主要表现为2012—2017年春季最高气温、最低气温和年均气温上升较快,秋季最高气温、最低气温和年均气温下降明显(图2b~2d)。从空间格局上,2000—2017年东北黑土区约59.57%的面积年降水量呈显著增加趋势,其中,年降水量增加较快(≥ 9 mm/a)的区域约占总面积的30.23%,主要分布于松嫩黑土亚区的齐齐哈尔、绥化、白城、长春等地以及三江黑土亚区的北部。全区近52.07%的面积年均气温呈波动下降态势,主要集中在松嫩黑土亚区的北部、中部和东部地区(图3)。
图2
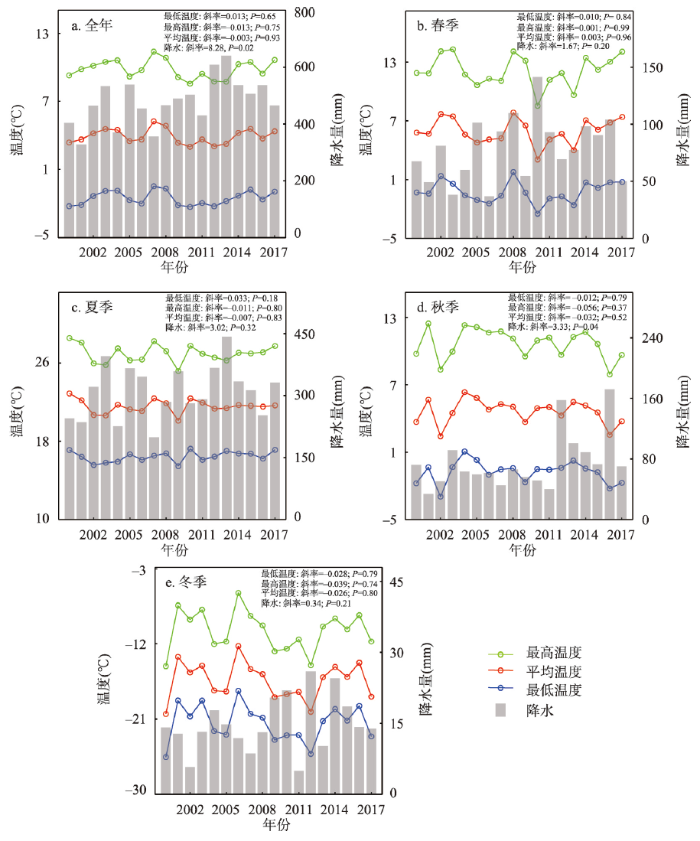
图2
2000—2017年东北黑土区全年与季节气候变化特征
Fig. 2
Trend of annual and seasonal average temperature and precipitation in the black soil region of Northeast China during 2000-2017
图3
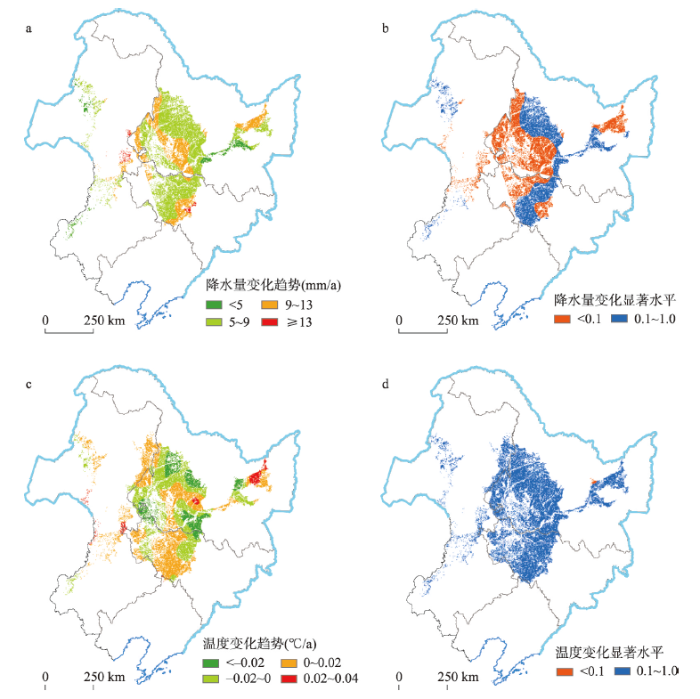
图3
2000—2017年东北黑土区全年气候变化空间格局
Fig. 3
Spatial variation trend of annual average temperature and precipitation in the black soil region of Northeast China during 2000-2017
由图4可知,东北黑土区作物生长季开始期平均在第147天(5月27日),生长季结束期为第265天(9月25日)。东北3省79个农业气象观测资料显示,东北农业区主要种植作物出苗期和成熟期分别在5月12日、在9月19日左右,这与本文吻合[50]。东北松嫩黑土亚区北部、东部和三江黑土亚区作物生长季开始期主要集中在第150—160天,结束期一般早于第270天,而松嫩黑土亚区西南部和蒙东黑土亚区等地作物生长季开始期较早,结束期稍晚(图4a、4b)。近年来东北黑土区作物生长季开始期与结束期变化空间异质性明显,约68.25%的面积生长季开始期呈现延后态势,其中43.60%的区域生长季开始期延后趋势显著(P < 0.10),集中分布在齐齐哈尔、绥化、哈尔滨中北部地区及白城西部和松原东北部地区,而8.01%的黑土区作物生长季开始期呈显著的提前趋势,零星分布在东南、西北地区(图4c、4d)。相比而言,全区约58.36%(显著区约占全区总面积的16.71%)的面积作物生长季结束期呈提前态势,尤其在松嫩黑土亚区的白城、松原、四平和长春等地,提前速率可达0.4 d/a。相反黑土区东北部作物生长季结束期延后现象十分明显,约占总面积的8.95%(图4e、4f)。
图4
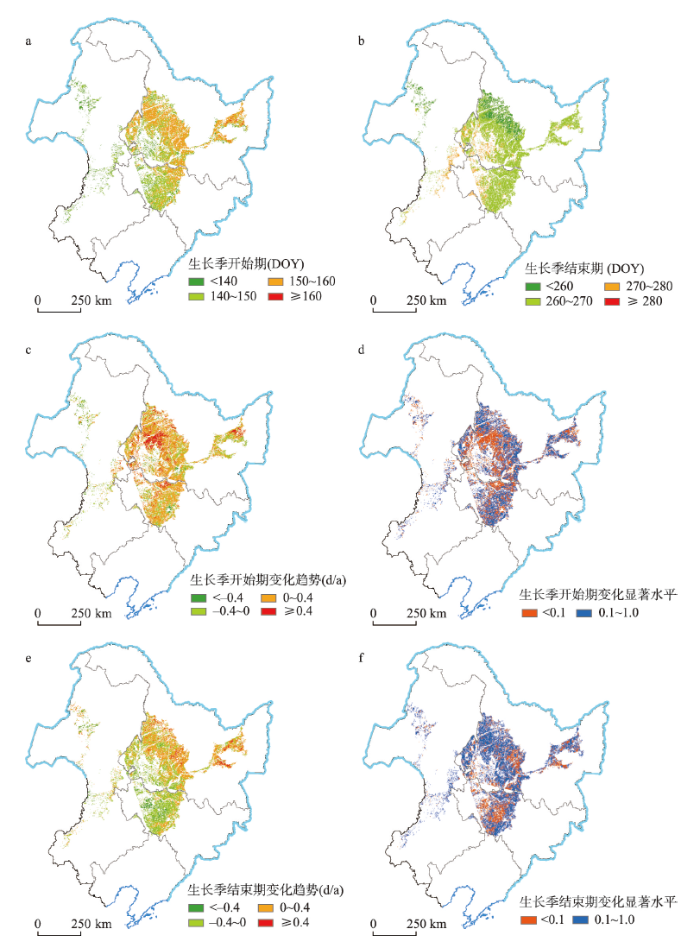
图4
2000—2017年东北黑土区作物生长季开始与结束期趋势空间特征
Fig. 4
Spatial variation of mean annual SOS and EOS, and their stability and trend in the black soil region of Northeast China during 2000-2017
3.2 物候滞后效应及两者对生产力的综合影响
东北黑土区作物生长季开始期对气候变化的滞后效应明显,且空间异质性较强(图5)。总体上,松嫩黑土亚区北部边缘以及中南部地区作物生长季开始期与T2、T3时段降水量呈显著的正相关关系,齐齐哈尔、绥化中部黑土区和三江黑土亚区作物生长季开始期与T1时段降水量呈显著正相关关系,但蒙东黑土区作物生长季开始期与T2、T3时段降水量大体呈负相关关系(图5a、5b)。平均气温与三江黑土亚区和松嫩黑土亚区的北部、南部作物生长季开始期呈显著负相关关系,但三江黑土亚区滞后时间集中在T0和T1时段,而松嫩黑土亚区多集中在T2、T3时段。蒙东黑土亚区和松嫩黑土亚区中部作物生长季开始期与平均气温呈正相关关系,部分地区相关关系显著(图5c、5d)。作物生长季开始期对最低气温和最高气温的响应规律与其对平均气温的响应特征基本一致,但松嫩黑土亚区西北部、蒙东黑土区T0时段最低气温与作物生长季开始期多呈负相关关系(图5e~5h)。
图5
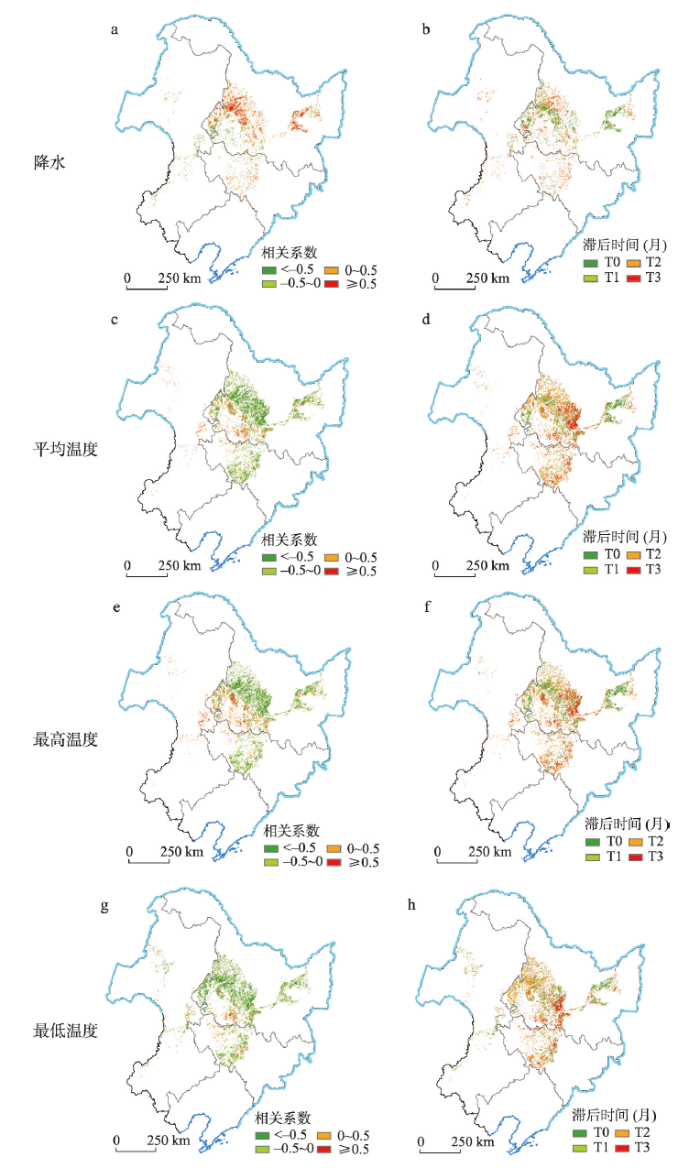
图5
2000—2017年东北黑土区作物生长季开始期气候滞后效应空间格局
Fig. 5
Spatial distribution of significant lag responses of SOS to climate variables in the black soil region of Northeast China during 2000-2017
由图6可知,三江黑土亚区西部、松嫩黑土亚区北部以及中部和蒙东黑土亚区作物生长季结束期与降水量呈正相关关系,但滞后时间由T3时段提前至T0和T1时段,而松嫩黑土亚区南部作物生长季结束期与T3时段降水量呈负相关关系(图6a、6b)。就气温而言,从东北向西南,东北黑土区平均气温、最高气温与作物生长季结束期之间关系逐渐由负相关转变为正相关,滞后时间由T3时段转变为T2时段,而最低气温变化与作物生长季结束期的相关关系空间差异性更加明显,主要表现为松嫩黑土亚区中部及三江黑土亚区作物生长季结束期与T3时段最低气温负相关,而松嫩黑土亚区北部、南部以及蒙东黑土亚区作物生长季结束期与最低气温正相关,滞后时间主要集中在T0和T1时段(图6c~6h)。
图6
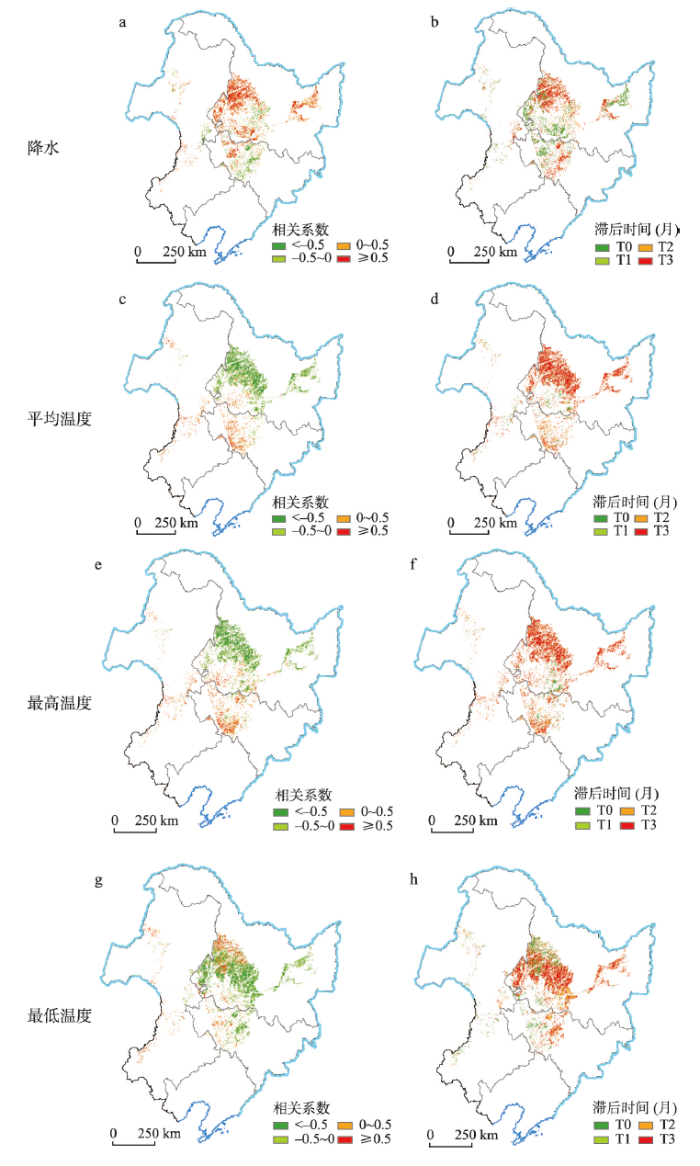
图6
2000—2017年东北黑土区作物生长季结束期气候滞后效应空间格局
Fig. 6
Spatial distribution of significant lag responses of EOS to climate variables in the black soil region of Northeast China during 2000-2017
如图7所示,气候变化与作物物候期对东北黑土区作物生产力的解释能力空间异质性较强。总体上,约57.69%的区域生长期气候变化与作物物候变动能够显著解释作物生产力变化,解释能力在50%~80%、80%以上的面积分别占总面积的39.77%和17.92%,主要分布在松原—绥化线以西的松嫩黑土亚区以及三江黑土亚区等地(图7a、7b)。单一生长季同期气候变化对作物生产力的解释面积仅为总面积的31.18%,集中分布在白城、松原、大庆、齐齐哈尔南部等松嫩黑土亚区以及蒙东黑土亚区东南部,且解释能力在50%~80%、80%以上的面积分别减少了41.90%和95.20%(图7c、7d)。相比于同期气候变化的影响,T1时段的气候变化对黑土区作物生产力的解释能力无明显改变,解释面积减少了约0.52%(图7e、7f)。
图7
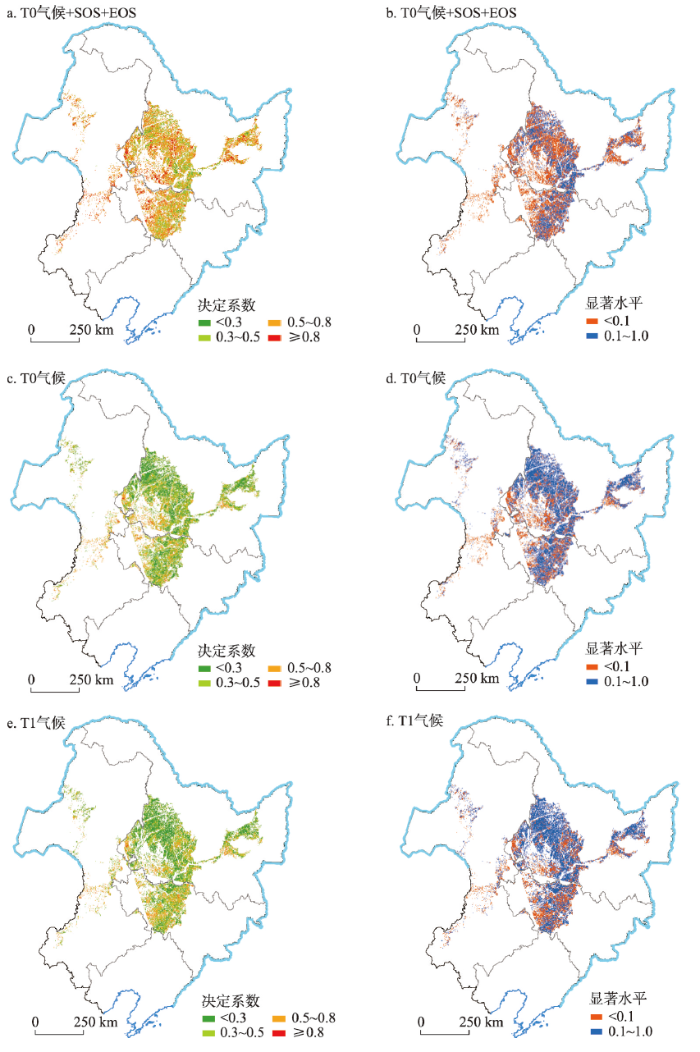
图7
2000—2017年东北黑土区作物生产力气候与物候解释能力空间格局特征
Fig. 7
Spatial distribution of determination coefficient of vegetation productivity, and climatic variables, SOS, EOS in the black soil region of Northeast China from 2000 to 2017
3.3 不同温升目标下未来气候变化风险评估
基于县区历史粮食总产量和土地利用数据校正的东北黑土区粮食生产模拟结果显示,1991—2010年东北黑土区年平均粮食总产量约为5400万t,高产区主要集中在三江黑土亚区中部、松嫩黑土亚区东部和西部(图8a)。
图8
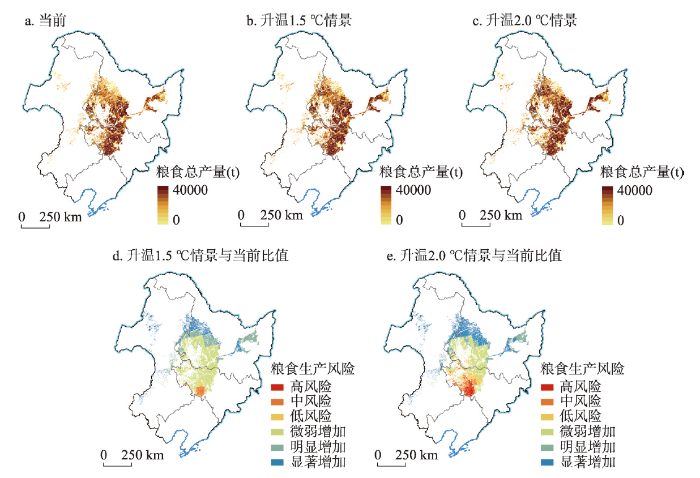
图8
东北黑土区不同温升时段粮食总产量和粮食生产风险空间分布
Fig. 8
Spatial distribution of total grain yield and grain production risk in the black soil region of Northeast China
RCP8.5情景下,全球温升1.5 ℃时,东北黑土区年平均粮食总产量将超过6000万t,粮食产量空间分布与当前时段基本相同(图8b)。与当前时段相比,全球温升1.5 ℃时东北黑土区粮食产量变化呈现“南减北增”变化特征,其中蒙东黑土亚区、松嫩黑土亚区北部和三江黑土亚区西部粮食产量增加明显,粮食生产风险区主要分布在松嫩黑土亚区的南部边缘,粮食减产量最高接近5%(图8d)。全球温升2.0 ℃时,东北黑土区年平均粮食总产量将超过6700万t,相较于温升1.5 ℃和当前时段分别增加约7%和24%,粮食产量空间分布与当前时段基本一致(图8c)。与当前时段相比,全球温升2.0 ℃时东北黑土区粮食产量变化的“南减北增”分布格局更加明显,蒙东黑土亚区、松嫩黑土亚区北部和三江黑土亚区西部增产面积明显扩大,松嫩黑土亚区的南部边缘粮食生产呈高风险,粮食减产量最高接近10%,中风险区扩大到松花江以南的大部分地区(图8e)。
图9
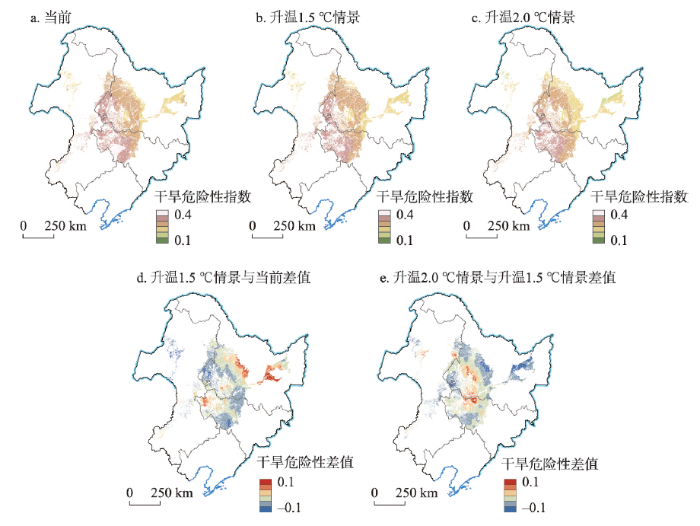
图9
东北黑土区不同温升时段干旱危险性及其变化差值空间分布
Fig. 9
Spatial distribution of drought hazard and variation in the black soil region of Northeast China
RCP8.5情景下,全球温升1.5 ℃时,东北黑土区干旱危险性指数分布与当前时段基本一致(图9b)。与当前时段相比,全球温升1.5 ℃时,松嫩黑土亚区中西部地区的危险性指数明显增大,松嫩黑土亚区西南部和西北部、蒙东黑土亚区东南部的危险指数明显减小;三江黑土亚区中西部、松嫩黑土亚区东北部的危险性指数增大,蒙东黑土亚区北部的危险性指数减小(图9d)。全球温升2.0 ℃时,东北黑土区干旱危险性指数总体分布格局与之前两个时段基本相同(图9c)。相对于温升1.5 ℃时段,全球温升2.0 ℃时,松嫩黑土亚区中部地区的危险性指数明显增大,松嫩黑土亚区中西部的危险指数减小;蒙东黑土亚区北部的危险性指数增大,三江黑土亚区、松嫩黑土亚区东北部的危险性指数明显减小(图9e)。
4 讨论
4.1 气候变化背景下作物生长的气候响应特征
2000—2011年东北黑土区平均气温波动起伏剧烈,表现出全球陆地较为一致的变暖停滞现象,之后再次快速升温,气温变化率超过了西北地区2012—2019年的平均水平(0.10 ℃/a)[52],该区2012年后年降水量出现显著减少现象,暖干化态势值得高度关注。随着气候暖干化,全区约三成的面积作物生长季开始期延后趋势显著(P < 0.10),仅8.01%的区域作物生长季开始期呈显著的提前趋势。研究表明北半球植被生长季开始期由2000—2008年仅提前了0.2 d,较1982—1999年减少了约92.31%[53],华北冬小麦生长季开始期在1999—2013年表现出明显的延迟现象,延迟幅度约4.3 d/10a[54],这与本文结果较为一致。东北黑土区北部和南部大部分地区作物生长季开始期与前期降水量呈正相关关系,与前期平均气温、最高气温、最低气温呈负相关关系,这与该区水热资源状况及变化态势有关。东北地区平均气温较低,降水量自西北向东南呈弧形条带状递减,蒙东、吉林西部和黑龙江西南部地区降水量较少[55],在寒冷但降水量相对丰富的北部和南部黑土区,前期气温上升促进生长季提前,而前期降水量增多将在一定程度上导致日照强度减小、气温下降,进而引起生长季延迟[56]。相反,在降水量相对较小的蒙东、吉林西部和黑龙江西南部地区,前期升温可能引发干旱,抑制作物生长[57]。2000—2017年东北黑土区约58.36%的面积作物生长季结束期呈提前态势,这与前人研究有别,可能与研究时段有关[58]。Yang等指出与20世纪80年代相比,21世纪初中国北方植物生长结束期延迟趋势减弱,部分地区呈现结束期提前趋势[59]。作物生长季结束期与前期降水量和气温呈现出相负相关特征,体现出气候变化敏感区水分有效性与气温对作物生长的交互影响,而黑土区北部作物生长季结束期与最低气温的正相关关系可能与低温胁迫有关[60]。
气候资源条件的变化对农作物生产具有重要的影响。研究显示与20世纪80年代相比,20世纪90年代气候变暖对黑龙江省水稻增产的贡献率为23.2%~28.8%[61],气候变暖对松嫩平原玉米增产的贡献率为26.78%[62]。在华北平原,近30年来气候变量对玉米产量的总体贡献率约为15%~30%[63]。本文发现生长季气候变化对东北黑土区农业生产的平均解释能力约为36.31%,与上述研究基本一致,两者间差异可能与研究时段及区域范围有关。植被生长季开始期及结束期作为植被生长发育的重要节点,既受气候变化的影响,又对植被生理过程与光合生产能力产生重要作用[32]。气候变化和关键物候期协同考虑能够有效提高东北黑土区作物生产力的解释能力,两者解释能力较单一考虑生长季气候变化的解释能力增加了70.23%,解释面积扩大了85.04%,可为建立大尺度作物产量估算模型提供一种有效途径。
4.2 未来粮食生产风险预估与应对策略
过去几十年间,随着区域气候资源条件改变,东北黑土区水稻、小麦、玉米等主要粮食作物的种植面积和产量均呈现增加趋势[29,64]。本文基于“气候变化—粮食生产—未来风险”的视角,采用渐变事件气候变化风险评估方法[45],同时引入δ插值方法校正粮食产量模拟结果,建立高精度粮食生产风险评估模型,综合揭示东北黑土区不同温升情景下粮食生产的演变特征。该方法相比过去研究采用的趋势分析和相关分析方法具有含义明确、可信度高、可操作性强的特点,且综合考虑1.5 ℃和2.0 ℃的全球升温情景,对辨识未来东北黑土区粮食产量面临的可能风险更具指导价值[65-66]。东北黑土区水稻、小麦、玉米等主要粮食作物种植范围分布不均衡,水稻种植主要集中在松嫩黑土亚区中东部和三江黑土亚区,小麦主要散布在松嫩黑土亚区北部和蒙东黑土亚区北部,玉米种植范围基本覆盖东北黑土区。在暖湿化趋势的影响下,水稻和小麦产量呈现平稳或小幅增加的可能性较大,玉米减产量和减产范围随温升不断扩大,尤其在种植密集的松嫩黑土亚区,该区域干旱危险性指数大,且未来部分地区危险性指数持续增加,气候变化趋势性和极端事件突发性可能会对玉米生产造成更为不利的影响。未来应进一步加强农业气候资源监测,明确区域气候变化及其相关极端天气气候事件的变化特征,加强农业基础设施建设,大力发展韧弹性农业,全面提升未来气候变化应对能力。
综上,本文基于气候资料、遥感产品和产量预估数据,较为全面地阐述了气候变化下东北黑土区作物生产的响应特征及未来潜在风险,但结果仍然存在一定的不确定性。首先,尽管利用两期土地利用数据掩膜去消除土地利用变化的干扰,但土地利用类型年际间变化及混合像元的可能影响无法避免。其次,采用基于MODIS反射率产品计算并验证的EVI反演产品,该数据时空分辨率尤其是时间分辨率较高,在精准刻画东北黑土区作物物候特征方面具有一定优势,但数据时间序列长度有限。此外,由于全球气候模式及作物模型本身会导致未来粮食预估结果的不确定性,多模式集合研究有待加强,且应充分考虑作物品种、种植模式以及灌溉施肥等农业管理对未来粮食生产的影响,建立应对气候变化的适应技术体系,确保粮食供给。
5 结论
本文基于气候变化—物候响应—生产力动态—风险评估的全链条工作思路,探究了东北黑土区气候变化对农业生产的级联效应以及未来粮食生产风险的演变特征,得到以下结论:① 2000—2017年东北黑土区降水量呈现显著增加态势,但年均气温在2000—2011年表现出与全球陆地一致的变暖停滞现象。黑土区作物生长季开始期延后、结束期提前趋势明显,生长季开始期多与前期降水量呈正相关关系,与前期平均气温呈负相关关系,且生长季开始期对气温的滞后时间更长;生长季结束期与前期气候变化关系更加密切,且从南向北分异明显。② 生长季同期气候变化对东北黑土区作物生产力的解释能力有限,而气候变化和关键物候期协同考虑能够有效提高作物生产力的解释程度,可作为作物产量预测的重要依据。③ 未来RCP8.5情景下东北黑土区粮食总产量呈现上升趋势,粮食生产风险呈“南增北减”的演变特征,风险区面积不断扩大,全球升温2.0 ℃时,松嫩黑土亚区南部粮食减产量最高接近10%。为此,亟需研发区域性气候变化适应技术,保障粮食生产安全。
参考文献
The impact of climate change on the productivity of conservation agriculture
Global socioeconomic exposure of heat extremes under climate change
Global exposure and vulnerability to multi-sector development and climate change hotspots
Responses of crop growth and water productivity to climate change and agricultural water-saving in arid region
A multi-model assessment of food security implications of climate change mitigation
Global wheat production with 1.5 and 2.0 °C above pre-industrial warming
Climate change has likely already affected global food production
Variation in the global-scale impacts of climate change on crop productivity due to climate model uncertainty and adaptation
Economic impacts of climate change on agriculture: The AgMIP approach
Temperature increase reduces global yields of major crops in four independent estimates
Global and regional impacts of climate change at different levels of global temperature increase
DOI:10.1007/s10584-019-02464-z
[本文引用: 1]

The assessment of the impacts of climate change at different levels of global warming helps inform national and international policy discussion around mitigation targets. This paper provides consistent estimates of global and regional impacts and risks at increases in global mean temperature up to 5 degrees C above pre-industrial levels, for over 30 indicators representing temperature extremes and heatwaves, hydrological change, floods and droughts and proxies for impacts on crop yields. At the global scale, all the impacts that could plausibly be either adverse or beneficial are adverse, and impacts and risks increase with temperature change. For example, the global average chance of a major heatwave increases from 5% in 1981-2010 to 28% at 1.5 degrees C and 92% at 4 degrees C, of an agricultural drought increases from 9 to 24% at 1.5 degrees C and 61% at 4 degrees C, and of the 50-year return period river flood increases from 2 to 2.4% at 1.5 degrees C and 5.4% at 4 degrees C. The chance of a damaging hot spell for maize increases from 5 to 50% at 4 degrees C, whilst the chance for rice rises from 27 to 46%. There is considerable uncertainty around these central estimates, and impacts and risks vary between regions. Some impacts-for example heatwaves-increase rapidly as temperature increases, whilst others show more linear responses. The paper presents estimates of the risk of impacts exceeding specific targets and demonstrates that these estimates are sensitive to the thresholds used.
Quantifying maize grain yield losses caused by climate change based on extensive field data across China
Similar estimates of temperature impacts on global wheat yield by three independent methods
Crop yield sensitivity of global major agricultural countries to droughts and the projected changes in the future
Divergent global precipitation changes induced by natural versus anthropogenic forcing
Assessing agricultural risks of climate change in the 21st century in a global gridded crop model intercomparison
Climate-driven crop yield and yield variability and climate change impacts on the U.S. Great Plains agricultural production
CERES-Maize model-based simulation of climate change impacts on maize yields and potential adaptive measures in Heilongjiang Province, China
Food supply and food safety issues in China
Alfalfa-corn rotation and row placement affects yield, water use, and economic returns in Northeast China
Straw return with reduced nitrogen fertilizer maintained maize high yield in northeast China
Chemical fertilizers could be completely replaced by manure to maintain high maize yield and soil organic carbon (SOC) when SOC reaches a threshold in the Northeast China Plain
Soil loss and conservation in the black soil region of Northeast China: A retrospective study
Exploring management strategies to improve maize yield and nitrogen use efficiency in northeast China using the DNDC and DSSAT models
Characteristics of agricultural climate resources in three provinces of Northeast China under global climate change
Based on the 1961-2007 weather data from 72 meteorological stations in three provinces of Northeast China, the change characteristics of agricultural climatic factors including yearly and temperature-defined growing season's mean air temperature, > or =10 degrees C accumulated temperature, precipitation, reference evapotranspiration, and sunshine hours were analyzed. In 1961-2007, the yearly mean air temperature in the three provinces had an increasing trend, with a rate of 0.38 degrees C x 10 a(-1). The > or =10 degrees C accumulated temperature in temperature-defined growing season also had an increasing trend, and the border of > or =10 degrees C accumulated temperature belt moved northward and eastward. The area of > or =3200 degrees C x d accumulated temperature increased by 2.2 x 10(4) km2. The belt of 2800-3200 degrees C x d moved northward about 0.85 degrees and eastward about 0.67 degrees, while that of 2400-2800 degrees C x d moved northward about 1.1 degrees. The sunshine hours decreased significantly, especially in the east part of Songnen Plain, central and west plains of Jilin Province, and west part of Liaohe River Plain. The area with sunshine hours > 2800 h decreased from 13.6 x 10(4) km2 to 4. 1 x 10(4) km2, and the zone with sunshine hours 2600-2800 h moved westward about 1.5 degrees. The average sunshine hour in temperature-defined growing season was 1174 h. Comparing with that in 1961-1980, the region with more sunshine hours in temperature-defined growing season in 1981-2007 narrowed significantly, and the zone with sunshine hours 1200-1400 h moved westward about 0.9 degrees. In 1961-2007, both the yearly and the temperature-defined growing season's precipitation decreased, and the yearly reference evapotranspiration increased in Heilongjiang Province and in the eastern mountain areas of Jilin Province but decreased in the central and west plains of Jilin Province and in Liaoning Province. Comparing with that in 1961-1980, the zone of reference evapotranspiration with the value of > or =900 mm in 1981-2007 moved westward about 1 degree, and the reference evapotranspiration in temperature-defined growing season increased in most regions of Heilongjiang and Jilin Province but decreased in a rate of 0-14 mm x 10 a(-1) in most regions of Liaoning Province.
气候变化背景下我国东北三省农业气候资源变化特征
Climate-associated rice yield change in the Northeast China Plain: A simulation analysis based on CMIP5 multi-model ensemble projection
DOI:10.1016/j.scitotenv.2019.01.415
[本文引用: 2]
Multi-model ensemble climate projections in combination with crop models are increasingly used to assess the impact of future climate change on agricultural systems. In this study, we used a biophysical process-oriented CERES-Rice crop model driven by downscaled future climate data from 28 Global Climate Models (GCMs) under two emissions scenarios: representative concentration pathway (RCP) 4.5 and RCP8.5, for phase five of the Coupled Model Intercomparison Project (CMIP5) to project the effects of climate change on rice yields in three future time periods in the Northeast China Plain (NECP). The results showed that without consideration of CO2 effects, rice yield would increase by 1.3%, 1.3%, and 0.4% in the 2030s, 2060s, and 2090s, respectively, under the RCP4.5 scenario. Rice yield would change by +1.1%, -2.3%, and -10.7% in the 2030s, 2060s, and 2090s, respectively, under the RCP8.5 scenario. With consideration of CO2 effects, rice yield during the 2030s, 2060s, and 2090s would increase by 5400, 10.0%, and 11.6% under RCP4.5, and by 6.4%, 12.9%, and 15.6% under RCP8.5, respectively. The rice-growing season would be shortened by 2 to 5 weeks in the future. Overall, the future climate would have positive effects on rice yields in the NECP. Although uncertainties in our study on the impact of climate change on rice might arise from the choice of crop model and GCMs, the results are important for informing policy makers and developing appropriate strategies to improve rice productivity in China. (C) 2019 Elsevier B.V.
Mean states and future projections of precipitation over the monsoon transitional zone in China in CMIP5 and CMIP6 models
Impact of global warming on meteorological drought: A case study of the Songliao Plain, China
Spatial distribution of maize in response to climate change in Northeast China during 1980-2010
Increasing maize yields in Northeast China are more closely associated with changes in crop timing than with climate warming
Impacts of future climate change on agroclimatic resources in Northeast China
Mapping spatiotemporal changes in vegetation growth peak and the response to climate and spring phenology over northeast China
Yield gap simulations using ten maize cultivars commonly planted in Northeast China during the past five decades
Potential impacts of climate change and adaptation on maize in northeast China
Trends and climate response in the phenology of crops in northeast China
Quantitative assessment and spatial characteristic analysis of agricultural drought risk in China
The 10 m crop type maps in Northeast China during 2017-2019
Delineating the black soil region and typical black soil region of northeastern China
东北黑土区和东北典型黑土区的范围与划界
A global moderate resolution dataset of gross primary production of vegetation for 2000-2016
Untangling relative contributions of recent climate and CO2 trends to national cereal production in China
Different uncertainty distribution between high and low latitudes in modelling warming impacts on wheat
Land surface phenology of China's temperate ecosystems over 1999-2013: Spatial-temporal patterns, interaction effects, covariation with climate and implications for productivity
Winter wheat green-up date variation and its diverse response on the hydrothermal conditions over the North China Plain, using MODIS time-series data
Differential climate impacts for policy-relevant limits to global warming: The case of 1.5 ℃ and 2 ℃
Integrate risk from climate change in China under global warming of 1.5 and 2.0 °C
Identifying the spatiotemporal changes of annual harvesting areas for three staple crops in China by integrating multi-data sources
A comparison of delta change and downscaled GCM scenarios for three mountainous basins in the United States
Geographical distribution of China's grain yield risk area
中国粮食产量不同风险类型的地理分布
Geographical patterns and environmental change risks in terrestrial areas of the Belt and Road
DOI:10.11821/dlxb201807003
[本文引用: 1]
Construction of the Belt and Road, an advocacy of China to promote win-win international cooperation in the new era, aims at building green, healthy, intellectual and peaceful Silk Road and ensuring joint development with the people of the countries along the Belt and Road. Systematic analysis on environmental characteristics, evolutionary tendency and future risk pattern is a scientific fundamental of sustainable development for the construction. Based on remote sensing monitoring and statistical analysis, this paper studies spatial-temporal characteristics of climate, topography, soil, hydrology, vegetation cover and production of terrestrial ecosystems. Taking the methodology of the classical integrated natural regionalization, the region is delineated into 9 sub-regions: Central and Eastern Europe, Mongolia and Russia, Central and Western Asia, Southeastern Asia, Pakistan, Bangladesh-India-Myanmar, Eastern China, Northwestern China and Tibetan Plateau. By combining modeling simulation with scenario projections, natural disaster assessment methodology is used to assess the risk of abrupt extreme events such as heat waves, droughts and floods in the next 30 years. And trend-baseline comparison method is applied to assess the risk of gradual change events in macro-ecosystems, food production, etc. Results show that, on the basis of the regional framework, the western Eurasia would show a warming trend; both sides of Tibetan Plateau are in high temperature and heat waves risk; cold-wet region of central and eastern Europe in high drought risk; monsoon area of Bangladesh, India and Myanmar as well as eastern China in high risk of flooding; the desert margin areas in high ecological fragile risk; the middle and low latitude areas in high risk of grain production.
“一带一路”陆域地理格局与环境变化风险
DOI:10.11821/dlxb201807003
[本文引用: 1]
“一带一路”建设是中国在新时期推动国际合作共赢的倡议,旨在打造绿色、健康、智力、和平丝绸之路,保障“一带一路”沿线各国人民共同发展。系统分析“一带一路”沿线国家环境特征、演化趋势与未来风险格局,是“一带一路”建设的科学基础。应用遥感监测、统计资料,探究“一带一路”陆域气候、地形、土壤、水文、植被环境要素空间分布特征和时空差异;依据经典综合自然区划的方法论,将“一带一路”陆域划分为中东欧寒冷湿润区、蒙俄寒冷干旱区、中亚西亚干旱区、东南亚温暖湿润区、巴基斯坦干旱区、孟印缅温暖湿润区、中国东部季风区、中国西北干旱区和青藏高原区等9个区域。结合模型模拟、情景预估等技术手段,将自然灾害损失评估方法论用于预估未来30年高温热浪、干旱和洪涝等突发性极端事件的灾害风险,以趋势—基线对比方法预估宏观生态系统、粮食生产等渐变事件的风险。结果显示,亚欧大陆西部将是暖干趋势;青藏高原两侧区域高温热浪高风险;中东欧寒冷湿润区东部干旱高风险;孟印缅温暖湿润区和中国东部季风区洪涝高风险;荒漠边缘区域为生态脆弱高风险区;中低纬区域为粮食减产高风险区。
Identification and application of seasonality parameters of crop growing season in northeast China based on NDVI time series data
基于时序植被指数的东北地区耕地生长季特征识别与应用研究
Hazards of extreme events in China under different global warming targets
Characteristics of warming hiatus of the climate change in Northwest China from 1960 to 2019
DOI:10.11821/dlxb202009003
[本文引用: 1]
The mean global surface air temperature data indicate that there might be a global warming hiatus during 1998-2012. However, whether it existed around the world is still controversial, and the characteristics of the hiatus in Northwest China remain unclear. Based on the in-situ observation data of air temperature from 1960 to 2019, we analyzed the characteristic of hiatus in Northwest China through the cumulative anomaly curve, the Mann-Kendall test, Move-t test, the Yamamoto test and the linear trend estimation. The results showed that the statistically significant change-point of the annual mean air temperature in Northwest China was in 1986, 1996, and 2012, respectively. The air temperature suddenly rose in 1996, and then kept stable from 1998 to 2012. The annual mean air temperature showed an obvious cooling trend by -0.20 ℃ decade-1 in Northwest China from 1998 to 2012. Meanwhile, the annual mean air temperature in winter had the largest decrease rate and that of summer increased. The east of Northwest China displayed the most significant cooling during 1998-2012, and the Tibetan Plateau was still heating up at the same time. The air temperature of Northwest China rose substantially after 2012, especially in winter, and southern Xinjiang experienced the strongest warming during 2012-2019. Generally speaking, the warming hiatus was evident in Northwest China during 1998-2012 except the Tibetan Plateau. Therefore, more attention should be paid to the marked upward trend in air temperature after the hiatus in Northwest China due to the crucial environment.
1960-2019年西北地区气候变化中的Hiatus现象及特征
DOI:10.11821/dlxb202009003
[本文引用: 1]
1998—2012年全球地表平均温度发生变暖停滞(Hiatus),然而Hiatus现象是否在全球各地均存在尚有争议,其在西北地区的表现及特征缺乏深入研究。本文基于1960—2019年气温地面观测数据,利用累积距平曲线、Mann-Kendall突变检验、滑动t检验及Yamamoto检验进行气候突变分析,结合线性倾向估计进行气候变化趋势分析,对西北地区气候变化中的Hiatus现象及其特征进行了探讨。结果表明:① 西北地区年均气温在1986年、1996年和2012年分别突变,1996年突变升温后在1998—2012年间保持高位震荡;② 1998—2012年间西北地区年均温变化率为-0.20 ℃/10a,呈现明显Hiatus现象,分季节看,冬季降温幅度最大,夏季仍保持升温,春季均温比秋、冬季提前1年开始和结束停滞期,从空间上看,西北地区东南部降温最显著,青藏高原不存在Hiatus;③ 2012年Hiatus结束后西北地区气温普遍快速升高,季节上以冬季升温最快,空间上以南疆升温最快。综合来看,1998—2012年的Hiatus现象在除青藏高原外的西北地区表现明显,停滞后的快速升温值得高度关注。
Phenology shifts at start vs. end of growing season in temperate vegetation over the Northern Hemisphere for the period 1982-2008
Spring green-up date derived from GIMMS3g and SPOT-VGT NDVI of winter wheat cropland in the North China Plain
Spatiotemporal change patterns of temperature and precipitation in Northeast China from 1956 to 2017
1956-2017年东北地区气温和降水的时空变化特征
Precipitation impacts on vegetation spring phenology on the Tibetan Plateau
Leaf onset in the northern hemisphere triggered by daytime temperature
New perspective on spring vegetation phenology and global climate change based on Tibetan Plateau tree-ring data
Changes in autumn vegetation dormancy onset date and the climate controls across temperate ecosystems in China from 1982 to 2010
Asymmetric responses of the end of growing season to daily maximum and minimum temperatures on the Tibetan Plateau
Contribution of climate warming to rice yield in Heilongjiang Province
近20年气候变暖对黑龙江省水稻增产的贡献
Effects of climate change on yield of maize in maize zone of Songnen Plain in the past 40 years
近40年气候变化对松嫩平原玉米带单产的影响
Contributions of cultivar shift, management practice and climate change to maize yield in North China Plain in 1981-2009
Rice production and climate change in Northeast China: Evidence of adaptation through land use shifts
Assessing spatiotemporal variation of drought and its impact on maize yield in Northeast China
Assessing the impact of climate changes on the potential yields of maize and paddy rice in Northeast China by 2050
