

1 引言
土地资源人类活动适宜性评价旨在针对研究区域土地资源的特点和不同人类活动对土地资源的适应性需求,通过筛选评价指标和关键参数,建立评价方法及定量算式,按人类活动方式对土地资源进行适宜性等级划分,进而为合理安排各种人类活动的空间配置和发展规模提供科学依据。针对人类活动的土地资源适宜性研究成果虽不多见,但农业用地适宜性的研究工作早已开展[1-2]。20世纪30年代英国在开展土地利用调查的基础上,对农业用地适宜性进行了初步分析[3]。第二次世界大战以后,波兰和苏联等国家结合本国农业地域类型划分,也开展了与英国类似的农业用地适宜性评价工作[4]。20世纪80年代,中国借鉴国际经验,通过选择系列评价指标,在黄淮海平原进行了规模性的土地资源农、林、牧适宜性评价工作,取得了有重要影响的研究成果[5];之后近30年,中国成规模或有影响的土地资源农、林、牧适宜性评价成果已很少见到。
国内外关于建设用地尤其是城镇村居民用地或独立工业用地的土地资源适宜性评价工作曾长期滞后于农业,国外关于建设用地的土地资源适宜性评价案例中影响较大的首推开展于20世纪80年代后期和90年代初期的美国亚利桑那州希拉河上游地区的土地资源适宜性分析,该项目针对低密度住宅区、商业区、工业区、休闲区等4类目标用地设计了一个适宜性评价框架,选择了10个自然要素指标和9个社会经济要素指标,采用矩阵方法按网格对研究区域的土地适宜性进行了评价[6]。中国的评价工作开始于2008年的汶川地震灾后重建资源环境承载能力评价,评价的核心目标是筛选适宜建设用地,关键指标是地形高程和坡度,采用的方法是按地形高程和坡度分级组合规则筛选出适宜于被毁城镇和村庄重建的建设用地[7]。之后,该方法被广泛应用于31个省(直辖市、自治区)主体功能区规划后备建设用地规模估算[8⇓⇓-11],玉树地震、芦山地震、舟曲特大泥石流等国家灾后恢复重建灾民安置用地选择,以及不同尺度区域发展规划和城镇规划后备建设用地测算[12-13]。2017年国家发改委牵头开展的省级空间规划试点工作,将资源环境承载能力和国土空间开发适宜性评价作为空间规划的基础工作,其中,对土地资源原有建设用地适宜性评价方法做了因素扩展和模型改进,并增加了耕地适宜性评价内容[14-15]。该方法模型经福建省、贵州六盘水市空间规划试点实证检验后,思路方法被自然资源部发布的《资源环境承载能力和国土空间开发适宜性评价指南(试行)》采用[16]。
总体来说,国内外在土地资源农业用地适宜性和建设用地适宜性评价的关键方面取得了巨大进步,并在实践中得到了广泛应用,但就青藏高原而言,也存在诸如评价因素偏多、入选指标数据难获取、适用地域海拔偏低等不足,尤其通过地形高程和坡度分级组合判定适宜性等级的方法在原理上可行,但在基础数据精度、高程和坡度分级、适宜性等级判定等方面尚缺乏机理性专业论证。本文在继承已有研究成果的学术思想和框架思路基础上,针对青藏高原建设用地和耕地适宜性评价,选择随地形高程和坡度变化的关键参数建立定量评价模型,并以藏东南米林县为例开展实证研究。目的在于:为青藏高原土地资源建设用地和耕地适宜性评价工作的开展探寻简单适用的定量模型;通过细化地形高程分级和坡度分级,量化解析随地形高程和坡度变化的适宜性等级划分专业机理;通过对不同精度栅格单元的适宜性评价结果对比和与现状用地的适配性分析,认知基础数据精度不同导致的评价结果误差。
2 研究方法、地域及数据
人类生活和生产场所对土地资源的基本要求主要体现在地形是否平坦、空气中氧气含量是否充足、气温是否适宜、用水是否便利等方面,而这些条件往往与地形高程和坡度有着密切的关系[7,10]。随着地形高程的增大,大气压力将逐渐下降,空气会逐渐稀薄,气温会逐渐降低,对人类居住或生产活动的限制程度会越来越高;随着地形坡度的增大,不仅人类的生活和生产成本会增大,还会导致水土流失的加剧。因此,地形高程和坡度可被视作土地资源人类活动适宜性评价最关键的两个因素[15]。考虑到建设用地和耕地是青藏高原人类活动的主要场所和人口聚居地,也是人类活动对自然影响最剧烈的区域,评价方法模型构建和关键参数测算将主要围绕建设用地和耕地展开。
2.1 评价技术流程
(1)图件数据制备。涉及到的基础图件主要为DEM、土地利用和行政区划图等,不同来源的图件可能存在坐标体系、图形边界等不一致问题,需要进行坐标转换和图形修边处理,一般可以土地利用图为基准,对其它图件做配准处理,便于开展图形叠加分析。关键数据主要包括空气密度、气温随海拔变化的对应数值,土壤侵蚀随地形坡度变化的对应数值等。
图1
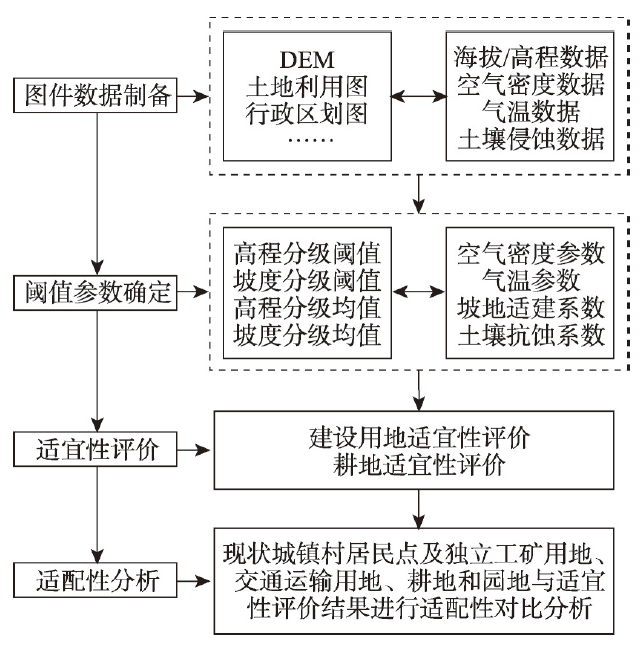
图1
土地资源人类活动适宜性评价技术流程
Fig. 1
Technical process framework for human activity suitability evaluation of land resources
(2)阈值参数确定。阈值主要是指对地形高程和坡度进行分级的界值。针对主体功能区规划、国土空间规划关于地形高程和坡度分级在青藏高原跨度大,不能有效反应其海拔高、起伏剧烈及垂直分异等特点,对青藏高原的地形高程和坡度按不同阈值进行细化分级。关键参数主要包括用于建设用地评价的空气密度参数、坡地适建系数和用于耕地评价的气温参数、坡地土壤抗蚀系数等。
(3)适宜性评价。采用由空气密度参数和坡地适建系数构成的定量算式,结合地形高程和坡度分级情况,对土地资源的建设用地适宜性进行研究区域全覆盖评价,并划分出等级类型;采用由气温参数和坡地土壤抗蚀系数构成的定量算式,结合地形高程和坡度分级情况,对土地资源的耕地适宜性进行研究区域全覆盖评价,并划分出等级类型。
(4)适配性分析。从土地利用现状图中提取并生成城镇村居民点用地、独立工矿用地、交通运输用地图层,通过与建设用地适宜性评价等级图进行叠加,分析现状各类建设用地在各适宜性等级类型的分异状况;从土地利用现状图中提取并生成耕地、园地图层,通过与耕地适宜性评价等级图进行叠加,分析现状耕地和园地在各适宜性等级类型的分异状况。
2.2 评价模型
(1)建设用地适宜性评价模型
借鉴国内已有建设用地适宜性评价成果采用地形高程与坡度交集筛选适宜建设用地的思路,将地形高程和坡度分别用与它们密切相关的空气密度参数和坡地适建系数代替,二者的乘积则可被用于定量评价土地资源建设用地适宜性,定量算式如下:
式中:HAB为土地资源建设用地适宜性特征值,简称适建指数;δTE为地形高程TE的空气密度参数;θTS为地形坡度TS的坡地适建系数。
(2)耕地适宜性评价模型
与建设用地适宜性评价模型的构建思路类似,将地形高程和坡度分别用与它们密切相关的气温参数和土壤抗蚀系数代替,二者的乘积则可被用于定量评价土地资源耕地适宜性,定量算式:
式中:HAP为土地资源耕地适宜性特征值,简称适耕指数;λTE为地形高程TE的气温参数;βTS为地形坡度TS的土壤抗蚀系数。
2.3 研究区概况
米林县地处西藏自治区东南部和雅鲁藏布江中下游,位于28º39′N~29º50′N、93º07′E~95º12′E,土地总面积约9500 km2。地势西高东低,北部为念青唐古拉山脉、南部为喜马拉雅山脉、中部为雅鲁藏布江谷地,境内海拔最低约2200 m,最高约7300 m,平均海拔约3700 m。属高原温带半湿润性季风气候,垂直地带性特征显著;年均气温8.2 ℃,年降水量641 mm,85%降水集中在6—9月份,无霜期170 d。动植物资源丰富,森林覆盖率48.11%,林木总蓄积量9150万m3。境内河流众多,雅鲁藏布江从西向东横贯全境,人类活动主要集中分布在雅鲁藏布江谷地及支流沿岸。
米林县下辖3镇5乡66个行政村,2020年常住人口2.62万人;2019年国内生产总值18.14亿元,一、二、三产业占比分别为9.43%、44.54%和46.03%,主要农作物有玉米、青稞、小麦、豌豆、苜蓿等;2020年城镇居民和农牧民人均可支配收入分别为3.3万元和1.97万元。米林县近5000 m的高差能体现出青藏高原整体的垂直地带性,城镇、农区、牧区等用地特点能反映青藏高原人类活动的空间类型及分布状况,适中的土地面积规模和大致呈东西向的空间分布形态有利于立地条件下评价方法模型的实证应用和栅格单元精度比较,以米林县作为案例地进行青藏高原土地资源人类活动适宜性评价方法及实证应用具有较强的代表性[17⇓-19]。
2.4 研究数据
本文中涉及的图件主要包括DEM、土地利用图和行政区划图等,数据主要包括随海拔变化的空气密度、气温数据和随地形坡度变化的坡耕地土壤侵蚀数据等。
鉴于国内普遍使用的DEM数据在藏东南地区存在较大噪声和数值缺失等问题,本文使用的DEM数据来源于美国国家航空航天局于2020年最新发布的NASADEM数据,该数据集相比现有DEM数据具有更高的高程精度,修复了噪声等优点,空间分辨率为1"(约30 m);土地利用数据来源于米林县第三次全国国土调查数据,县级行政区划提取于土地利用数据。空气密度、气温与地形高程(海拔)对应数据来源于《海拔高度与气压、空气密度、重力加速度对照表》(
因在青藏高原未查阅到相关研究成果,故坡耕地土壤侵蚀数据用黄土高原Win-Yield软件5种农作物8年模拟结果均值替代,模拟地点为延安燕沟流域,气象数据为延安站逐日数据(距离燕沟沟口约4 km),模拟农作物包括苜蓿、玉米、马铃薯、高粱和大豆,模拟时间为1997—2006年[20⇓⇓⇓-24]。模拟地点燕沟流域坡耕地主要为黄绵土(砂型黄土),与米林县种植业用地土壤类型主要为冲积湿灰壤土,质地多为砂质粘壤土的土壤属性相似,燕沟流域年均降水量约为507 mm,主要集中在6—9月,米林县年均降水量约为641 mm,主要集中在6—9月,米林县降水量略高于燕沟流域但降水集中月份相似,米林县与燕沟流域的土壤侵蚀成因均以水力侵蚀为主。本文构建的评价模型中的土壤抗蚀系数重在反映坡耕地土壤侵蚀量与地形坡度之间的相对关系,更确切地说是坡耕地土壤侵蚀量在不同坡度之间的差异性,对农作物种类、土壤质地及降水差异对土壤侵蚀的影响虽有所考虑,但并不构成关注的重点。
本文中地形高程分级规则是将海拔2000~5000 m之间按间隔100 m划分等级,海拔5000 m以上设定为一个级。坡度分级按间隔1°划分,最大坡度到30°。栅格单元按30 m×30 m、50 m×50 m、100 m×100 m、250 m×250 m、500 m×500 m、1000 m×1000 m共6种精度设定。米林县地形高程和坡度分级如图2。
图2
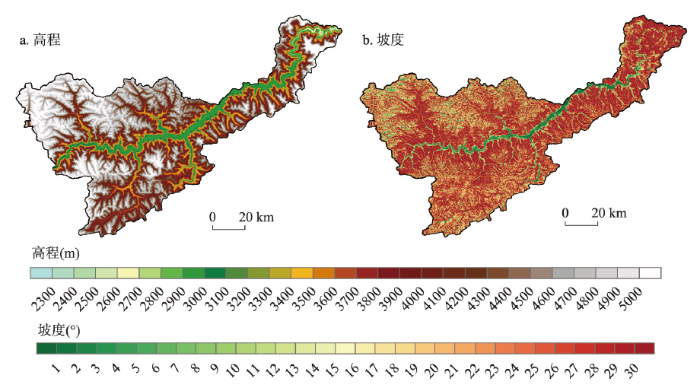
图2
米林县地形高程和坡度分级
Fig. 2
Topographic elevation and slope classification in Milin County
3 关键参数测算
3.1 空气密度参数
氧气是衡量地域空间能否满足人类长期居住生活和非农生产活动最普遍、也是最关键的要素,空气中氧气含量的多寡取决于空气密度,空气密度越大,氧气含量越高,反之亦然。在地球表层,空气密度与地形高程之间的量化关系早已得到大气状态方程证实。空气密度参数是用以刻画人类居住和生活舒适度与地形高程关系的一个特征值,将与地形高程(高程取1000~6000 m)对应的空气密度数据按极大值法进行标准化,这个标准化值即被定义为空气密度参数。为便于栅格批量计算,将空气密度参数与地形高程进行相关性拟合,二者符合线性函数变化关系(图3a),拟合方程式为:
图3
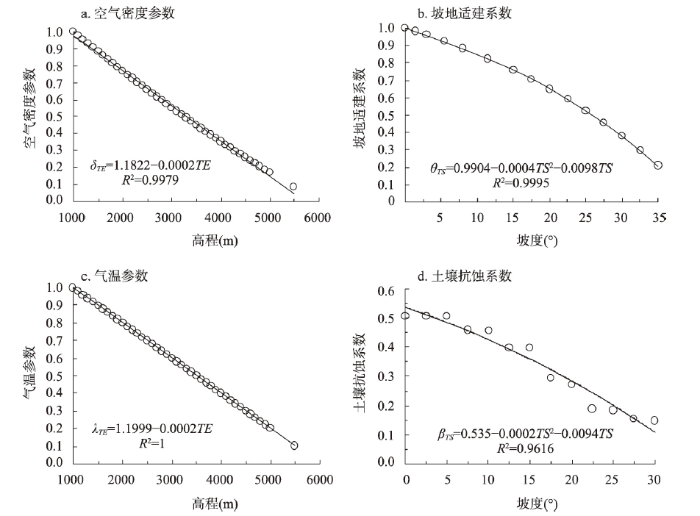
图3
关键参数随高程和坡度变化拟合曲线
Fig. 3
Fitting curve of key parameters with the increase of elevation and slope
该式可用于测算青藏高原不同高程(TE∈[2000, 5000])的空气密度参数,包括DEM图上每个栅格的空气密度参数。为减少运算和图上作业数据量,空气密度参数取地形高程分级平均高程的测算值。
3.2 坡地适建系数
该式可用于测算青藏高原不同坡度(TS∈[0, 43])的坡地适建系数,与空气密度参数取值类似,坡地适建系数取地形坡度分级平均坡度的测算值;当TS>43°时,θTS =0。
3.3 气温参数
一般来说,太阳辐射、光照、气温、降水等都属于农作物种植不可或缺的气候要素,但就中国境内(尤其青藏高原)而言,太阳辐射和光照不具有约束性,作为刻画农作物熟制的气温能有效反映农作物种植的地带性分异特征,至于降水则属于水资源评价的关键环节内容。与空气密度类似,在地球表层,气温随地形高程变化的定量关系已被大气状态方程证实。气温参数是用以从温度或积温等角度反映农作物种植或农作物熟制与地形高程关系的一个特征值,将与地形高程(高程取1000~6000 m)对应的气温数据按极大值法进行标准化,这个标准化值即被定义为气温参数。气温参数与地形高程之间符合线性变化关系(图3c),拟合方程式为:
该式可用于测算青藏高原不同高程(TE∈[2000, 5000])的气温参数,包括DEM图上每个栅格的气温参数,气温参数取地形高程分级平均高程的测算值。
3.4 土壤抗蚀系数
土壤抗蚀系数是从反向角度反映耕地土壤侵蚀量与地形坡度之间关系的一个特征值,采用土壤侵蚀模数标准化值与1的差值来表达。坡耕地土壤侵蚀模数采用黄土高原延安燕沟流域5种作物8年模拟平均值(Xi),采用以下算式对数据进行标准化:
需要特别说明的是土壤侵蚀模数标准化的分母取值,因平耕地也存在水土流失和土壤侵蚀,故土壤侵蚀模数标准化的分母取值应大于原数据中的极大值,一般宜控制在极大值的110%~120%之间,5000 t/(km2 a)符合该要求。为便于栅格批量计算,通过拟合土壤抗蚀系数与地形坡度(图3d),发现二者呈二次函数高度相关,函数关系式为:
该式可用于测算青藏高原不同坡度(TS∈[0, 33])耕地的土壤抗蚀系数,土壤抗蚀系数取地形坡度分级平均坡度的测算值;当TS>33°时,βTS =0。
4 米林县实证结果分析
4.1 建设用地适宜性
基于30 m×30 m的DEM数据,经重新采集生成不同栅格精度DEM数据,按地形高程和坡度分级阈值生成不同栅格精度的米林县地形高程分级图和坡度分级图,分别按不同精度对应将两图叠加生成高程—坡度复合图。在高程—坡度复合图属性表中增加空气密度参数、坡地适建系数和适建指数3个字段,按空气密度参数算式计算输入高程分级空气密度参数值,按坡地适建系数算式计算输入坡地适建系数值,采用适建指数(HAB)算式测算出各单元的结果值。根据适建指数结果值的分异特点,以适建指数0.58、0.48、0.38、0.28为分级阈值,将米林县土地资源建设用地适宜性依次划分为适宜、较适宜、一般适宜、欠适宜和不适宜5个等级类型(图4、表1)。
图4
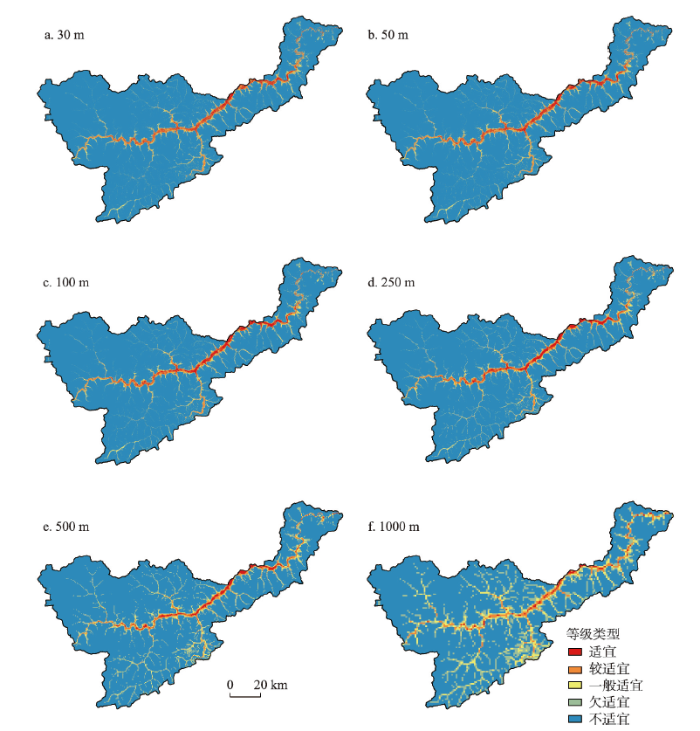
图4
不同栅格精度下米林县建设用地适宜性评价
Fig. 4
Suitability evaluation of construction land in Milin County under different grid precisions
表1 不同栅格精度下米林县建设用地适宜性评价等级类型
Tab. 1
| 等级 类型 | 适建 指数 | 30 m | 50 m | 100 m | 250 m | 500 m | 1000 m | |||||||||||
|---|---|---|---|---|---|---|---|---|---|---|---|---|---|---|---|---|---|---|
| 面积 (km2) | 占比 (%) | 面积 (km2) | 占比 (%) | 面积 (km2) | 占比 (%) | 面积 (km2) | 占比 (%) | 面积 (km2) | 占比 (%) | 面积 (km2) | 占比 (%) | |||||||
| 适宜 | ≥ 0.58 | 120.41 | 1.26 | 135.95 | 1.43 | 152.77 | 1.60 | 147.39 | 1.55 | 118.23 | 1.24 | 70.30 | 0.74 | |||||
| 较适宜 | (0.58, 0.48] | 277.97 | 2.92 | 267.33 | 2.80 | 246.20 | 2.58 | 228.79 | 2.40 | 228.64 | 2.40 | 295.09 | 3.10 | |||||
| 一般适宜 | (0.48, 0.38] | 201.93 | 2.12 | 199.91 | 2.10 | 199.34 | 2.09 | 219.98 | 2.31 | 310.34 | 3.26 | 553.25 | 5.80 | |||||
| 欠适宜 | (0.38, 0.28] | 263.95 | 2.77 | 264.69 | 2.78 | 273.75 | 2.87 | 364.36 | 3.82 | 599.31 | 6.29 | 1218.69 | 12.79 | |||||
| 不适宜 | <0.28 | 8666.56 | 90.93 | 8662.95 | 90.89 | 8658.77 | 90.85 | 8570.30 | 89.92 | 8274.30 | 86.82 | 7393.50 | 77.57 | |||||
30 m栅格精度下建设用地适宜性等级类型的总体特征是随着地形高程或坡度的增大,适宜性程度呈下降趋势;同一适宜性等级类型内,随着地形高程增加,坡度呈下降趋势。① 适宜类型:面积120.41 km2,占土地总面积的比例为1.26%,主要分布在雅江干流沿岸河谷地和支流入雅江河口两侧;地形高程在2200~3000 m之间,最大坡度11°出现在高程2200~2300 m之间,高程在2900~3000 m时坡度为2°。② 较适宜类型:面积277.97 km2,占土地总面积的比例为2.92%,主要分布于雅江干流沿岸及主要支流河谷地;地形高程在3500 m以下,最大坡度15°出现在高程2200~2300 m,高程3400~3500 m时坡度为2°。③ 一般适宜类型:面积201.93 km2,占土地总面积的比例为2.12%,主要分布在雅江支流中下游或二级以上支流的河谷地;地形高程在4000 m以下高程2200~2300 m时坡度达19°,高程3900~4000 m时坡度为2°。④ 欠适宜类型:面积263.95 km2,占土地总面积的比例为2.77%,相对集中分布在雅江支流上游或二级以上支流的河谷地;地形高程在4500 m以下,高程2200~2300 m时最大坡度为22°,高程4400~4500 m时坡度为3°。⑤ 不适宜类型:面积8666.56km2,占土地总面积比例高达90.93%,空间分布遍布全域,海拔高或坡度大是关键限制因素。
与30 m栅格精度结果对比,其它5种栅格精度评价结果在地形高程和坡度控制方面与30 m一致,但在等级类型面积和空间分布方面存在着程度不同的差异(图5、图6)。适宜类型50 m、100 m、250 m面积分别较30 m增加了12.91%、26.87%和22.41%;而500 m、1000 m面积分别较30 m减少了1.81%和41.62%。较适宜类型50 m、100 m、250 m、500 m分别较30 m减少3.83%、11.43%、17.69%和17.75%,而1000 m较30 m增加6.16%。一般适宜类型50 m、100 m较30 m分别减少1%和1.28%,250 m、500 m、1000 m分别较30 m增加8.94%、53.69%和173.98%。欠适宜类型随着栅格精度降低,面积呈增大趋势,50 m、100 m、250 m、500 m、1000 m分别较30 m增加0.28%、3.71%、38.04%、127.05%和361.71%。不适宜类型随着栅格精度降低,面积呈下降趋势,50 m、100 m、250 m、500 m、1000 m分别较30 m减少0.04%、0.09%、1.11%、4.53%和14.69%。至于各适宜性等级类型面积在不同栅格精度下呈现的升高或下降现象是由栅格精度差异与实际地形起伏状况所导致,反映了研究地域地形起伏的复杂性[27]。从适宜性等级类型面积占土地总面积比例看,50 m和100 m的结果与30 m差异较小,误差在±0.34%之间;250 m居中,误差在±1.11%之间;而500 m和1000 m差异较大,误差分别在±4.11%和±13.36%之间。从适宜性等级类型空间分布格局看,50 m、100 m和250 m的结果与30 m基本一致,而500 m和1000 m的结果差异较大。上述分析表明,30 m、50 m、100 m栅格精度均适用于青藏高原建设用地适宜性评价,250 m略显粗糙。
图5
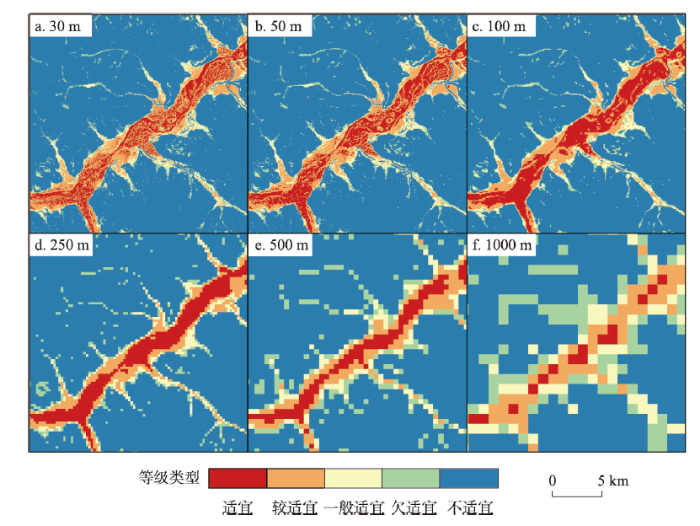
图5
不同栅格精度下米林县建设用地适宜性分布局部图
Fig. 5
Partial map of suitability evaluation results of construction land in Milin County under different grid precisions
图6
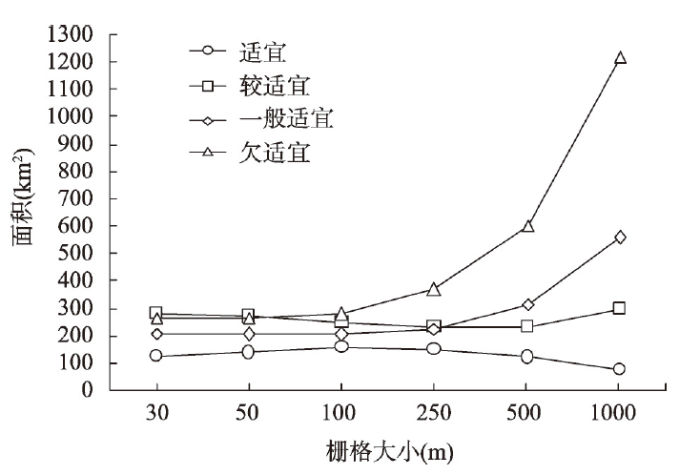
图6
不同栅格精度下米林县建设用地适宜性等级类型面积变化
Fig. 6
Area change of suitability grade type of construction land in Milin County under different grid precisions
4.2 耕地适宜性
图7
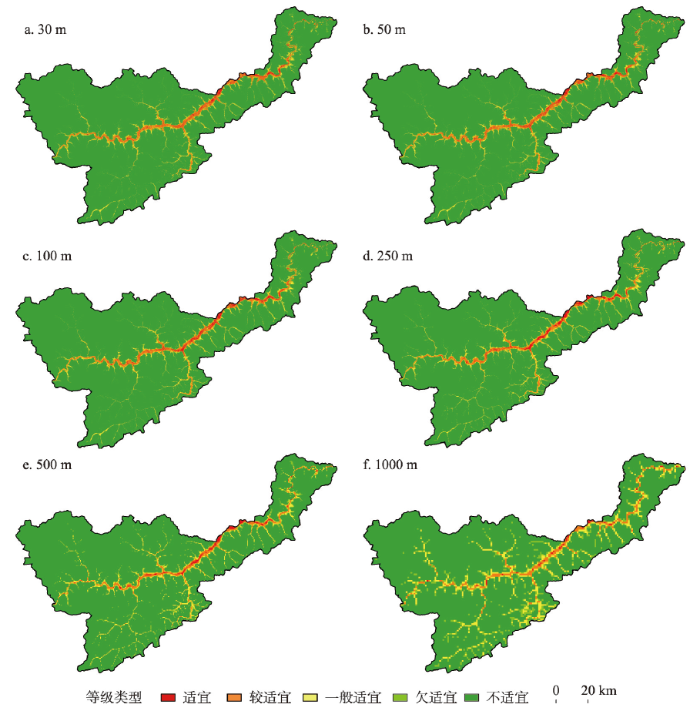
图7
不同栅格精度下米林县耕地适宜性评价
Fig. 7
Suitability evaluation of cultivated land in Milin County under different grid precisions
表2 不同栅格精度下米林县耕地适宜性评价等级类型结果
Tab. 2
| 等级 类型 | 适耕 指数 | 30 m | 50 m | 100 m | 250 m | 500 m | 1000 m | |||||||||||
|---|---|---|---|---|---|---|---|---|---|---|---|---|---|---|---|---|---|---|
| 面积 (km2) | 占比 (%) | 面积 (km2) | 占比 (%) | 面积 (km2) | 占比 (%) | 面积 (km2) | 占比 (%) | 面积 (km2) | 占比 (%) | 面积 (km2) | 占比 (%) | |||||||
| 适宜 | ≥ 0.320 | 68.41 | 0.72 | 72.74 | 0.76 | 83.64 | 0.88 | 85.01 | 0.89 | 69.01 | 0.72 | 36.68 | 0.38 | |||||
| 较适宜 | (0.320, 0.274] | 292.14 | 3.07 | 293.62 | 3.08 | 278.86 | 2.93 | 256.68 | 2.69 | 237.79 | 2.49 | 271.82 | 2.85 | |||||
| 一般适宜 | (0.274, 0.210] | 249.31 | 2.62 | 246.27 | 2.50 | 246.53 | 2.59 | 267.41 | 2.81 | 370.66 | 3.89 | 633.13 | 6.64 | |||||
| 欠适宜 | (0.210, 0.180] | 128.89 | 1.35 | 130.16 | 1.37 | 136.66 | 1.43 | 178.39 | 1.87 | 288.00 | 3.02 | 551.70 | 5.79 | |||||
| 不适宜 | <0.180 | 8792.08 | 92.25 | 8788.03 | 92.21 | 8785.14 | 92.18 | 8743.33 | 91.74 | 8565.37 | 89.87 | 8037.49 | 84.33 | |||||
30 m栅格精度下耕地适宜性等级类型的总体特征与建设用地适宜性评价结果类似,不同之处在于等级类型的面积和高程或坡度阈值差异。① 适宜类型:面积68.41 km2,占土地总面积的比例为0.72%,主要分布在雅江干流沿岸河谷地和支流入雅江河口两侧;地形高程在2200~3000 m之间,最大坡度为10°,出现在高程2200~2300 m之间,高程在2900~3000 m时坡度为1°。② 较适宜类型:面积292.14 km2,占土地总面积的比例为3.07%,主要分布于雅江干流沿岸及主要支流河谷地;地形高程在3400 m以下,高程2200~2300 m时最大坡度为15°,高程3300~3400 m时坡度为2°。③ 一般适宜类型:面积249.31 km2,占土地总面积的比例为2.62%,主要分布在雅江支流中下游或二级以上支流的河谷地;地形高程在4000 m以下,高程2200~2300 m时最大坡度为20°,高程3900~4000 m时坡度为2°。④ 欠适宜类型:面积128.89 km2,占土地总面积的比例为1.35%,相对集中分布在雅江支流上游或二级以上支流的河谷地;地形高程在4300 m以下,高程2200~2300 m时最大坡度为22°,高程4200~4300 m时坡度为2°。⑤ 不适宜类型:面积8792.08 km2,占土地总面积的比例高达92.25%,空间分布遍布全域,海拔高或坡度大是关键限制因素。
与30 m栅格精度结果对比,其他5种栅格精度评价结果在地形高程和坡度控制方面与30 m一致,但在等级类型面积和空间分布方面存在着程度不同的差异(图8、图9)。适宜类型50 m、100 m、250 m、500 m面积分别较30 m增加6.33%、22.26%、24.27%和0.88%;而1000 m面积较30 m减少46.38%。较适宜类型50 m面积较30 m增加0.51%,100 m、250 m、500 m、1000 m面积分别较30 m减少4.55%、12.14%、18.60%和6.95%。一般适宜类型50 m、100 m面积较30 m分别减少1.22%和1.12%,250 m、500 m、1000 m分别较30 m增加7.26%、48.67%和153.95%。欠适宜类型随着栅格精度降低,面积呈增大趋势,50 m、100 m、250 m、500 m、1000 m分别较30 m增加0.98%、6.03%、38.41%、123.44%和328.04%。不适宜类型随着栅格精度降低,面积呈下降趋势,50 m、100 m、250 m、500 m、1000 m分别较30 m减少0.05%、0.09%、0.55%、2.58%和8.58%。从适宜性等级类型面积占土地总面积比例看,50 m与30 m误差在±0.05%之间,100 m误差在±0.16%之间,250 m误差在±0.52%之间,500 m、1000 m误差分别在±2.38%和±7.82%之间。从适宜性等级类型空间分布格局看,50 m、100 m和250 m的结果与30 m基本一致,而500 m和1000 m的结果差异较大。上述分析表明,30 m、50 m、100 m、250 m栅格精度均适用于青藏高原耕地适宜性评价。
图8
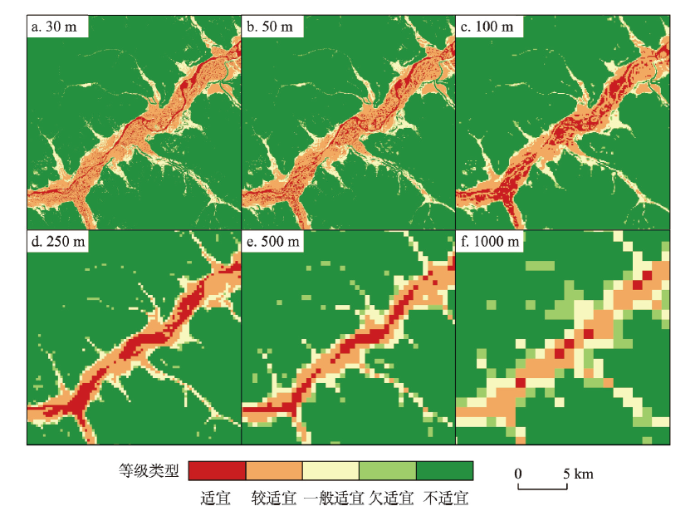
图8
不同栅格下米林县耕地适宜性分布局部图
Fig. 8
Partial map of suitability evaluation results of cultivated land in Milin County under different grid precisions
图9
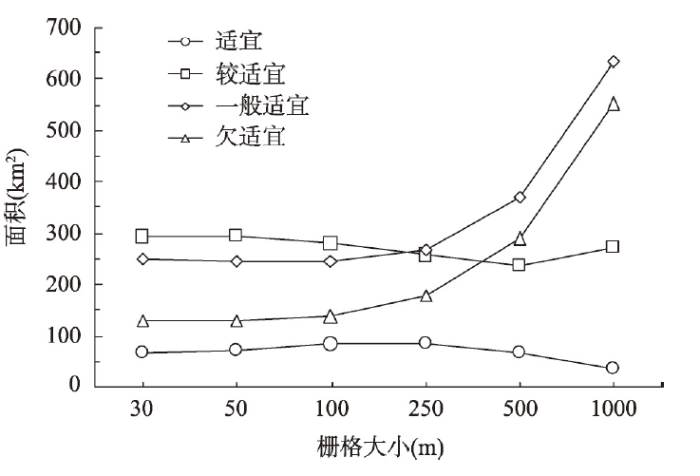
图9
不同栅格精度下米林县耕地适宜性等级类型面积变化
Fig. 9
Area change of suitability grade type of cultivated land in Milin County under different grid precisions
4.3 现状用地适配性分析
米林县现状建设用地主要包括城镇及农村居民点用地、独立工矿用地和交通运输用地,2019年面积合计32.05 km2,其中,城镇村及工矿用地10.62 km2,交通运输用地21.43 km2。经与30 m、50 m、100 m栅格精度土地资源建设用地适宜性等级类型图叠加分析,城镇村及工矿用地主要分布在较适宜类型,30 m、50 m、100 m栅格精度占比分别为63.85%、61.34%和56.07%;其次是适宜类型,占比分别为23.01%、26.17%和28.99%;一般适宜类型内有一定数量分布,占比分别为9.52%、8.85%和10.04%;欠适宜类型内分布面积很小,不同栅格精度下占比依次为2.28%、2.21%和3.27%;不适宜类型中也有分布,但占比极小。交通运输用地在不同适宜性等级类型中都有分布,这与交通道路属于线状地物的性质有关(表3)。
表3 不同栅格精度下米林县现状建设用地的适宜性等级类型分布
Tab. 3
| 适宜性 等级类型 | 城镇村及工矿用地 | 交通运输用地 | ||||||||||||||
|---|---|---|---|---|---|---|---|---|---|---|---|---|---|---|---|---|
| 30 m | 50 m | 100 m | 30 m | 50 m | 100 m | |||||||||||
| 面积 (km2) | 占比 (%) | 面积 (km2) | 占比 (%) | 面积 (km2) | 占比 (%) | 面积 (km2) | 占比 (%) | 面积 (km2) | 占比 (%) | 面积 (km2) | 占比 (%) | |||||
| 适宜 | 2.44 | 23.01 | 2.78 | 26.17 | 3.08 | 28.99 | 2.61 | 12.17 | 3.24 | 15.13 | 3.87 | 18.06 | ||||
| 较适宜 | 6.78 | 63.85 | 6.52 | 61.34 | 5.96 | 56.07 | 8.36 | 39.03 | 7.82 | 36.47 | 6.97 | 32.52 | ||||
| 一般适宜 | 1.01 | 9.52 | 0.94 | 8.85 | 1.07 | 10.04 | 3.71 | 17.31 | 3.68 | 17.18 | 3.81 | 17.76 | ||||
| 欠适宜 | 0.24 | 2.28 | 0.23 | 2.21 | 0.35 | 3.27 | 1.88 | 8.78 | 1.96 | 9.16 | 2.31 | 10.78 | ||||
| 不适宜 | 0.14 | 1.33 | 0.15 | 1.43 | 0.17 | 1.63 | 4.87 | 22.72 | 4.73 | 22.06 | 4.48 | 20.88 | ||||
| 总计 | 10.62 | 100 | 10.62 | 100 | 10.62 | 100 | 21.43 | 100 | 21.43 | 100 | 21.43 | 100 | ||||
米林县现状农业用地主要由耕地和种植园用地构成,2019年现状耕地面积为71.23 km2,种植园用地面积9.89 km2。经与土地资源耕地适宜性等级类型图叠加分析,现状耕地和种植园用地在耕地适宜性各等级类型都有分布,但以较适宜、一般适宜和适宜类型为主体,欠适宜和不适宜类型内分布面积极小(表4)。不同栅格精度下现状耕地和种植园用地分布在较适宜、适宜和一般适宜类型的面积占比都在96%以上,分布在欠适宜类型面积占比都不到1.8%,不适宜类型内面积占比均低于1.40%。
表4 不同栅格精度下米林县现状耕地和园地的适宜性等级类型分布
Tab. 4
| 适宜性 等级类型 | 耕地 | 种植园用地 | ||||||||||||||
|---|---|---|---|---|---|---|---|---|---|---|---|---|---|---|---|---|
| 30 m | 50 m | 100 m | 30 m | 50 m | 100 m | |||||||||||
| 面积 (km2) | 比例 (%) | 面积 (km2) | 比例 (%) | 面积 (km2) | 比例 (%) | 面积 (km2) | 比例 (%) | 面积 (km2) | 比例 (%) | 面积 (km2) | 比例 (%) | |||||
| 适宜 | 4.96 | 6.96 | 7.39 | 10.38 | 11.08 | 15.55 | 0.69 | 6.95 | 0.90 | 9.15 | 1.39 | 14.05 | ||||
| 较适宜 | 53.45 | 75.05 | 51.36 | 72.11 | 45.99 | 64.57 | 7.69 | 77.74 | 7.55 | 76.38 | 6.81 | 68.89 | ||||
| 一般适宜 | 11.41 | 16.02 | 10.96 | 15.39 | 11.77 | 16.52 | 1.28 | 12.91 | 1.23 | 12.43 | 1.39 | 14.04 | ||||
| 欠适宜 | 0.73 | 1.02 | 0.75 | 1.05 | 1.20 | 1.69 | 0.12 | 1.24 | 0.11 | 1.06 | 0.17 | 1.70 | ||||
| 不适宜 | 0.67 | 0.94 | 0.76 | 1.07 | 1.18 | 1.66 | 0.11 | 1.16 | 0.10 | 0.98 | 0.13 | 1.32 | ||||
| 总计 | 71.23 | 100 | 71.23 | 100 | 71.23 | 100 | 9.89 | 100 | 9.89 | 100 | 9.89 | 100 | ||||
5 讨论
5.1 适宜性等级类型与地形高程和坡度对应谱系
图10
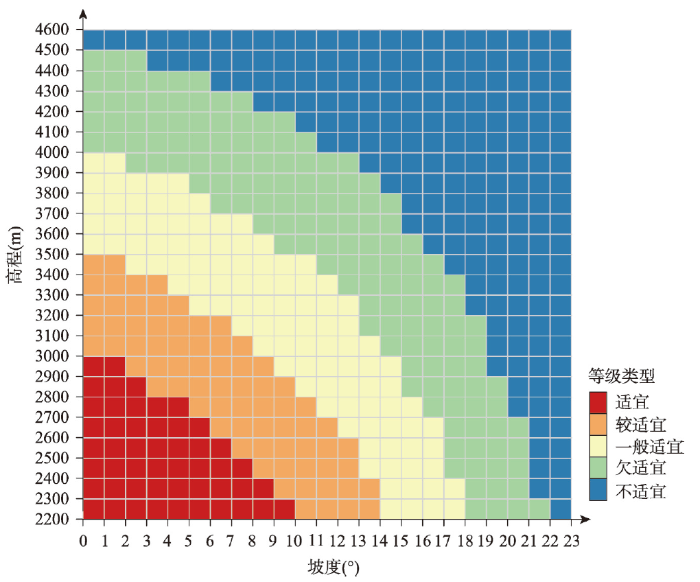
图10
建设用地适宜性等级类型与地形高程和坡度对应谱系
Fig. 10
Corresponding pedigree between suitability grade type of construction land and topographic elevation and slope
图11
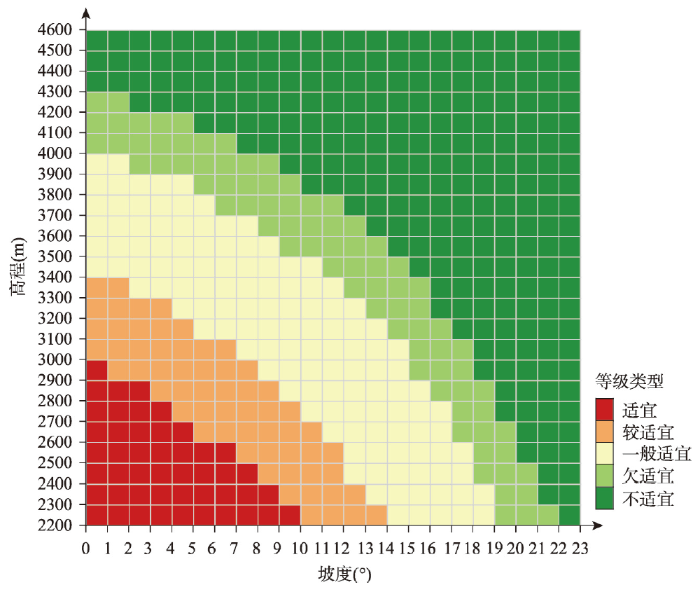
图11
耕地适宜性等级类型与地形高程和坡度对应谱系
Fig. 11
Corresponding pedigree between cultivated land suitability grade type and topographic elevation and slope
5.2 基于谱系的主体功能区规划可利用土地资源评价分析
主体功能区规划关于可利用土地资源的评价旨在测算可供规模性城镇化和工业化的后备适宜建设用地数量及空间分布状况,采用的方法是全国层面将地形高程划分为5个等级:<500 m、500~1000 m、1000~2000 m、2000~3000 m、≥3000 m,将地形坡度划分为5个等级:<3°、3°~8°、8°~15°、15°~25°、≥ 25°;可利用土地资源面积按高程低于2000 m且坡度<15°、高程在2000~3000 m之间且坡度<8°、高程在3000 m以上且坡度<3°等规则提取测算(图12)。对照建设用地适宜性等级类型与地形高程和坡度对应谱系,主体功能区规划提取测算出的可利用土地资源面积在2000 m以下大致相当于谱系中的适宜与较适宜类型之和,2000~3000 m之间有较适宜或适宜类型丢失,而3000 m以上包含了较大面积的欠适宜和不适宜类型,尤其对<3°的可利用土地资源缺乏最大高程控制。
图12
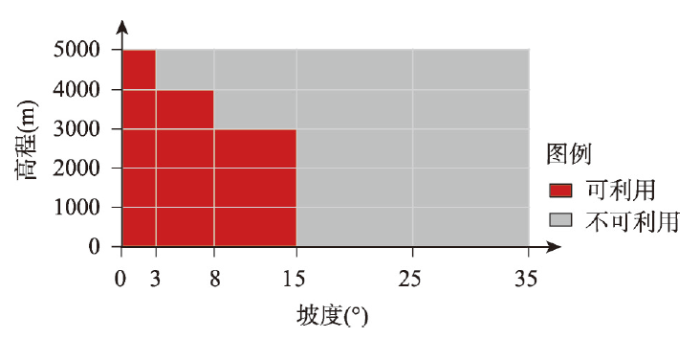
图12
可利用土地资源与地形高程和坡度对应谱系
Fig. 12
Corresponding pedigree between available land resources and topographic elevation and slope
5.3 基于谱系的城镇和农业用地可利用程度“双评价”分析
资源环境承载能力和国土空间开发适宜性评价(简称“双评价”)是目前中国正在开展的国土空间规划的重要基础,已发布的“双评价”指南中关于土地资源城镇建设可利用程度评价,全国层面将地形高程划分为5个等级: <1000 m、1000~2000 m、2000~3000 m、3000~4000 m、≥ 4000 m,将地形坡度按<3°、3°~8°、8°~15°、15°~25°、≥ 25°依次划分为可利用程度高、较高、中等、较低和低5个等级;以坡度分级为基础,高程低于3000 m时基于坡度分级的可利用程度等级不变,高程在3000~4000 m之间可利用程度降1级,高程在4000 m以上时可利用程度降2级(图13a);之后,再根据地形起伏度对城镇用地可利用程度进行等级调整;对于高程大于5000 m的区域,直接划定为低级。指南中关于农业用地可利用程度评价,全国层面地形高程划分与城镇建设用地评价相同,地形坡度按<2°、2°~6°、6°~15°、15°~25°、≥ 25°依次划分为可利用程度高、较高、中等、较低和低5个等级;以坡度分级为基础,高程低于2000 m时可利用程度等级不变,高程在2000~3000 m之间可利用程度降1级,高程在3000 m以上时,可利用程度降2级(图13b);之后,再根据土壤质地、农作物熟制等进行农业用地可利用程度等级调整[28]。
图13
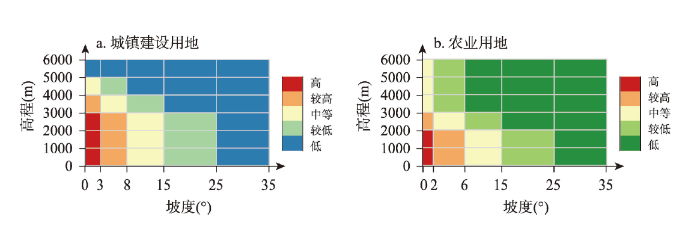
图13
土地资源可利用程度与地形高程和坡度对应谱系
Fig. 13
Corresponding pedigree between land resource availability and topographic elevation and slope
“双评价”中关于土地资源可利用程度评价较主体功能区规划的可利用土地资源评价有了较大改进,对土地资源城镇建设和农业用地可利用程度进行了等级类型划分,但就青藏高原而言,依然存在等级类型划分较为粗糙和农业用地缺乏最大高程控制等问题。对照土地资源建设用地适宜性等级类型与地形高程和坡度对应谱系(图10),可以发现“双评价”城镇建设用地可利用程度等级类型(图13a)在高程3000 m以下完全取决于地形坡度,未体现出随高程变化的坡度分异;3000 m以上受人为主观性主导,等级类型少且呈现突变特点;高程5000 m限高明显高于谱系欠适宜等级类型4500 m阈值。对照土地资源耕地适宜性等级类型与地形高程和坡度对应谱系(图11),“双评价”农业用地可利用程度等级类型划分(图13b)除了存在与上述城镇建设用地可利用程度评价类似的问题外,最重要的是未涉及到3400 m和4300 m等农业高程界限。根据郑度对藏东南地区自然带的考察,小麦的种植海拔上界大约为3400 m,青稞在昌都一带可以达到4100 m,而山南实地考察发现在一些山间小盆地或谷地等局部区域气温适宜并有灌溉条件的情况下,青稞的种植高程上限可以达到4300 m[17]。
5.4 关于评价方法模型的推广应用
本文建立的评价方法模型解决了“双评价”指南关于建设用地和耕地适宜性评价在青藏高原应用中存在的不足,但在将其推广应用到青藏高原其它区域乃至全域时,仍需参照“双评价”指南的框架思路重点关注评价区域的空间尺度、适宜性等级类型的连片性和规模性、水资源丰度及用水便利性、农作物熟制等问题。评价模型是基于立地条件或栅格单元构建的,评价结果仅适用于小尺度区域。对于较大尺度区域,建设用地评价结果需按具体建设对象要求进行连片性、规模性和用水便利性等修订;耕地评价结果需进行农作物熟制修订,青稞的积温(≥ 0 ℃)需求一般在1300~1400 ℃之间,是青藏高原一年熟制的指示作物。此外,该评价方法模型是否适用于低海拔的我国中、东部地区,尚有待开展典型案例实证。
6 结论
在继承已有研究成果学术思路的基础上,搭建了青藏高原土地资源人类活动适宜性评价流程框架,选择随地形高程和坡度变化的关键参数建立了基于栅格单元的建设用地和耕地适宜性定量评价模型,提出了空气密度、气温、坡地适建、坡耕地土壤抗蚀等关键参数的普适性算法。基于高程100 m间隔、坡度1°间隔和6种不同栅格精度,测算评价了米林县土地资源建设用地和耕地适宜性状况,将米林县建设用地和耕地适宜性划分为适宜、较适宜、一般适宜、欠适宜、不适宜5个等级类型。主要结论和观点如下:
(1)30 m栅格精度下米林县建设用地适宜、较适宜和一般适宜3个等级类型面积合计600.31 km2,占土地面积比例6.30%,欠适宜占比2.77%,不适宜占比90.93%;50 m、100 m结果与30 m误差很小,250 m误差可接受,500 m、1000 m误差较大。30 m栅格精度下耕地适宜性前3个等级类型面积合计609.85 km2,占土地面积比例6.40%,欠适宜占比1.35%,不适宜占比92.25%;50 m、100 m、250 m与30 m误差很小,而500 m、1000 m误差较大。表明适用于建设用地和耕地适宜性评价的栅格精度为100 m,最大不超过250 m。
(2)米林县现状城镇村及工矿用地主要分布在建设用地较适宜、适宜和一般适宜等级类型,30 m栅格精度三者合计占比达95.96%,50 m、100 m占比分别为95.96%和94.74%。现状耕地和种植园用地主要分布在较适宜、一般适宜和适宜等级类型,3种栅格精度下三者合计占比大于96%,欠适宜类型内占比不到1.8%,不适宜类型内占比低于1.4%。表明业已提出的评价方法、评价模型及参数算法是可行的和适用的。
(3)根据米林县实证研究结果建立了适用于青藏高原的土地资源建设用地和耕地适宜性等级类型与地形高程及坡度对应谱系,对比解析了中国主体功能区规划关于可利用土地资源评价方法和现行“双评价”指南关于土地资源可利用程度评价方法在应用于青藏高原时存在的专业性缺陷。
参考文献
A review of agricultural geography development
农业地理学发展述要
Researching formation, development, internal structure and system of China's agricultural zone
试论农业区域的形成演变、内部结构及其区划体系
DOI:10.11821/xb196401002
[本文引用: 1]

一、农业区划的客观基础及其重要意义农业生产的地区差异是现实存在的,并有其客观的历史形成基础。最明显的象山地农业区与平原农业区就有着很大差别,又如棉花产区,稻麦产区及畜牧区等等也是各具特点,互不相同。因此,按农业分布的形成条件、地域特征以及它的表现形态,加以划分出不同类型和区域是完全有可能的。远溯两千多年前在我国古代名著的“禹贡”里,把全国领土分为九州,对各州土壤、物候、农产、田赋均有记载。
Education and enterprise of geography at Britain British
英国之地理教育与地理事业
Promoting areal specialization of agriculture through development areal predominance
DOI:10.11821/xb198104001
[本文引用: 1]
In the field of agriculture, physical reproduction and economic reproduction crosseach other intricately. Thus, agriculture must fundamentally adapt to tiie local condi-tions, which should be properly recognized as including not only the physical, but thesocial and economic conditions as well. In a country of vast territory like China, arealdifferentiation of local conditions is so evident that it would never be exaggeration toemphasize the importance of adaptation.On the march towards modernization, Chinese agriculture will have to undergo aperiod of strategic transferring. The adjustment applies both to the allocation and thestructure of agriculture.The guiding principles like: "reclaim those land suitable for agriculture, afforestthose suitable for forestry, and grazing those suitable for animal husbandry", and eeo-nomic crops should be"properly concentrated in distribution", etc.. are just in generalterms and cause much trouble in implementation. Here, the terms "suitable" and "pro-perly concentrated" should be defined precisely by means of a series of quantitative andqualitative criteria.Ever since ancient times, food crop has been the mainstay of Chinese agriculture.About 80% of rural labour, cultivated land and sown area are devoted to food crop cultiva-tion. However,the dogmatic demand of self-sufficiency in food supply for everywhereis impracticable in many parts of the country, such as the loess plateau and the dryfarming areas of Inner Mongolia. A proper ratio between the acreage of food cropsand economic crops and the critical limit of treple cropping (double cropping of riceplus winter wheat or rapeseeds) index in southern China are needed to be thoughtfully decided.The new guiding principle of "developing the areal predominance through promot-ing the favorable and dodging the unfavorable conditions" attracted much attentionfrom the agricultural and academic circles. The author suggests that in order to realizethe principle’s true meaning, the following view points are helpful. (l’i Areal predo-minance is a comprehensive idea, and it can only be developed under the conditions thatare physically suitable, technically practicable and economically profitable,i(’2)i In theregional system of the country, any region is not isolated, but is linked together with oneanother, just like a single piece on the chessboard. The right order of developing arealpredominance should put national first, provincial nest, and local still next. (3) Asconditions of any region are subject to change, the development of areal predominanceshould be considered with long-term sense. (4) Comparative plans for developing arealpredominance are preferred, so as to select the mostninst rational and profitable one throughteehno-economic appraisal.Through the process of developing areal predominance, areal specialization of agri-culture will gradually take shape. Chinese agriculture, on the basis of petty-peasanteconomy, asked local self-sufficiency for every thing in the past, deterred areal speciali-zation of production. There only flourished.sericulture in the deltas of the Yangtze andthe Pearl River, due to the need for de luxe clothing in the feudal times. Cotton andtobacco plantings were encouraged in the vicinities of Shanghai. Tsingtao and Hankowthrough the investment of foreign manufacturers in the semi-feudal and semi-colonialdays. It was only after liberation, new bases of commercial grains, cotton, sugar beetand tropical crops were established by the state farms in the interior and border regionsThe areal specialization of agiculture that China is going to promote is not those ofmono-cropping systems of the colonial or semi-colonial nations, but is the rational divi-sion of labour among regions under the guichnce of planning economy. It is expectedthat the potential of agricultural production will be brought into full play through theproceeding of areal specialization.
因地制宜发挥优势逐步发展我国农业生产的地域专业化
DOI:10.11821/xb198104001
[本文引用: 1]
一、农业生产必须强调因地制宜 农业和国民经济其它部门有一个最大差异之点,它是自然再生产过程和经济再生产过程相交错的范畴。农业种植的作物、畜牧业饲养的牲畜,林业栽种的树木、水产业繁殖的鱼类和水生生物都是生物,都有它们本身的生长规律,都受制于自然条件,因此农业这个生产部门要特别讲究尊重自然规律和社会经济规律。
Evaluation of agricultural land adaptability in the Huang-Huai-Hai Plain
黄淮海平原土地农业适应性评价
Land suitability analysis for the upper Gila River watershed
Draft of major function oriented zoning of China
DOI:10.11821/dlxb201502002
[本文引用: 1]
Major Function Oriented Zoning (MFOZ) is the blueprint for the future developmnt and protection pattern of China's territory, and has been raised to from major function zones planning to major function zoning strategy and major function zoning institution. From 2004 to 2014, the author organized a series of research projects to compose MFOZ for the country, studied basic theory of regional function and MFOZ technical process, and proposed that space controlling zones of national and provincial scales can be divided into four types: urbanized zones, foodstuff-security zones, ecological safety zones, cultural and natural heritage zones. On this basis, major function zones of county scale should be transferred to optimized, prioritized, restricted, and prohibited zones. In this paper, a regional function identification index system comprising nine quantitative indicators (including water resources, land resources, ecological importance, ecological fragility, environment capacity, disaster risk, economic development level, population concentration and transport superiority) and one qualitative indicator of strategic choice is developed. Based on the single index evaluation, comprehensive evaluation using regional function suitability evaluation index is conducted, aiming at testing several key parameters including lower limit of protection zones and upper limit of development zones at the provincial level. In addition, a planning-oriented zoning method of major function zones is also discussed, which has brought the first MFOZ planning in China. According to the MFOZ caliber, it is forecasted that national spatial development intensity will rise from 3.48% in 2010 to 3.91% in 2020. Furthermore, according to caliber of the provincial integrated MFOZ planning, the area of optimized, prioritized and restricted zones accounts for 1.48%, 13.60% and 84.92%, respectively, and that of urbanized, foodstuff-security and ecological safety zones accounts for 15.08%, 26.11% and 58.81%, respectively. In combination of analyses of development level, resources and environmental carrying status and quality of the people's livelihood, the main characteristics of MFOZ were identified. Through verification, MFOZ draft of national and provincial scales, which is interactively accomplished with "MFOZ Technical Process" put forward by the author, is mostly above 80% identical with what have been forecasted.
中国主体功能区划方案
DOI:10.11821/dlxb201502002
[本文引用: 1]
中国主体功能区划方案是刻画未来中国国土空间开发与保护格局的规划蓝图,主体功能区规划已上升为主体功能区战略和主体功能区制度。2004-2014年,笔者组织系列研究项目,配合国家编制主体功能区规划,研究地域功能基础理论和功能区划技术流程,提出国家和省区尺度进行空间管制的地域功能区域类型为城市化区域、粮食安全区域、生态安全区域、文化和自然遗产区域等4类,在此基础上转化为以县级行政区划为单元的优化开发、重点开发、限制开发和禁止开发4类主体功能区。研制了由水资源、土地资源,生态重要性、生态脆弱性、环境容量、灾害危险性、经济发展水平、人口集聚度和交通优势度等9类可定量指标及战略选择为1项定性指标构成的地域功能识别指标体系,进行了单项指标评价,开发并运用地域功能适宜程度综合评价指数进行了综合评价,测算了各省区保护类区域下限、开发类区域上限以及开发强度等关键参数;研讨了以规划为应用指向的主体功能区划分方法,形成中国首部主体功能区划方案,按照全国主体功能区规划口径,2020年与2010年相比,全国国土空间开发强度从3.48%增加到3.91%;按照省区集成的主体功能区规划口径,优化、重点、限制开发区域的土地面积比重分别为1.48%、13.60%、84.92%,城市化、粮食安全、生态安全区域的土地面积比重分别为15.08%、26.11%、58.81%。结合区域发展水平、资源环境承载状态、民生质量等相关分析,给出了主体功能区的主要特征。通过区划方案校验,国家和省区分两级采用笔者主持制定的《主体功能区划技术规程》互动完成的全国主体功能区划方案,同预判的吻合程度多为80%以上。
Assessing construction land potential and its spatial pattern in China
Reshaping the sustainable geographical pattern: A major function zoning model and its applications in China
The pattern of available construction land along the Xijiang River in Guangxi, China
Appraisal of land resources security in the post-earthquake reconstruction area of Lushan earthquake
DOI:10.11821/dlxb201504012
[本文引用: 1]
The land resources security appraisal of the post-earthquake reconstruction area is one of the fundamental tasks for resource-environment carrying capacity assessment. It could provide scientific reference for post-earthquake reconstruction. This paper takes Lushan earthquake as a case and identifies 3 factor groups including geological conditions and disaster risks, water and land resources conditions, and eco-environment as well as 8 factors. The appraisal model of land resources security in Lushan post-earthquake reconstruction area is constructed, and the land resources security at grid and administrative scales is analyzed with the aid of GIS spatial analysis technique. The results show that: the area of high safe class amounts to 2409.30 km2, accounting for 5.63% of the total land area, and it is mainly distributed on the eastern piedmont plains, which should be regarded as the first choice for reconstruction site selection; the middle safe class could be the supplementary choice of high safe class, and the low safe class needs to be selected for reconstruction with concrete protection measures; only 6 out of 21 counties in the stricken area have the land resource security index above 0.60, and all of them are located on the eastern piedmont plains; in the 6 hard-hit counties, only Mingshan has relatively high land resource security index (0.76), with 468.33 km2 available land for reconstruction and relatively high available land for reconstruction per capita; Mingshan should be regarded as the preferred region for large-scale population aggregation, urbanization and industrialization development for the relocation settlements of hard-hit areas. The appraisal model developed in this study is applicable to the regions with similar geological disasters, and it could also provide reference for the studies on the regions with similar geological, topographic, resources, and environmental conditions.
芦山地震灾后重建地区土地资源安全评价
DOI:10.11821/dlxb201504012
[本文引用: 1]
地震灾后恢复重建的土地资源安全评价是资源环境承载能力评价的基础性工作之一,为灾后恢复重建工作的开展提供科学依据。针对灾后重建地区土地资源安全评价的特殊性,本文以芦山地震灾后重建地区为例,综合考虑地质条件与灾害危险性、水土资源条件、生态环境等3大类要素及8个评价因子,构建了芦山地震灾后重建地区土地资源安全评价模型,并利用GIS空间分析方法对栅格单元和行政单元的土地资源安全进行了评价和分级。结果表明:属于安全类的土地面积为2409.30 km<sup>2</sup>,占灾区土地总面积的5.63%,主要分布于灾区东部的山前平原区,这类区域应该被视为灾后重建选址的首选区域,较安全类可以作为安全类区域的补充选择,而一般安全类在作为灾后重建选址的备选区域时应做好充分的防护措施;灾区21县中仅有6个县的土地资源安全指数大于0.60,它们均位于灾区东部的山前平原区;在属于极重灾区和重灾区的6县中,只有名山区具有较高的土地资源安全指数(0.76),可重建土地面积为468.33 km<sup>2</sup>,且其人均可重建土地面积也相对较高,应作为极重灾区和重灾区灾后异地重建进行大规模人口集聚、城市建设和产业发展的首选区域。本研究提出的评价模型适应于具有同类地质灾害的研究区域,也可以为具有相似地质、地形和资源环境条件的区域开展研究提供参考。
Methodology and role of "double evaluation" in optimization of spatial development pattern
国土空间格局优化中的“双评价”方法与作用
Some problems on the altitudinal belts in southeastern Qinghai-Xizang (Tibetan) Plateau
DOI:10.11821/xb198501007
[本文引用: 2]
The study area is mainly covered by montane coniferous forests, alpine scrubs and meadows. It is the most humid region in the Qinghai-Xizang Plateau. In general, four types of the altitudinal belt, all pertaining to the oceanic system, may be recognized.The differentiation of the altitudinal belts is correlated with the basal belt. Prom southeastern margin to the interior of the study area, with increasing altitude, in addi-tion to differences of the basal belt there is a decrease in number of altitudinal belts and a simplification of spectra. The regional variation of zonal structures and their al-titudinal limits is conspicuous. Compared with other parts of the world, the upper for-est limit in the eastern Tibet is the highest.A number of dry valleys located in the gorge ’bottoms is one of the striking geo-ecologieal phenomena. The extent, distribution and upper limit of the dry valleys as well as their relationship to the horizontal zonation are discussed.Altitudinal belts of the study area are economically important in providing different areas for agriculture, animal husbandry, forestry, fuel supply and others. The long-term’ results of human impacts on fragile mountain environments may be summarized as the expansion of scrubs belt of the dry valley, the lowering of upper forest limits, de-forestations, and dramatical acceleration of soil erosions.Although the population pressure is one of the underlying causes of environmental and natural resource problems in the mountainous areas, the deforestation and misma-nagement of forests are directly responsible for ensuing environmental problems.
青藏高原东南部山地垂直自然带的几个问题
DOI:10.11821/xb198501007
[本文引用: 2]
青藏高原东南部包括横断山脉中北段及雅鲁藏布江流域东端的林芝、波密一带,行政区划上主要指西藏东部、四川西部及滇西北地区,是青藏高原上的一个自然区域——藏东川西山地针叶林地带。
Research on the natural territory system of Qinghai-Tibet Plateau
青藏高原自然地域系统研究
The effects of human activities on the ecological environment of Tibet over the past half century
西藏近半个世纪以来人类活动的生态环境效应
Topographic differentiation simulation of crop yield based on WIN-YIELD software in the loess hilly-gully region
基于WIN-YIELD软件的黄土丘陵区作物产量地形分异模拟
Topographic differentiation simulation of soil and water loss of slope farmland in Loess Plateau
黄土高原坡耕地水土流失地形分异模拟
Topographic differentiation simulation of crop yield and soil and water loss on the Loess Plateau
黄土高原作物产量及水土流失地形分异模拟
Topographic differentiation simulation of Alfalfa yield and soil and water loss in the Loess Plateau
黄土高原坡耕地苜蓿产量及水土流失地形分异模拟: 以延安燕沟流域为例
DOI:10.11820/dlkxjz.2010.05.003
[本文引用: 1]
退耕还林还草是目前黄土高原整治生态环境和控制水土流失的主体政策.为使生态退耕政策得到有效落实,本文基于WIN-YIELD软件,以延安燕沟流域为例,利用2006年延安站的逐日气象数据和燕沟流域地貌、土壤及土地利用等资料,模拟分析了不同地形高程、坡度和坡向条件下坡耕地种植苜蓿的秸秆干物质产量、水土流失量及其地形分异特征.结果表明:在黄土高原,地形坡度是影响苜蓿秸秆干物质产量和泥沙流失的重要因素,苜蓿秸秆产量模拟值随地形坡度的增大而减小,泥沙流失的模拟值随地形坡度的增大而增大;地形高程1000 m以下的地域种植苜蓿其产量明显高于1000 m以上的地域,坡耕地苜蓿产生径流和泥沙随地形高程的变化不显著;地形坡向对苜蓿秸秆产量和水土流失量的影响不大.
Analysis of comprehensive benefits of transforming slope farmland to terraces on the Loess Plateau: A case study of the Yangou Watershed in Northern Shaanxi Province, China
Urban planning construction land standard and its revision of climate and topography in China
DOI:10.11821/dlxb202001014
[本文引用: 1]
Urban planning construction land standard is the technical specification for allocating various types of urban construction land scientifically, and is the basis for drawing up and revising the overall urban planning as well. In view of China's current urban planning construction land standard, there are many problems such as the big gap of land use control threshold, the lack of regional differences in climate revision, and ignorance of the topographical and geomorphological factors. To solve these problems, this paper proposed a step-by-step process framework and quantitative calculation method for the establishment and revision of standards in accordance with the principle of "total-structure" control. Through the setting of conditions, a universal basic standard for construction land was established. Then quantitative analysis was made for the relations between each index and the basic standard with the selected key indicators such as urban population size, sunshine spacing coefficient, valley area (intermountain basin) width and terrain slope. Finally we formed a revision standard for climate, topography and geomorphology which is matched with the basic standard. The main results are as follows: (1) The per capita construction land area of 95 m 2/person can be used as the total indicator for the basic standard of urban planning in China. The percentage of corresponding per capita for each type of construction land is 32.5% for residential land, 7.42% for public administration and public service land, 22.5% for industrial land, 17.5% for transport facilities, 12.5% of green land, and 7.58% of other types of land. The results of revision value of urban population scale shows that the impact of population size difference on the per capita construction land is relatively weak. (2) The climate revision results of per capita residential land and per capita construction land in major cities show that the climate revision value varies greatly between northern and southern China. The climate revision value of the per capita area of construction land varies by latitude as follows: the figure for 20° north latitude is 93 m 2/person; the figure for 30° north latitude is 97 m 2/person; the figure for 40° north latitude is 103 m 2/person; and the figure for 50° north latitude is 115 m 2/person. The basic standard value of 95 m 2/person is roughly distributed along the Xiamen - Guilin - Kunming line. (3) The cities located in mountainous areas, hilly valleys or intermontane basins can reduce the allocation of community parks and comprehensive parks when the average width of river valley or intermontane basin is less than 2 km. When the average width of the valley or intermontane basins is between 2 km and 4 km, the allocation of the comprehensive parks can be reduced. The revised results of per capita land for construction use on slopes indicate that the terrain slope has a great impact on the revised value of per capita construction land. The revised value at 3° is 3.68% higher than the baseline value, and the increases of 8°, 15° and 25° are 11.25%, 26.49% and 68.47%, respectively.
中国城市规划建设用地标准及气候和地形地貌修订
DOI:10.11821/dlxb202001014
[本文引用: 1]
城市规划建设用地标准是科学配置城市各类建设用地的技术规范和编制、修订城市总体规划的基础。针对中国现行城市规划建设用地标准存在的用地指标控制阈值高低差距较大、气候修订缺乏地域分异和地形地貌因素缺失等问题,本文按照“总量—结构”控制的建标思路,提出了标准建立、修订的分步式流程框架和定量测算方法,通过条件设定建立了普适性的建设用地基础标准,进而选择城市人口规模、日照间距系数、河谷地(山间盆地)宽度、地形坡度等关键指标,定量分析了各指标与基础标准之间的关系,形成与基础标准配套的气候和地形地貌修订标准。主要研究结果包括:确定了设定条件下适用于全国不同地区的由人均建设用地面积和人均单项用地类型结构控制的建设用地基础标准;按城市人口规模等级对基础标准进行了量化修订;定量测算了人均居住用地面积随日照间距系数变化的情况,提出了按纬度方向变化的人均建设用地气候修订标准;阐释了河谷地(山间盆地)宽度变化与公园绿地的配置,量化分析了地形坡度与人均建设用地面积变化的关系,建立了针对山地、丘陵地区城市规划建设用地的地形地貌修订标准。
Mountainous urban planning and architectural design according to climate
回应气候的山地城镇与建筑设计
