

1 引言
人类活动强度(Human Activity Intensity, HAI)是表征人类活动对一定区域产生扰动作用程度的综合指标,能客观表征人类活动对陆地表层的利用、改造和开发程度[1],其定量表达是评价人类活动对生态环境影响的重要参数[3]。随着社会经济的快速发展和人类生产生活方式的巨大转变,人类改造自然的强度、深度和规模不断扩大,人类活动趋于多元化、复杂化和综合化,为客观界定和表征当前人类活动强度带来了很大挑战。现有研究中,HAI的定量表达主要从人类活动的结果变化出发,如基于权重的多指标叠加分析[4]、残差分析[5]、人类足迹[6⇓-8]、土地利用变化[1,9]等;选取指标主要有土地利用方式、景观类型与人口密度等,多为单因子量化,未能全面体现人类活动的动因和过程以致对区域人类活动的刻画尚显粗糙和片面。代表性的核心指标及综合量化分析有助于推进人类活动的全面刻画和多维表达。人口数量及其空间分布既能体现人类活动的原始动力和基本格局,又能反映人类活动过程、状态和结果的动态演变;土地作为人类活动的基本载体,其利用类型变化是人类对地表影响过程及结果的直观表现,也是当前定量表征HAI时的主要因子之一;夜间灯光数据能体现城市灯光甚至小规模居民地、车流等发出的低强度灯光[10-11],因此可细化工矿用地、交通用地、城乡住宅和公共设施用地等建设用地和耕地等地类内部人类活动的等级和空间分异,被广泛应用于建设用地提取[11]、城市发展及空间结构评估[12]、国内生产总值及能源消费[14]、碳排放模拟[15]、大气污染评价[16]等与人类活动密切相关的领域。目前,HAI的度量尚未形成普适性强且广泛应用的综合指标算法[1],而融合土地利用、人口分布与夜间灯光数据的表征体系有望进一步解释和细化人类活动的初始动力、演变进程和时空格局,有利于对HAI的全面表征和多维刻画,是从多视角对人类活动强度综合表征体系的进一步完善和深化,具有重要的理论价值和现实意义。
地表温度(Land Surface Temperature, LST)是全球及区域陆面过程及气候模式研究的重要参数。它通过改变地面与大气间的物质能量平衡,引起气温、降水与植被等时空格局发生连锁反应,进而对区域生态环境演变产生重要影响[17]。目前基于遥感数据的地表温度研究已取得丰富成果,其中MODIS地温数据因其经济便捷、宏观及高时间分辨率等诸多优势而得到广泛使用,其精度已得到广泛认可[18-19]。现有研究主要集中于中国中东部和华南等人口密集地区的地温变化[19⇓-21]、冷热岛效应[22-23]等方面。影响地温的因素众多,已有研究表明土地利用类型对LST时空分布具有深刻的影响[24-25],水体—林地—草地—裸地—建筑用地的LST依次升高[25],NDVI与LST总体上呈负相关关系[25-26]。人口集中意味着更强烈的地表改造、更多是资源消耗及人为热量排放,郭恒亮等[26]与王刚等[27]证实了人口密度对LST的显著正向影响;夜间灯光亮度综合了土地利用和人口因素,直接体现了社会经济活跃程度,沈中健等[28]及胡李发等[29]研究发现其与LST的正相关关系呈显著增强趋势。可见现有研究多为单因子相关性研究,而多因子综合联动分析较少,无法全面揭示地表温度的变化机制,也未能反映人类活动对LST的综合影响,因此HAI对LST及其时空分异的影响研究亟待拓展和深入。
中国西北干旱区生态环境脆弱且对气候变化敏感,其地表温度作为全球气候变化的指示器已受到各界高度关注[30]。半个多世纪以来西北地区总体呈现由暖干向暖湿演变的趋势,新疆北部和天山一带尤为明显[31-32]。天山北坡地区作为新疆政治、经济和文化的核心地带,是新疆人口最密集、人类活动最活跃的区域[33],相关研究多从气温、土地利用变化和城市化过程等角度单独展开[34-35],涉及区域人类活动与地温的时空关联研究尚有待拓展。故本文尝试从人类活动动因与结果、状态与过程的视角,将人口分布、夜间灯光及土地利用等数据有机结合,构建一个能准确客观反映人类活动对陆地表层影响和作用程度的HAI综合指标;采用斜率分析及相关分析等方法,对天山北坡人类活动强度与地表温度的时空分异特征、变化趋势及其时空关联性进行定量研究,评估HAI对天山北坡LST变化的影响,以期为积极应对气候变化、保护生态环境、合理开发资源及调节人类活动等提供参考。
2 数据与方法
2.1 研究区概况
图1
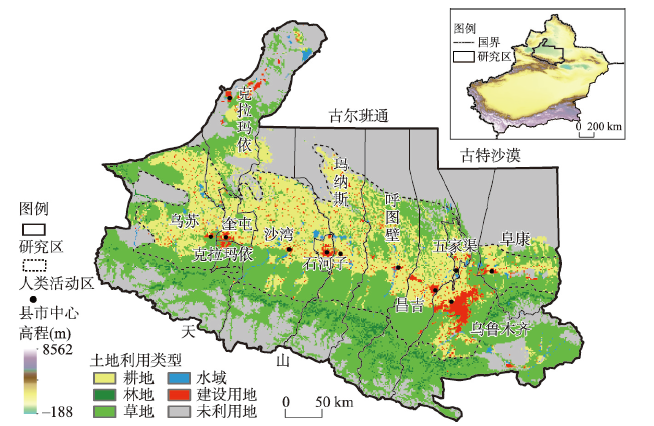
图1
研究区概况
注:基于新疆维吾尔自治区地理信息公共服务平台新S(2020)191号标准地图制作,底图边界无修改。
Fig. 1
Overview of the study area
2.2 数据来源
本文使用的数据主要包括MOD11C3地温数据、土地利用(Land Use, LU)数据、植被指数(Normalized Differential Vegetation Index, NDVI)数据、DMSP/OLS及NPP-VIIRS两类夜间灯光(Night Time Light, NTL)数据和人口分布(Population Distribution, PD)数据等(表1)。其中MOD11C3用于地温时空分异特征分析;LU、DMSP/OLS及NPP-VIIRS两类夜间灯光数据及PD数据用于HAI的表征并分析其时空分布特征;NDVI数据反映下垫面植被覆盖变化情况。
表1 数据来源
Tab. 1
| 数据 | 空间分辨率 | 年份 | 数据来源 |
|---|---|---|---|
| MOD11C3 | 0.05°×0.05° | 2000—2019 | ladsweb.nascom.nasa.gov/data/search |
| LU | 1 km×1 km | 2005、2010、2015、2018 | http://www.resdc.cn/Default.aspx |
| NDVI | 1 km×1 km | 2000—2018 | http://www.resdc.cn/Default.aspx |
| DMSP/OLS | 1 km×1 km | 2000—2013 | http://www.resdc.cn/Default.aspx |
| NPP-VIIRS | 500 m×500 m | 2013—2018 | https://ngdc.noaa.gov/eog/dmsp/downloadV4composites.html |
| PD | 1 km×1 km | 2000—2018 | https://landscan.ornl.gov/landscan-datasets |
2.3 研究方法
2.3.1 数据预处理
为了便于栅格计算和统计分析,所有数据均采用WGS-84坐标系及UTM投影,同时将MOD11C3和NPP-VIIRS数据重采样为1 km×1 km,以统一空间分辨率。
(1)MOD11C3:利用MRT软件批处理功能进行几何校正和重投影,并于ArcGIS10.3中进行镶嵌和裁剪,利用栅格计算器将K氏温度换算为摄氏温度。
(2)夜间灯光数据:① 去饱和处理。由于传感器辐射分辨率较低,DMSP/OLS数据在城市中心区存在大量亮度值饱和像元,致使亮度等级无法区分,需要进行去饱和处理。已有研究证明[38],NDVI与DMSP/OLS的数值在空间上呈负相关关系,故本文引入NDVI数据,分别采用比值模型(RNVI)、归一化模型(NDNVI)和改进型模型(MDNVI)3种降饱和指数模型[38]对DMSP/OLS亮度(NTL)进行去饱和处理,对比分析后所得结果与潘竟虎等[38]对夜间灯光数据去饱和效果类似,MDNVI对夜间灯光内部真实差异程度的刻画更细致,对影像灰度值饱和区域的处理效果最突出(图2),因此本文采用MDNVI模型对2000—2013年的DMSP/OLS数据进行降饱和处理。② DMSP/OLS与NPP-VIIRS整合。由于传感器参数、敏感程度及光谱响应方式不同,两类影像的灰度值数量级差距较大,无法直接同时使用。本文参考Li等[39]与杨任飞等[41]的数据整合方法,选择交叉年份2013年影像为样本数据,利用两类数据间的明显相关性,以DMSP/OLS数据为基准,用NPP-VIIRS数据拟合对应年份的DMSP/OLS数据,将得到的拟合公式应用于2014—2018年NPP-VIIRS数据即可完成DMSP/OLS与NPP-VIIRS数据的整合。
图2
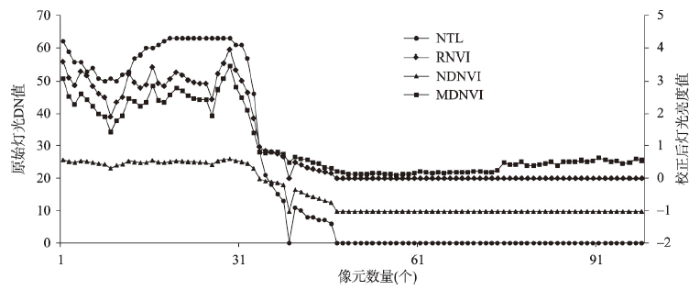
图2
2010年天山北坡纬向样带夜间灯光亮度值与降饱和指数值对比
Fig. 2
Comparison of night light brightness value and saturation index value of the zonal transect on the north slope of Tianshan Mountains in 2010
2.3.2 人类活动强度表征
人类活动强度体现人类活动对陆地表层的影响程度,“人类对陆地表层覆被利用、改造和开发”可被视为人类活动的主体[1],但却并非全部。单一土地利用数据难以表征多元、复杂和综合的人类活动。本文以土地利用数据为基本框架,辅以人口分布和夜间灯光数据,注重人类活动过程、状态和结果的全程动态描述,兼顾人类活动的宏观分布格局和微观等级差异的多尺度刻画,构建HAI表征模型:
式中:HAI为人类活动强度;N、P、L分别表示归一化处理后的夜间灯光亮度、人口与土地利用数据;a、b、c分别为NTL、PD和LU的权重。
表2 土地利用类型权重
Tab. 2
| 地类 | 耕地 | 林地 | 草地 | 水域 | 建设用地 | 未利用地 |
|---|---|---|---|---|---|---|
| 权重 | 0.30 | 0.05 | 0.05 | 0.05 | 0.55 | 0.00 |
2.3.3 斜率分析法
式中:θ为年际变化率;n为年数,本文取20;bi为时间序列值,2000—2019年依次取1~20;ai为第i年LST/HAI值。其中,θ < 0和θ > 0分别表示HAI与LST随时间递减和递增;θ绝对值越大,表明HAI与LST变化越快。
2.3.4 相关系数法
相关分析是一种分析变量间密切程度的统计学方法,通过计算年均HAI与LST之间的相关系数,能够有效反映变量间关联的密切程度,相关系数R取值区间为[-1, 1],公式如下:
式中:R为相关系数;n为年份数,取1~20;xi为归一化后的地表温度,yi为人类活动强度。其中,R < 0和R > 0分别表示HAI与LST呈负相关和正相关关系;R绝对值越大,表明相关性越强。本文按照-1 ≤ R ≤ -0.6、-0.6 < R ≤ -0.3、-0.3 < R ≤ 0、0 < R ≤ 0.3、0.3 < R ≤ 0.6、0.6 < R ≤ 1将相关系数分为强负相关、较强负相关、弱负相关、弱正相关、较强正相关、强正相关6个等级。
3 结果分析
3.1 天山北坡人类活动强度时空特征
图3
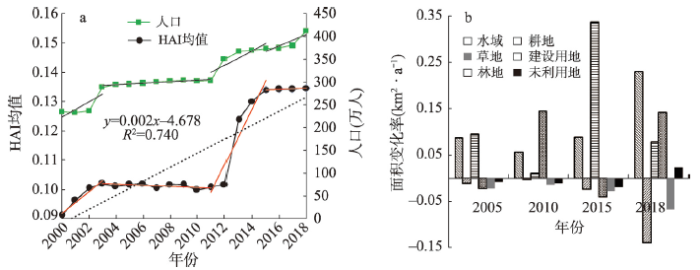
图3
2000—2018年天山北坡年均HAI与人口数量变化及各地类面积变化率
Fig. 3
Annual average HAI and population changes and area change rate of various land use types on the north slope of Tianshan Mountains, 2000-2018
研究区HAI呈中部高、南北低的空间分异特征(图4a)。南部山区、北部荒漠区和低山草原带为人类活动低、极低强度等级区域,面积占比76.2%;耕地主要为中低强度等级区,高强度与中高强度区域集中分布在城市中心区,如乌鲁木齐市、石河子市及克拉玛依市等城市HAI均在0.73以上。从空间分布来看,各县市HAI空间分布符合城市发展的圈层结构特征(图4b),表现为HAI及其变化率自中心城区向城市外缘及周边耕地、草地、荒漠逐渐衰减,以乌鲁木齐市最为典型;而中心城区外围的HAI变率高值区均为散布于耕地中的农村居民点。从HAI各等级面积占比的年际变化情况来看,人类活动极低强度等级(未利用地)面积占比由2000年的49.48%大幅减少至2018年的6.93%,其余各等级面积均呈增加趋势,以中低强度等级(主要为耕地,占比41.96%)最为显著。可见研究区人类活动范围不断扩张且对周边地区的辐射影响范围不断扩大,HAI变化遵循距离衰减规律。
图4
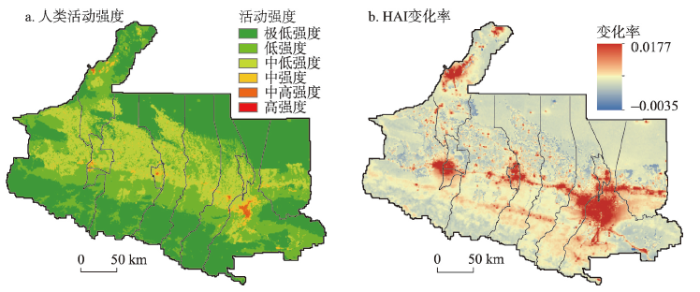
图4
2000—2018年天山北坡人类活动强度及变化率空间分布
Fig. 4
Spatial distribution of the intensity and change rate of human activity on the north slope of Tianshan Mountains, 2000-2018
3.2 天山北坡地表温度时空变化特征
研究期内天山北坡年均LST为7.18 ℃,最冷年和最热年分别为2003年(6.03 ℃)和2015年(8.21 ℃),2006年和2008年四季地温均高于多年均值。2019年研究区LST较2000年升高0.82 ℃,年均变化率达0.02 ℃·a-1,整体呈显著的波动上升趋势(图5a)且远强于全球升温幅度((0.0086±0.006) ℃·a-1 [47])。2000—2019年来春、夏、冬三季均呈升温趋势,以正距平年份居多,其中春季(0.068 ℃·a-1)的显著增温对研究区整体升温有绝对贡献(图5a),但春季地温负距平幅度却较大,多地频现极端低温[48];夏季地温相对稳定,而冬季波动较大,且近几年冬季增温幅度有增大趋势。
图5
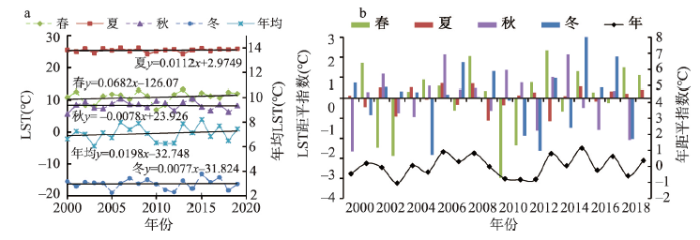
图5
2000—2019年天山北坡平均地表温度及季节变化与地温距平指数
Fig. 5
Annual average surface temperature, seasonal variation and anomaly index on the north slope of Tianshan Mountains, 2000-2019
研究区LST整体南低北高,空间分异显著。由研究区中部的经向剖面线LST统计发现(图6b),南部山区LST随海拔上升显著下降,相关系数达-0.84,呈显著负相关关系,直观体现了地温垂直地带差异。在山前冲积平原呈条带状分布的城区地温明显高于两侧的天然植被和耕地,最高可达15.23 ℃,存在明显的“热岛效应”,主要原因在于工业、交通及生活等人工热量排放,城区不透水地表小比热容、高蓄热和低散失的物理特性,以及大气污染物的“保温”作用。准噶尔盆地南缘荒漠区由于自身的小比热容,同时缺乏植被蒸散加湿和遮阴的降温作用,LST普遍较高。可见海拔与下垫面打破了研究区地温自南向北沿纬向逐渐升温的递变特征,其中人类活动作为重要“营力”通过改变土地利用方式在地温变化过程中扮演了重要角色。
图6
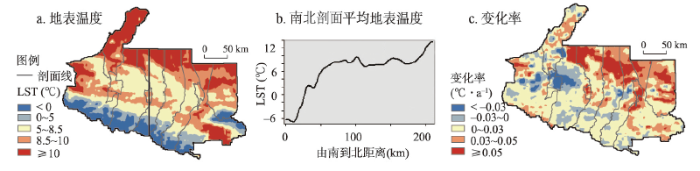
图6
2000—2019年天山北坡年均地表温度及年际变化率
Fig. 6
Average annual surface temperature and inter-annual rate of change on the north slope of Tianshan Mountains, 2000-2019
2000—2018年天山北坡LST整体上升幅度较大,变化率亦呈南低北高,空间差异显著(图6c),升温区面积约为降温区的4.6倍,地表裸露、植被稀疏的荒漠区和城市及周边区域主要呈现升温。准噶尔盆地南缘沙漠/荒漠区增温最为显著,变化率达0.09 ℃·a-1。人口密集的城乡建设用地多为不透水表面,因其更大的吸热率和更小的比热容使得地表升温迅速,加上生产生活废热排放和大气污染物的保温作用,成为区域热岛和升温主导区。例如乌鲁木齐周边县市、呼图壁及玛纳斯—石河子一带中心城区呈现明显的热区,部分地区LST变化幅度超过0.1 ℃·a-1。而奎屯—乌苏一带却存在显著的冷区,经统计发现,奎屯市NDVI自0.29升至0.62,市内大量天然草地转变为耕地,在以开荒和农业种植为主的人工干预下虽仍为植被,但长势更旺盛且覆盖度显著升高,地表反照率减小、土壤湿度增加,应是该区域降温的原因之一,也印证了植被覆盖和人类活动引起的下垫面物理及生物性质的转变与地温变化密切相关。尤其值得关注的是乌苏和阜康南部部分高海拔山区呈现较明显的升温趋势,地温的升高会加剧冰川消融,同时周边裸岩增多吸热加剧和下垫面反射率降低会使得地温进一步升高[49],正如王璞玉等[50]研究得出乌鲁木齐河源1号冰川在1959—2010年间冰川储量变化率高达-291.82 mm·a-1,便是该区域地表温度升高明显的很好佐证,冰川加速消融的风险提升将对研究区生态环境、工农业发展与社会经济造成深远影响[51]。
3.3 HAI与LST时空关联性分析
由于南部山区与北部荒漠区人迹罕至,故本文聚焦研究区中部的人类主要活动区域(图1)探究HAI与LST的时空关联。经空间相关分析发现,HAI与LST显著正相关,呈东强西弱分布(图7)。正相关区域面积占比94.6%,主要为耕地与建设用地,其中73.7%的区域为较强及强正相关,以乌鲁木齐市(0.78)与五家渠市(0.84)最为显著,阜康市及昌吉市中部人类活动强度明显增强(图4),呈强正相关。中北部地区由于耕地的大面积增加,内部农村居民点的扩张、各县市中心的城建用地大幅增加以及NTL升高等的共同作用,HAI与LST普遍呈较强正相关,而强正相关区域除昌吉市北部未利用地增多、五家渠市农村居民点小幅扩张外,其余土地利用类型并未发生明显变化(图7b),LST的升高应与人口的小幅增长(图7c)、夜间灯光亮度提升(图7d)存在正相关关系;南部大片草地区域多年来人口数量变动不大,但内部耕地与水域周边农村居民点面积增加,NTL普遍升高,HAI与LST也呈较强正相关。此外,乌鲁木齐市南部耕地扩张明显,农村居民点及城建用地增加,人口与NTL增幅也较大,HAI与LST相关性有增强趋势。
图7
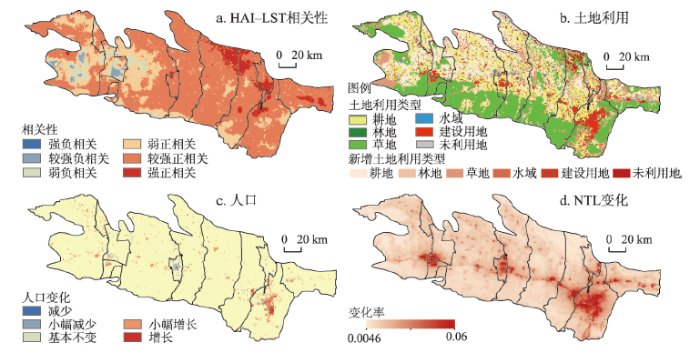
图7
2000—2018年天山北坡地表温度与人类活动强度相关性、土地利用变化、人口及NTL变化率
Fig. 7
The correlation between surface temperature and human activity intensity, land use change, population and NTL change rate on the north slope of Tianshan Mountains, 2000-2018
HAI与LST呈负相关的区域较少,仅位于乌苏市与奎屯市周边的小面积耕地与草地区域,在HAI小幅增强的情况下LST降温显著,呈显著负相关(图7)。结合人类活动在不同土地利用类型上的表现形式,并比对发现该区域多年来NDVI持续增大,植被的降温效应是致其负相关的主导因素。以奎屯市为例(图8),近20年面积占比42.78%的稀疏草地转化为覆盖度更高的耕地(图8e、8f),虽然地类发生改变但仅从天然植被变为人工植被,其本质没有变化,此外在人口数量基本不变的情况下夜间灯光强度小幅提升,故区域HAI仅为小幅增强。区域NDVI由0.30升至0.62(图8g、8h),LST降低了4.66 ℃,且同年耕地NDVI(0.73)比草地高0.25,LST则比草地低0.48 ℃,可见农作物的遮阴、吸热和增湿作用逐渐凸显从而显著降低地温。总体来看,以开荒和农业种植为主的人类活动使得人工管控下的农作物比天然植被生长更旺盛,覆盖度更高,加上农业灌溉等农事活动加强了降温效应。以此类推,农林种植栽培、城市绿化和植树造林等与植被相关的人类绿化养护活动,能够显著抑制地表温度的升高。
图8
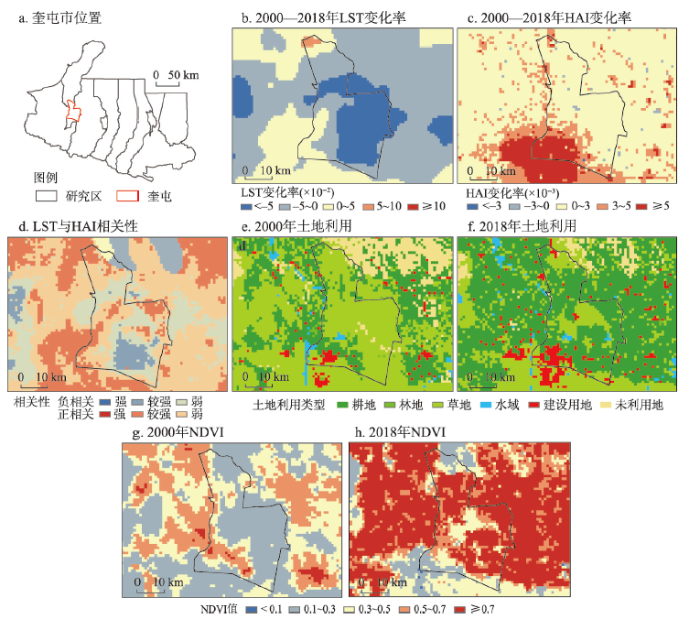
图8
2000—2018年奎屯市LST、HAI、土地利用类型及NDVI变化
Fig. 8
LST, HAI, Landuse, NDVI and their changes in Kuitun, 2000-2018
综上,天山北坡人类活动区内HAI与LST显著相关且呈增强趋势,其空间分异受到人类活动范围、表现形式、土地利用变化等因素的综合影响,其中人口不断增长、建设用地向耕地、草地的扩张与垦荒等导致下垫面性状改变的人类活动是研究区地温变化的主要原因,人口分布和夜间灯光的变化可支持LST时空变化的合理解释。
4 讨论
4.1 人类活动强度及表征方法
对于HAI的定义与表征,目前多基于土地利用单因子[1,9,52]或结合区域经济数据、景观类型、人口密度等数据[3]。其中包括刘采等[45]与Xu等[1]提出的建设用地面积当量因子法表征HAI,韩美等[9]基于不同土地利用类型的影响力与权重进行加权综合计算HAI,荣益等[53]通过区域景观类型的人为影响参数得到HAI,薛陈利等[54]以人口密度反映HAI的变化。无论是土地利用类型/景观类型或是人口密度的变化,都仅仅只能体现人类活动影响的某一部分,而无法展现人类活动的全景影像。在现有众多HAI研究中,采用生态系统综合人类扰动指数赋值方案(以下简称综合赋值方案),在中国国家尺度土地利用数据基础上研制的多期长江经济带的人类活动强度数据集[52]比较有代表性,综合赋值方案仅以土地利用数据作为度量HAI的依据。为对比不同方案的合理性和适用性,按综合赋值方案计算天山北坡HAI,并与本文结果分别归一化处理(图9),对比分析发现,由于综合赋值方案受各土地利用类型的面积占比的强烈影响[55],天山北坡草地(39.8%)、未利用地(33.7%)与耕地(20.7%)面积远大于建设用地(2.5%),在各地类赋值级别一定的情况下,赋值级别低但面积占比大的耕地与草地区域HAI偏高且区分度不高(图9b),而人类活动最集中、最强烈的建设用地HAI偏低。而本文结果不仅能够反映人类活动强度的宏观分布格局,还可细化不同地类内部HAI空间差异。正如其数据集作者所言,“综合赋值方案未能充分体现人类对生态系统的多方面扰动,是对HAI的保守估计”[52]。地广人稀、建设用地面积占比较小的情况在干旱、半干旱地区以及广大欠发达地区非常普遍。相比之下,本文将土地利用数据与人口分布数据、夜间灯光数据相结合,更全面地考虑了扰动生态环境的动力和状态、过程和结果,在城镇及周边区域的结果更为客观,不同地类间受人类活动扰动程度的刻画对比也更为合理,故本文构建的HAI表征体系相对更具普适性。
图9
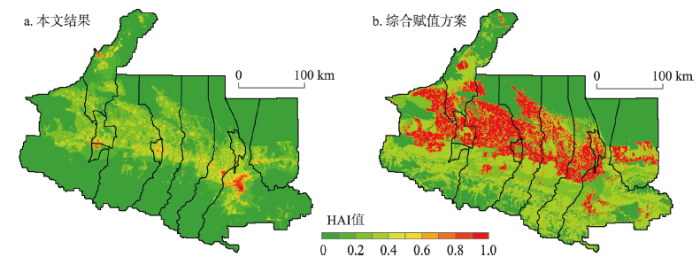
图9
2018年天山北坡人类活动强度不同表征方式结果对比
Fig. 9
Comparison of different representations of human activity intensity on the north slope of Tianshan Mountains in 2018
尽管许多学者对夜间灯光数据在HAI的表征方面均有积极的评价与期待[11,56],但目前仍处于探索的初步阶段。虽然段群滔等[4]、Sanderson等[5]与Venter等[6]已将夜间灯光数据引入人类活动强度研究,但大多仅采用DMSP/OLS数据,由于其在2013年后的数据缺失,导致所表征的人类活动强度指数存在时间上的不连续性与数据的低时效性问题,无法体现区域人类活动强度的近况与连续变化趋势。本文尝试使用连续夜间灯光数据、人口分布数据及土地利用数据结合的方式表征人类活动强度,可作为今后人类活动强度表征的参考和有益补充,当然,以夜间灯光数据为基础更好地表征人类活动强度的方法还需要在今后的研究中发掘。
4.2 人类活动对地表温度的影响
采用空间分区统计方法定量分析各阶段人类活动区土地利用变化区域的地温变化(图10)。因地类转换类型比较复杂,且面积较小的转换地类地温变化存在较大的不确定性,故本文仅统计面积占比最大的6种转化类型。由耕地、草地转化而来的建设用地因不透水面面积增加导致热岛效应增强[60-61],LST平均升温在2000—2005年最高,达到0.36 ℃·5a-1;2005—2010年建设用地区域表现的降温(-0.11 ℃·5a-1),是较大面积荒漠、裸地等未利用地转为建设用地导致,可见同为建设用地扩张,人类对不同地类的改造会对地温造成不同的影响。当人类活动表现为植被破坏[62]以致次生型未利用地增加、植被退化等的行为时,森林草地等自然植被被破坏、土地被弃耕而转为稀疏草地甚至未利用地,以致转为未利用地与草地区域普遍呈现升温状态。研究区新增的未利用地主要分布在北部荒漠区,因植被退化、土地弃耕等而裸露的地表含水率降低、比热容变小导致LST平均升温0.27 ℃·5a-1,在2010—2015年升温最显著(0.58 ℃·5a-1),是全球升温幅度的13.49倍。当人类活动表现为开荒与植被恢复等时,其伴随的荒漠、裸地减少与植被覆盖度的升高有显著的降温效果[25,63],本区新增耕地、林地的LST因植被覆盖度和含水率提高而分别降温0.15 ℃·5a-1和0.14 ℃·5a-1。新增水体因更大的比热容而降温,具有更好的区域温度调节能力。在地类保持不变的区域地温亦呈增温趋势,其中建设用地内部增温最显著,其人口数量对LST的影响最高为0.005 ℃·5a-1·千人-1,而归一化夜间灯光亮度每增加0.01,LST最多升高0.18 ℃。当人口数量和密度增大、夜间灯光亮度增强,意味着土地开发利用强度增大、社会经济活跃程度提升、人类生产生活和能源消耗的集约化水平提高,直接导致LST的显著升高[26⇓⇓-29]。当然,人类活动的类型与表现对LST的影响呈现各向异性和交叉渗透性,不同规模和形式的人类活动对地温影响的量化还需在今后的研究中进一步探索。
图10
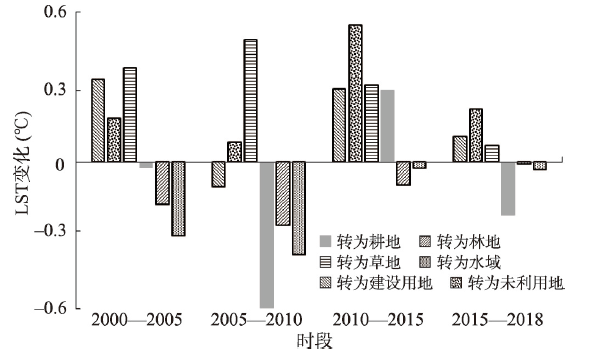
图10
土地利用方式转换区域地温变化
Fig. 10
Surface temperature change in land use type conversion area
5 结论与展望
基于夜间灯光、人口、土地利用数据表征人类活动强度指数HAI,并对2000—2018年天山北坡HAI与LST的时空分异特征及空间关联性进行了多尺度分析。主要结论如下:
(1)天山北坡人类活动强度较低,年均HAI为0.11,整体呈阶梯式缓慢上升趋势(0.0024 a-1),主要受建设用地和人口增加影响,且存在1~2 a滞后期;HAI中部高、南北低,并自中心城市带向外围耕地、草地、荒漠和山区逐渐减小;2000—2018年HAI整体呈小幅缓慢增长趋势,极低强度区域大幅减少,而中低强度区域显著扩大。
(2)2000—2019年天山北坡LST显著快速升温,年均LST为7.18 ℃,变化率(0.02 ℃·a-1)约为全球的2.33倍,春季的显著增温(0.068 ℃·a-1)对整体升温贡献最大;空间上呈南低北高特征,并受高程和植被覆盖度等下垫面性状的影响显著。其自南向北逐渐升温的分布特征在海拔与下垫面的影响下,打破了温度纬向递减规律,其中人类活动在地表温度变化过程中扮演重要角色。
(3)天山北坡人类活动区内HAI与LST显著正相关,整体呈东强西弱分布,其空间分异与相关性的表达受到人类活动范围、表现形式及土地利用变化等因素的综合影响,人口分布和夜间灯光的变化可支持LST变化的合理解释。农林种植栽培、城市绿化和植树造林等与植被相关的人为干预能够有效减弱人类活动造成的地表增温。
本文受夜间灯光与人口分布等数据时序限制,可能无法全面反映地温变化的波动周期和更长时间序列趋势,但其与HAI之间的空间关联却是显著而客观的,因此仍旧对人类活动影响的评估有较确切的解释作用。另外,本文主要考虑了人类活动对生态系统的直接扰动,未能体现全球尺度下的间接影响,如大气污染物的远距离扩散和传输、碳排放造成的全球基础温度的升高(非本地区直接造成)等。此外引入污染物浓度、交通出行、兴趣点、社交媒体等大数据应该能更广泛细致且多维度的改进HAI的表征方法,需在今后的研究中继续深入探讨。
参考文献
Human activity intensity of land surface: Concept, methods and application in China
DOI:10.1007/s11442-016-1331-y URL [本文引用: 7]
Key findings and assessment results of IPCC WGI Fifth Assessment Report
IPCC第一工作组第五次评估报告对全球气候变化认知的最新科学要点
Quantitative evaluation of human activity intensity on the regional ecological impact studies
区域生态效应研究中人类活动强度定量化评价
A dataset of human footprint over the Qinghai-Tibet Plateau during 1990-2015
1990-2015年青藏高原人类足迹数据集
Effects of climate change and human activities on net primary productivity in the Northern Slope of Tianshan, Xinjiang, China
气候变化和人类活动对天山北坡净初级生产力变化的影响
The human footprint and the last of the wild
DOI:10.1641/0006-3568(2002)052[0891:THFATL]2.0.CO;2 URL [本文引用: 2]
Sixteen years of change in the global terrestrial human footprint and implications for biodiversity conservation
and 2009
Response of wetland landscape pattern gradient to human activity intensity in Yellow River Delta
黄河三角洲人类活动强度的湿地景观格局梯度响应
Restoring urbanization process in China in the 1990s by using non-radiance-calibrated DMSP/OLS nighttime light imagery and statistical data
DOI:10.1007/s11434-006-2006-3 URL [本文引用: 1]
Overview of researches based on DMSP/OLS nighttime light data
DOI:10.11820/dlkxjz.2012.01.002
[本文引用: 3]

The stable lighttime data, the radiance-calibrated nighttime light intensity data and the non radiance- calibrated nighttime light intensity data are the three major products that have emerged in the field of the DMSP/OLS nighttime light data. It has several advantages, namely, easy acquisition of data, detection of low-intensity lights, unaffected by shadows, convenient provision of conditions for urbanization strength and its spatial- temporal difference analysis, and so on. At present, there are many research results on DMSP/OLS data, which mainly focus on city development, human activity and effect, eco-environment impact, but there are few studies on systematic results. This paper analyzed the existing researches on DMSP/OLS data, summarized and drew some conclusions based on the existing research results, the technical methods and the advantages and disadvantages of the methods, as well as explored the application prospect of DMSP/OLS nighttime light average intensity data. It predicted the future research trends of the data: (1) an in-depth study on processing methods of the data; (2) further expansion of data application; (3) the integrated study on DMSP/OLS data and other data models need to be deepened; (4) combine the existing research results, make further research on mechanism issues of geography phenomenon.
DMSP/OLS数据应用研究综述
DOI:10.11820/dlkxjz.2012.01.002
[本文引用: 3]
DMSP/OLS夜间灯光数据主要包括稳定灯光数据、辐射标定夜间灯光强度数据、非辐射标定夜间灯光强度数据3 种产品。该数据产品具有获取容易、能够探测低强度灯光、不受光线阴影影响、方便为城市化强度及其时空分异分析提供条件等优点。目前,关于DMSP/OLS数据的研究成果已有很多,主要集中于城市发展研究、人类活动及效应研究、生态环境影响研究等方面,但对成果的系统归纳总结性研究却几乎没有。基于此,本文分析比较了现有DMSP/OLS 数据研究实例,针对已有成果研究目的、技术方法以及方法优缺点等进行归纳总结,探索DMSP/OLS夜间灯光平均强度数据的应用前景。最后,总结了该数据的未来研究趋势:①对数据本身处理方法深入研究;②数据应用领域应进一步扩展;③DMSP/OLS数据与其他数据模型的集成研究应进一步深化;④将现有研究成果结合,进一步研究地理现象机制问题。
Extracting the dynamics of urban expansion in China using DMSP-OLS nighttime light data from 1992 to 2008
DOI:10.1016/j.landurbplan.2012.02.013 URL [本文引用: 1]
Night-time light derived estimation of spatio-temporal characteristics of urbanization dynamics using DMSP/OLS satellite data
DOI:10.1016/j.rse.2014.11.022 URL
Spatial distribution of population data based on nighttime light and LUC data in the Sichuan-Chongqing Region
基于夜间灯光与LUC数据的川渝地区人口空间化研究
DOI:10.12082/dqxxkx.2018.170224
[本文引用: 1]
高精度的人口空间分布数据是开展小尺度人口活动变化规律研究的关键数据。夜间遥感影像对于反映人类社会活动具有独特的能力,因而被广泛的应用于社会经济领域的空间数据挖掘。本研究以DMSP/OLS夜间灯光数据、NPP/VIIRS夜间灯光数据、常住人口统计数据、土地利用数据为数据源,在县级尺度上建立逐步回归模型,构建川渝地区人口空间分布数据;并随机抽取研究区内500个乡镇,以常住人口统计数据为真实数据,对人口空间化结果进行精度检验。结果表明:① 2种夜间灯光数据与人口均有较高的相关性,相关系数均在0.76以上,NPP/VIIRS夜间灯光数据与人口的相关性要高于DMSP/OLS,且受拟合模型的影响不大。② 与人口相关性较高的土地利用类型有多种,耕地、林地对人口空间分布也有影响,在建模时不应只考虑建成区。③ 在2种夜间灯光数据分别与土地利用与土地覆被数据(Land Use/ Land Cover, LUC)结合时,使用DMSP/OLS夜间灯光数据和NPP/VIIRS夜间灯光数据得到的逐步回归模型的复相关系数R<sup>2</sup>分别为0.796、0.817,模型拟合率较高,而基于NPP/VIIRS夜间灯光数据得到的人口空间化结果分辨率(500 m)相比DMSP/OLS提高了一倍(1 km),中心城区与周边城区人口密度变化更加自然,更符合实际人口分布情况。④ 与LUC数据结合时,使用NPP/VIIRS夜间灯光数据得到的人口空间化结果精度要高于DMSP/OLS夜间灯光数据,表明NPP/VIIRS夜间灯光数据相比DMSP/OLS更适用于人口数据空间化研究。
Observations of the earth using nighttime visible imagery
Spatio-temporal simulation and differentiation pattern of carbon emissions in China based on DMSP/OLS nighttime light data
基于DMSP/OLS数据的中国碳排放时空模拟与分异格局
Variation characteristics of ground surface temperature in northern piedmont of Tianshan Mountains during 1963-2010
天山北麓1963-2010年0 cm最高与最低地表温度变化特征
Estimation of air temperature from remotely sensed surface observations
DOI:10.1016/S0034-4257(96)00216-7 URL [本文引用: 1]
Verification of high-resolution land surface temperature by blending ASTER and MODIS data in Heihe River Basin
黑河流域ASTER与MODIS融合生成高分辨率地表温度的验证
Spatio-temporal pattern and evolution of the urban thermal landscape in metropolitan Beijing between 2003 and 2017
2003-2017年北京市地表热力景观时空分异特征及演变规律
DOI:10.11821/dlxb201903006
[本文引用: 1]
利用2003-2017年MODIS地表温度数据,分别从数量、形状和结构角度揭示北京市不同季相和昼夜间地表热力景观时空分异特征,并进一步通过热力等级变化图谱及质心迁移轨迹揭示城市热力景观空间演变规律,探究热力景观等级转换生态过程。结论如下:① 城市地表热力景观季节和昼夜空间特征差异显著;② 中温区在城市热环境中占主导地位。白天中温区是最不稳定的热力景观等级;夜间次低温区和次高温区不稳定性增加;③ 地表热力景观等级变化以稳定型占主,反复变化型和前期变化型次之。地表热力景观等级通常呈现逐级递增或递减规律,山区呈现逐级降温趋势,北部城郊—山地交错地带表现出次低温和中温的反复转向,南部地区有一定的升温趋势;④ 2003-2017年高温区面积增大且质心向城市中心集中,低温区质心向城市外围扩散。生态涵养发展区对北京市地表热力景观质心迁移贡献率最高。热力景观时空分异特征及演变规律可为有效缓解城市热岛效应提供管理决策支持。
Evaluation of MODIS land surface temperature data to estimate air temperature in different ecosystems over Africa
DOI:10.1016/j.rse.2009.10.002 URL [本文引用: 1]
Satellite remote sensing research and impact factor analysis of diurnal variation and seasonal characteristics of heat island in Beijing and its surrounding areas
北京城市及周边热岛日变化及季节特征的卫星遥感研究与影响因子分析
Remote sensing of the urban heat island effect across biomes in the continental USA
Spatiotemporal response of land surface temperature to land use/cover change in Yanqi Basin, Xinjiang
新疆焉耆盆地地表温度时空分布对LUCC的响应
Spatiotemporal variation characteristics of land cover and land surface temperature in Mohe County, Heilongjiang Province
黑龙江省漠河地区土地覆被与地表温度时空变化特征研究
The impact of surface cover and population density on urban land surface temperature: A case study of Zhengzhou city
地表覆被与人口密度变化对城市地表温度的影响分析: 以郑州市为例
On impacts of land use, population density and altitude on the urban heat island
土地利用、人口密度及海拔对城市热岛的影响
Spatial relationship of urban development to land surface temperature in three cities of southern Fujian
DOI:10.11821/dlxb202103006
[本文引用: 2]
Exploring the influence mechanism of expansion for urban areas on thermal environment is significant for improving urban ecological environment. In this study, nighttime light (NTL) can be regarded as an evidence of urban development. Based on Landsat remote sensing data, DMSP/OLS nighttime light data and NPP/VIIRS nighttime light data of Xiamen, Zhangzhou and Quanzhou in southern Fujian during 1996-2017, this study applied the overall coupling model and coordination model to discuss the spatio-temporal coupling and coordination relationship between urban development and land surface temperature (LST) distribution. Additionally, the spatial response law was analyzed by standard deviation ellipse, bivariate spatial autocorrelation and landscape index. The results show that during 1996-2017, the spatial distribution patterns of LST and NTL show that urban development is closely related with factors such as geographical location and terrain. In the western inland areas with high elevations, forests are obviously concentrated with relatively low LST, while in the eastern plain areas, more urban areas are distributed with relatively high LST. In the three cities, the overall coupling situation of NTL and LST is constantly strengthening, and the proportion of coordination for NTL and LST is gradually increasing. In the early stage of urban development, the influence of NTL on LST is hysteretic. In the late stage, the influence of NTL on LST is in advance. There is a positive correlation between NTL and LST, and a spatial spillover effect is obvious. The correlation coefficient and bivariate spatial autocorrelation Moran's I value gradually increase, indicating that NTL has an increasing influence on the change of LST. The HH (High-High)-type and LL (Low-Low)-type agglomeration areas continue to expand. Influenced by the trend of integrated development of the three study cities, HH-type agglomeration area is gradually concentrated in regions connecting the cities, such as Xiamen, Jinjiang, Shishi and central urban area of Zhangzhou. The influence of urban development on LST is related to the development condition of itself. Compared with Zhangzhou and Quanzhou, NTL has a more significant influence on the LST in Xiamen. The study results provide a scientific guidance for the optimization of thermal environment in the three cities of southern Fujian.
闽南三市城镇发展与地表温度的空间关系
DOI:10.11821/dlxb202103006
[本文引用: 2]
基于厦门、漳州、泉州三市1996—2017年的Landsat遥感数据与夜间灯光数据,应用总体耦合态势模型及协调性模型探讨了城镇发展与地表温度的时空耦合规律,并运用标准差椭圆、双变量空间自相关及景观指数分析两者之间的空间响应规律,结果表明:1996—2017年,闽南三市表征城镇发展变化的夜间灯光与地表温度的空间分布呈现出与地形、区位等因素的空间耦合性。三市夜间灯光与地表温度的总体耦合态势不断加强,协调类型逐渐增多;城镇发展早期,夜间灯光对地表温度的影响存在滞后性,在城镇发展后期,夜间灯光则对地表温度的影响呈超前性;夜间灯光与地表温度呈正相关关系,空间溢出效应明显。夜间灯光对地表温度的正向影响逐渐加强,其与地表温度的HH、LL聚集不断扩张;HH集聚连片趋势明显。厦门的城镇发展对地表温度的影响更显著,而在泉州、漳州则较弱。本文可为闽南三市热环境优化提供科学指导。
The characteristics and driving forces of summer urban heat island in Guanzhong Plain urban agglomeration
关中平原城市群夏季城市热岛特征及驱动力
Estimating mean daily surface temperature over the Tibetan Plateau based on MODISLST products
基于MODISLST产品估算青藏高原地区的日平均地表温度
Preliminary study on signal, impact and foregorund of climatic shift from warm-dry to warm-humid in northwest China
西北气候由暖干向暖湿转型的信号、影响和前景初步探讨
Discussion on the characteristics and trend of climate transition from warm and wet in western China
中国西北气候由暖干向暖湿转型的特征和趋势探讨
Spatial-temporal characteristics of land surface temperature in Tianshan Mountains area based on MODIS data
Based on the MODIS/MOD11A2 data from 2001 to 2013, this paper researched the characteristics of land surface temperature (LST) of Tianshan Mountains area. The results indicated that the average of LST in the study area was 1.73 °C, and LST was much higher in the east than in the west. The inter-annual variation range of LST in the northwest was significantly large than in other regions, with the largest above 0.55 °C in some areas. The LST tended to slowly increase with time, and the increase rate was 0.147 °C. a-1. It showed a significant seasonal difference, and the fluctuation of winter was significantly larger than in other seasons with the coefficient of variation reaching 12.7%. The LST difference of day time was greater than that at night, and that in summer was greater than in other seasons. The LST differed with land use types, and the fitted results were inconsistent between the LST and NDVI. With the increase of NDVI of woodland and grassland, the LST decreased dramatically. The LST of construction land and cropland under the influence of human activities had higher sensitivity with NDVI than other land types.
基于MODIS数据的天山区域地表温度时空特征
Influence of precipitation distribution on desert vegetation of northern piedmont, Tianshan Mountains: Analysis based on daily NDVI and precipitation data
天山北坡前山带降水分布型对荒漠植被的影响: 基于逐日降水数据和NDVI的分析
Vegetation coverage dynamics in northern slope of Tianshan Mountains from 2001 to 2015
2001-2015年天山北坡植被覆盖动态变化研究
Vegetation change during the last 10 years derived from satellite image in the north slopes of the Tianshan Mountains
基于AVHRR/NOAA影像的天山北坡近10a植被变化
Response of climate changes on vegetation cover in north of Tianshan Mountains evaluates using multiple time scales
遥感分析天山北部植被覆盖对气候变化的多时间尺度响应
Estimate and spatio-temporal dynamics of electricity consumption in China based on DMSP/OLS images
DOI:10.11821/dlyj201604003
[本文引用: 3]
Nighttime light (NTL) data from the Defense Meteorological Satellite Program/Operational Linescan System (DMSP/OLS) are able to provide information on nighttime luminosity, a correlation of the built environment and energy consumption. NVI (Nighttime-light Vegetation Index), RNVI (Ratio Nighttime-light Vegetation Index), DNVI (Difference Nighttime-light Vegetation Index), NDNVI (Normalized Difference Nighttime-light Vegetation Index), SANVI (Soil-adjusted Nighttime-light Vegetation Index) and MDNVI (Modified Difference Nighttime-light Vegetation Index) were used to compensate for the shortage of DMSP/OLS data. DMSP/OLS night lights data, MODIS NDVI products, China GIS database and socio-economic statistical data are also taken into consideration. An electricity consumption estimation model is used to obtain a figure for electricity consumption from 2000 to 2012. Lastly, we divide electricity consumption into four ratings and analyze the spatio-temporal patterns by using ESDA method. Results are as follows: All of the indexes can compensate the shortage of DMSP/OLS data, among which MDNVI is the best model. We reduced spatial overflow effect of night lights data by using MDNVI model. Then we built a linear regression model of electricity consumption by regression analysis, and we used it for DMSP/OLS data to retrieve China's electricity consumption spatial layout. We compared the MRE (mean relative error) between the result and related research, which proves that our result has a lower MRE and a higher accuracy. Finally we find a way to obtain China electricity consumption data from 2000 to 2012 quickly and effectively. Electric consumption grew quickly in China from 2000 to 2012; on the whole, maximum electric consumption increased from 6.79 M kW?h to14.82 M kW?h. We discovered, using downscaling analysis, electricity consumption showed significant differences within regions. We analyzed electricity consumption levels, Moran's I and LISA cluster in the study area from 2000 to 2012 by using statistical data. Results showed that generating capacity and electricity consumption of 31 provinces have a strong spatial correlation. Gradually formed four "HH" cluster areas, namely Langfang-Tianjin, the Pearl River Delta, Shanghai-Hangzhou-Nanjing and the West Bank of the Taiwan Straits from 2000 to 2012. Spatial agglomeration of electricity consumption at county scale is significant, with "HH" clusters mainly located in Beijing-Tianjin, the Yangtze River Delta, Pearl River Delta, Shandong Peninsula, Changchun-Harbin-Dalian area, and North Tianshan Mountains area. The "LL" pattern shows a gradual trend moving from the south-eastern edge of the Qinghai-Tibet Plateau to the Tibetan Plateau. The index proposed here combines information from both DMSP/OLS NTL data and MODIS NDVI data for more detailed characterizations in nighttime luminosity. Our assessments confirm its ability to reduce the NTL saturation. Moreover, its simplicity enables rapid characterization and monitoring of electricity consumption.
基于夜间灯光影像的中国电力消耗量估算及时空动态
DOI:10.11821/dlyj201604003
[本文引用: 3]
提出夜间灯光降饱和指数模型,以中国大陆为研究对象,基于DMSP/OLS夜间灯光数据、MODIS NDVI产品、基础地理信息数据及社会经济统计数据,构建电力消耗估算模型,定量估算了2000-2012年电力消耗量,并采用空间统计分析方法,从不同时间、空间角度对省级、地级和县级单元的电力消耗量变化趋势和空间集聚程度进行分析。结果表明:夜间灯光降饱和指数模型能较好地降低夜间灯光的数据饱和和溢出,其中MDNVI模型的效果最好。从县级尺度电力消耗变化趋势的显著性来看,无明显变化区域主要出现在青藏高原,迅猛增长型多数分布在京津冀、长三角、珠三角和中东部省会城市。
The vegetation adjusted NTL urban index: A new approach to reduce saturation and increase variation in nighttime luminosity
DOI:10.1016/j.rse.2012.10.022 URL [本文引用: 1]
Intercalibration between DMSP/OLS and VIIRS night-time light images to evaluate city light dynamics of Syria's major human settlement during Syrian Civil War
DOI:10.1080/01431161.2017.1331476 URL
Integrating DMSP/OLS and NPP/VIIRS nighttime light data to the application research of urban agglomeration growth process
[D].
基于DMSP/OLS与NPP/VIIRS整合数据的城市群发育过程研究
[D].
Impacts of human activity on coastal wetland land cover changes related to reclamation on the south coast of Hangzhou Bay
杭州湾南岸围垦土地人类活动强度及对滨海湿地覆被类型的影响
Quantitative assessment of human activity intensity in the Heihe Catchment
黑河流域人类活动强度的定量评价
Spatiotemporal characteristics of human activity intensity and its driving mechanism in Hainan province from 1980 to 2018
DOI:10.18306/dlkxjz.2020.04.004
[本文引用: 1]
Quantitative assessment of regional human activity intensity can reflect the relationship between people and environment, which can provide a scientific basis for landuse-related decision making and eco-environment construction. Based on the land use/land cover data with 1 km resolution, we quantitatively evaluated the spatial-temporal features of human activity intensity in Hainan Island from 1980 to 2018. On this basis, we analyzed the overall change and spatial correlation of human activity intensity and explored its driving mechanism. The results showed that: 1) The main types of land use were woodland and farmland in the study area in 2018, accounting for 62.85% and 25.27%, respectively. Only bulit-up land increased sharply, and areas of all other land use types reduced from 1980 to 2018. The areal reductions of farmland and grassland were the largest and the decreases were 397.81 km2 and 303.02 km2, respectively. 2) Human activity intensity gradually increased from 10.54% (1980) to 12.86% (2018), risen by 22.01%. Before 2000, it was relatively stable and after that, it grew fast. 3) The spatial distribution of human activity intensity was high in the coastal areas and low in the central part of the island. Human activity intensity showed significant spatial agglomeration effect and the hotspots were concentrated mainly in areas of rapid urban development, such as Haikou City and Sanya City. 4) The human activity intensity in Hainan Island was mainly driven by government policy, rapid population growth, economic development, and so on.
1980-2018年海南省人类活动强度时空变化特征及其驱动机制
DOI:10.18306/dlkxjz.2020.04.004
[本文引用: 1]
定量评价区域人类活动强度,可反映人与环境关系的变化,为土地利用政策制定和生态环境建设提供科学依据。论文基于1 km分辨率的土地利用/土地覆被数据,从总体变化、空间自相关性及影响因素等方面对海南岛1980—2018年人类活动强度进行分析研究。结果表明:① 2018年,海南岛土地利用/土地覆被类型以林地和耕地为主,分别占研究区总面积的62.85%和25.27%。1980—2018年间,仅有城乡、工矿和居民用地面积出现大幅度增加,其他类型面积均减少,其中耕地和草地减少的面积较大,分别减少397.81 km<sup>2</sup>和303.02 km<sup>2</sup>。② 1980年海南岛人类活动强度为10.54%,2018年达到12.86%,增长了22.01%。2000年以前基本保持不变,2010年以后增长迅速。③ 近40 a间海南岛人类活动强度空间分布格局具有四周高、中间低的特点,并具有显著的空间集聚特征,人类活动强度变化热点地区主要集中在海口市、三亚市等城市建设迅速地区。④ 海南岛人类活动强度主要受政府政策、人口增长、经济发展等因素的驱动。
Population distribution and regional economic development in Economic Belt at north slope of Tianshan
天山北坡经济带人口分布与经济发展研究
Improvement of surface temperature and warming analysis
[D].
全球地表温度数据的改进以及增暖分析
[D].
Evaluation index of cold wave intensity at a single station and its application in Urumqi
单站寒潮降温过程强度评估指标及其在乌鲁木齐市的应用
Analysis on responses of land surface temperature on the northern Tibetan Plateau to climate change
藏北高原地表温度对气候变化响应的初步分析
Analysis of the relation between glacier volume change and area change in the Tianshan Mountains
天山冰川储量变化和面积变化关系分析研究
Evaluation on glaciers ecological services value in the Tianshan Mountains, Northwest China
DOI:10.1007/s11442-019-1586-1 URL [本文引用: 1]
Land use-based human activity intensity along the Yangtze River Economic Belt, China (1970s-2015)
基于土地利用的长江经济带1970s末至2015年人类活动强度数据集
Ecosystem service values and spatial differentiation changes during urbanization: A case study of Huanghua City
城镇化过程中生态系统服务价值变化及人类活动影响的空间分异: 以黄骅市为例
Ecological quality and its relationships with human activities in China-Laos railway economic belt
DOI:10.13287/j.1001-9332.202102.011
PMID:33650374
[本文引用: 1]
Regional ecological quality is largely affected by human activities, which restricts the sustainable development of regional economy. Taking the China-Laos railway economic belt as an example, we investigated the effects of human activities on ecological quality. The remote sensing images of 1999, 2009 and 2019 were selected to calculate remote sensing ecological index (RSEI). Spatial autocorrelation statistics and local statistics were used to explore the spatial-temporal variations of ecological quality in the study area. Combined with the population density in the same period, a geographically weighted regression model was constructed to quantitatively analyze the ecological effects of different human activity intensities in the study area. The results showed that the ecological quality in the study area presented a trend of increasing firstly and then decreasing later from 1999 to 2019, and that the mean value of RSEI varied from 0.645 (1999) to 0.738 (2009) and then decreasing to 0.721 in 2019. Specially, the ecological quality fluctuated more apparently in the midlands. The results of fitting population density and ecological quality based on geographical weighted regression model (GWR) were significantly better than that of least square method. of different periods based on GWR was higher than 0.7 and the fitting effect was stable. The fitting degree of GWR in 2019 was the best ( was 0.785), and in 1999 and 2009 were 0.726 and 0.754, respectively. The ecological quality along the China-Laos railway south area (such as Vientiane) was more sensitive to human activities, with most of these places belonged to moderately sensitive regions. For the highly, moderately and lowly ecological sensitive regions, every 10, 100, 1000-fold increases in population density would lead to a decrease of 0.2, 0.4 and 0.6 to the mean value of RSEI in turn. The development of economic belt would increase population density. During the planning and layout of economic belt, human activities should be controlled to avoid the deterioration of ecological quality in the potential and current sensitive regions.
中老铁路经济廊带生态质量及其与人类活动的关系
Disturbance impacts of land use change on biodiversity conservation priority areas across China: 1990-2010
DOI:10.1007/s11442-015-1184-9 URL [本文引用: 1]
Review and prospect of application of nighttime light remote sensing data
DOI:10.18306/dlkxjz.2019.02.005
[本文引用: 1]
In remote sensing research, night light remote sensing as an important branch of active development has attracted increasingly more attention from the fields of natural and social science research in recent decades. Different from traditional daytime optical satellite remote sensing that obtains ground object radiation information, nighttime light remote sensing is the acquisition of visible-near-infrared electromagnetic information transmitted from the Earth's surface under cloud-free conditions at night. Compared to the ordinary satellite remote sensing images, ground light intensity information recorded by the night light images directly reflects the difference of human activity. Therefore, it is widely used in urbanization research, extraction of impervious surfaces, estimation of socioeconomic indicators, major events assessment, ecological environment assessment, and other fields. At present, although research results based on nighttime light data are continuously accumulating, there is a general lack of systematic review of these results and the current reviews suffer from incomplete coverage and poor timeliness. Therefore, this article summarizes the research results of nighttime light data in recent decades and examines them from the aspects of data processing and technical approaches, urbanization application research, and parameterization. Finally, we identify the following three research hotspots: multi-source data fusion, application expansion, and short-period surface light monitoring.
夜间灯光遥感数据应用综述和展望
DOI:10.18306/dlkxjz.2019.02.005
[本文引用: 1]
在遥感应用研究中,夜间灯光遥感作为发展活跃的一个重要分支,近年来受到越来越多来自自然科学领域和社会经济领域的关注。与传统的光学遥感卫星获取地物辐射信息不同,夜间灯光遥感是获取夜间无云条件下地表发射的可见光-近红外电磁波信息。相比于普通的遥感卫星影像,夜间灯光遥感所使用的夜间灯光影像记录的地表灯光强度信息更直接反映人类活动差异,因而被广泛应用于城市化进程研究、不透水面提取、社会经济指标空间化估算、重大事件评估、生态环境评估等领域。目前,虽然基于夜间灯光数据的应用研究成果正在不断积累,但对成果的系统性总结、整理的研究目前存在着覆盖面不全、时效性不强等不足。基于此,论文通过对近几十年来有关夜间灯光数据的研究成果的详细梳理,从数据处理与技术方法、应用研究等方面进行归纳总结。最后,文章从多源数据融合、应用领域拓展和短周期地表灯光监测3个方面指出了未来的研究热点。
Relationship among land surface temperature and LUCC, NDVI in typical karst area
DOI:10.1038/s41598-017-19088-x URL [本文引用: 1]
Anthropogenic influence on coastal environment using satellite cloud-based platform
[D].
利用遥感卫星数据云平台研究人类活动对沿海环境的影响
[D].
Study on the spatial characteristic of land surface temperature and the relationship between the spatial characteristic of land surface temperature and land surface characteristic in Beijing area
[D].
北京地区地表温度空间分布特征及其与下垫面关系研究
[D].
Estimation of surface air temperature from MODIS land surface temperature and its application to the study of urban heat island in the East China metropolitan area
[D].
基于MODIS地表温度的气温估计方法及其在中国东部城市群热岛效应研究中的应用
[D].
Remote sensing monitoring of land use change impacts on land surface temperature
[D].
城市土地利用变化对地表温度影响的遥感监测
[D].
Discussion on the causes, distribution and reconstruction and utilization of unused land in Liaoning Province
辽宁省未利用土地的成因、分布及其改造利用的探讨
The quantitative relationship between land surface temperature and land cover types based on remotely sensed data
基于遥感数据的城市地表温度与土地覆盖定量研究
