

1 引言
祁连山及其周边地区分布着大量河湖相沉积、冰芯、孢粉、树轮等古气候记录。使用良好的气候记录,结合CRU(Climatic Research Unit, CRU)数据和PMIP3/CMIP5(The Third Phase of Palaeoclimate Modeling Intercomparison Project/The Fifth Phase of the Coupled Model Intercomparison Project, PMIP3/CMIP5)计划的古气候模型模拟数据以及现代观测技术得到的气象要素数据[7],可以分析祁连山地区典型历史暖期和现代暖期的气候格局。选取距现在最近,影响最大,千年尺度的中全新世暖期(Middle Holocene, MH)和百年尺度的中世纪暖期(Medieval Warm Period, MWP)两个时段,分别探讨祁连山地区干湿变化对暖期的响应机制和气候差异,并与现代暖期进行相似性分析,从而预测该地区未来的干湿趋势。研究有助于理解祁连山地区原生生态环境的变化韵律,为祁连山生态修复提供科学支撑。
2 研究区概况
祁连山是中国西北高大山系之一(图1),呈西北—东南走向,西与阿尔金山脉相连,东与秦岭、六盘山相接,南临柴达木盆地,北侧是河西走廊,范围94°10′E~103°04′E、35°50′N~39°19′N,海拔4000~6000 m。地处青藏高原区、西北干旱区、东部季风区的交汇地带,位于季风水汽输送通道上,中西部受西风环流控制,东部受东南季风和西南季风影响,同时与青藏高原环流系统交汇[8]。夏季来自季风的湿润气流北进西伸,冬季受内蒙古干冷空气、西北寒冷气流波及,使得祁连山地区气候响应敏感,降水变率大[5]。降水又与所处经纬度、地形坡向和坡度等因素相关,季节和年际变化较大,普遍从东到西降水减少。山区随海拔升高,温度递减,雨量递增,太阳总辐射量增加,表现出明显海拔地带性[8]。
图1
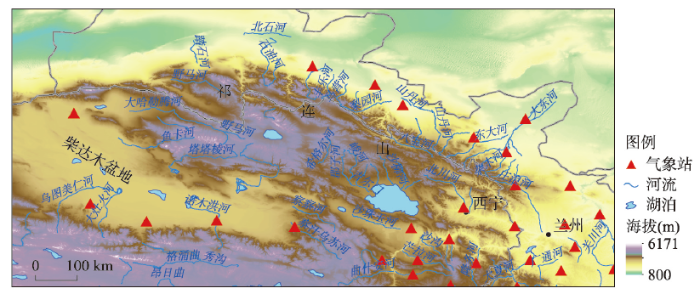
图1
祁连山及周边地区气象站点分布
Fig. 1
Distribution of meteorological stations in the Qilian Mountains
3 数据与方法
3.1 现代观测
为了更加直观分析该地区干湿情况,基于研究区的降水和蒸发数据,以降水减蒸发(Annual precipitation-annual evaporation, P-E)作为湿度指数,解释对应时段的干湿变化。湿度指数越大,地区越湿润,反之湿度指数越小表明气候越干旱。结合一元回归分析法进行趋势分析,可以得到祁连山地区现代暖期气温降水蒸发以及湿度变化。
3.2 古气候记录与模型
古气候模拟比较计划(PMIP)是一项利用气候模型来理解过去气候变化和预估未来气候变化的国际计划,其第三阶段(PMIP3)进一步加强了与第五次国际耦合模式比较计划(CMIP5)的联系,为AR5提供了大量的科学分析事实[7]。为研究祁连山地区中全新世暖期和中世纪暖期的基本干湿状况,本文使用PMIP3/CMIP5计划的古气候模型,各时期模型使用情况如表1所示。所有模型数据均下载自ESGF(Earth System Grid Federation)联盟(
表1 模型统计
Tab. 1
| 模型名称 | 分辨率(1°×1°) | MH | MWP/LIA | PI |
|---|---|---|---|---|
| bcc-csm1-1 | 64×128 | √ | × | √ |
| CCSM4 | 192×288 | √ | × | √ |
| CNRM-CM5 | 128×256 | √ | × | √ |
| CSIRO-Mk3-6-0 | 96×192 | √ | × | √ |
| CSIRO-Mk3L-1-2 | 56×64 | √ | √ | √ |
| EC-EARTH-2-2 | 160×320 | √ | × | × |
| FGOALS-g2 | 60×128 | √ | × | √ |
| FGOALS-gl | 40×72 | × | √ | × |
| FGOALS-s2 | 108×128 | √ | × | √ |
| GISS-E2-R | 89×144 | √ | √ | √ |
| HadCM3 | 72×96 | × | √ | × |
| HadGEM2-CC | 144×192 | √ | × | × |
| HadGEM2-ES | 144×192 | √ | × | × |
| IPSL-CM5A-LR | 96×96 | √ | √ | √ |
| MIROC-ESM | 64×128 | √ | √ | √ |
| MPI-ESM-P | 96×192 | √ | √ | √ |
| MRI-CGCM3 | 160×320 | √ | √ | √ |
祁连山地区及其周边分布着大量河湖相沉积、风成沉积、冰芯、树轮、孢粉等古气候记录(表2、表3),总有机碳(TOC)、总氮(TN)、碳酸盐含量(CaCO3)、δ18O、δ13C、蒿科与藜科植物孢粉含量比值(A/C)、碳氮比(C/N)、湖泊盐度(Salinity)、湖泊水位高度(Lake level)、磁化率(MS)、孢粉(Pollen)等代用指标记录着地质历史时期气候变化,可以有效指示着区域干湿变化。本文收集多条古气候记录,通过数据处理分析,使用代用指标判断记录指示一个时期一个地区的干湿等级。将一个地点干湿等级定义为同一地点同一时期多条气候指标指示的平均干湿状况,干湿等级越偏负表明这一时期该地点越湿润,反之越干。以中全新世暖期为例,先选取研究区一条古气候记录,计算代理指标在中全新世暖期的算术平均值,然后与同一指标对应工业时期数据的A±SD(算术平均值±标准偏差)进行比较,根据记录指示的干湿状况,判断中全新世暖期该记录指示的湿度,干湿等级分为湿润(W = -2)、半湿润(M = 0)和干旱(D = 2)。例如,一个地点共3个代理指标,两条指示干旱,一条指示半湿润,则该地点的湿度等级为1.33 = (2×2+0×1)/3。同理,中世纪暖期与小冰期(1450—1850 AD)进行比较,判断中世纪暖期时祁连山地区湿度。
表2 中全新世暖期的古气候记录
Tab. 2
| 名称 | 纬度(N) | 经度(E) | 时间段(ka BP)a | 代理指标 | 来源 |
|---|---|---|---|---|---|
| 敦德冰芯 | 38°06′ | 96°24′ | 7.2—6.0 | 冰芯δ18O | [10] |
| 扁都口 | 38°13′ | 100°52′ | 7.2—6.0 | 剖面MS、CaCO3、Redness | [11] |
| 7.2—6.0 | 剖面TOC | [12] | |||
| 东吉湖 | 35°18′ | 98°32′ | 7.2—6.0 | 钻孔(PG1901)TOC、C/N | [13] |
| 茶卡盐湖 | 36°38′~36°45′ | 99°02′~99°12′ | 7.2—6.0 | 钻孔(CKL-2004)TOC、TN、Gypsum | [14] |
| 达连海 | 36°114′ | 100°24′ | 7.2—6.0 | 乔木花粉百分比 | [15] |
| 尕海 | 37°08′ | 97°33′ | 7.2—6.0 | 钻孔(DG03)CaCO3、δ18O、δ13C、TOC、C/N | [16] |
| 更尕海 | 36°11′ | 100°06′ | 7.2—6.0 | 钻孔(GGH-A)δ18O | [17] |
| 7.2—6.0 | 多个岩心TOC、TN、C/N、CaCO3 | [18] | |||
| 哈拉湖 | 38°12′~38°25′ | 97°24′~97°47′ | 7.2—6.0 | 钻孔(H8)δ18O | [19] |
| 洪水河 | 38°10′~38°46′ | 102°45′~102°53′ | 7.2—6.0 | 剖面TOC、CaCO3、δ18O、δ13C | [20] |
| 花海 | 40°11′~40°34′ | 96°30′~97°40′ | 7.2—6.0 | 剖面TOC、CaCO3 | [21] |
| 克鲁克湖 | 37°14′~37°20′ | 96°51′~96°57′ | 7.2—6.0 | 钻孔(HL05-2)MS、CaCO3、A/C | [22] |
| 青海湖 | 36°15′~38°20′ | 97°50′~101°20′ | 7.2—6.0 | 湖泊水位 | [10] |
| 7.2—6.0 | 钻孔(1F)TOC、盐度 | [23] | |||
| 7.2—6.0 | 钻孔(QH-2000)孢粉浓度 | [24] | |||
| 7.2—6.0 | TOC、C/N | [25] | |||
| 三角城 | 37°02′~39°17′ | 100°57′~104°57′ | 7.2—6.0 | 沉积剖面TOC、CaCO3 | [26] |
| 盐池 | 37°04′ | 96°50′ | 7.0—6.4 | 剖面TOC、TC、TN、C/N、CaCO3 | [27] |
注:a均为日历年。
表3 中世纪暖期的古气候记录
Tab. 3
| 名称 | 纬度(N) | 经度(E) | 时间段(AD) | 代理指标 | 来源 |
|---|---|---|---|---|---|
| 敦德冰芯 | 38°06′ | 96°24′ | 950—1300 | δ18O | NOAA |
| Toson Lake | 37°04′~37°13′ | 96°50′~97°03′ | 950—1294 | TOC | [28] |
| 苏干湖 | 38°51′ | 93°54′ | 930—1323 | 碳酸盐δ13C | [29] |
| 935—1330 | 碳酸盐δ18O | ||||
| 950—1302 | 岩芯盐度和碳酸盐δ18O | [30] | |||
| 青藏高原东北部树轮 | 37°~38°84′ | 97°~100° | 950—1300 | RecPNoFilt | NOAA |
| 祁连山中部祁连圆柏 | 38°26′ | 99°56′ | 950—1300 | 祁连圆柏轮宽指数 | [31] |
| 柴达木盆地祁连圆柏 | 36°40′~37°30′ | 97°03′~98°24′ | 950—1300 | 利用树轮资料重建过去降雨量变化 | [32] |
| 青海都兰祁连圆柏 | 36°12′~36°18′ | 98°14′ | 950—1300 | 祁连圆柏树轮指数距平 | [33] |
| 德令哈祁连圆柏 | 37°26′~37°28′ | 97°13′~98°03′ | 950—1300 | DLH1-5树轮宽度指数 | [34] |
| 乌兰祁连圆柏 | 36°40′~36°44′ | 98°13′~98°24′ | 950—1300 | WL3-4树轮宽度指数 | [34] |
| 哈利哈图祁连圆柏 | 37°03′ | 98°40′ | 950—1300 | 祁连圆柏树轮宽度指数 | [35] |
注:NOAA为美国国家海洋和大气管理局(
4 祁连山地区各暖期的气候变化
4.1 暖期时间尺度
4.1.1 现代暖期时间范围
4.1.2 千年尺度的中全新世暖期
全新世大暖期是指全新世以来气候最温暖的时期[38],期间存在一个稳定温暖湿润的中全新世时期,但各区域暖期响应时间不同。早期根据北欧孢粉14C定年,提出9.5—2.5 ka BP(14C年代)是全新世温暖时期,适用范围仅在欧洲北部及亚洲北部地区[39]。格陵兰冰芯δ18O同位素反映高温期在8.0—4.0 ka BP(未经标注者均为日历年)[39]。施雅风根据全新世时期冰川、孢粉、植物、土壤、湖泊、树轮等古气候记录提出中国全新世大暖期是8.5—3 ka BP(14C年代),中全新世期间夏季风降水及中国北方降水显著增加,到达稳定的暖湿阶段[10]。祁连山敦德冰芯δ18O含量显示 8.5 ka BP左右气温已高于现代,温暖湿润期出现在约7.2—6.0 ka BP,大概2.9 ka BP后呈现多次连续降温波动[39]。中国全新世始于约10.5 ka BP, 之后经过剧烈波动,约7.2—6.0 ka BP 达到稳定的暖湿期,之后经过数次气候事件[40]。研究选择全新世大暖期最稳定温暖湿润时段,即中全新世7.2—6.0 ka BP时期,探讨祁连山千年尺度暖期干湿变化。
4.1.3 百年尺度的中世纪暖期
Lamb根据来自北欧和北大西洋地区的资料和证据,表明欧洲中世纪时期一些地区比现在温暖,称为中世纪暖期[41]。大量研究表明MWP具有全球性,但各地区起止时间存在争议。全球/半球或是模式模拟结果显示,各地区中世纪暖期基本上出现于800—1400 AD范围[42]。李健等全球海气藕合气候模式模拟结果表明,中国的中世纪暖期大概是1000—1260 AD[43]。初子莹等初步重建了过去千年中国地温序列,指出1000—1310 AD与中世纪暖期对应[44]。葛全胜等重建的过去2000年中国温度变化曲线,显示930—1310 AD为暖期[45]。根据冰芯、树轮、历史文献、湖泊沉积及孢粉等高分辨率的代用资料,综合表明中国东部在900—1300 AD出现温暖期[46],西部地区稍晚。基于上述,研究选择950—1300 AD研究祁连山地区中世纪暖期气候变化。
4.2 气候变化
4.2.1 现代暖期(1958—2018年)干湿变化
使用祁连山地区各气象站点的气温月值、降水月值、蒸发日值数据计算年平均气温、降水累积量和蒸发累积量,再对其进行空间上的算术平均值计算,得到了1958—2018年祁连山区域的逐年平均气温、降水量以及蒸发量的算术平均值,并结合一元线性回归进行趋势分析,做出祁连山地区多年气温降水蒸发变化曲线(图2)。1958—2018年祁连山地区气温总体呈上升趋势,年平均气温为5.0 ℃,增温幅度为0.32 ℃/10a,尤其在20世纪90年代增温幅度更大,进入21世纪后变暖幅度有所减缓;降水量年际波动频繁,多年平均降水量为282.92 mm,1958—2018年降水量呈缓慢增长趋势,增加速率为0.38 mm/a;祁连山地区蒸发量逐年减少,多年平均蒸发量为634.73 mm,下降速率为4.39 mm/a。上述可得,祁连山地区不断变暖,降水逐年增多,蒸发却逐年减少。
图2

图2
祁连山地区年均气温降水蒸发和湿度变化
Fig. 2
Annual mean temperature, precipitation, evaporation and dry-wet index changes in the Qilian Mountains
图3
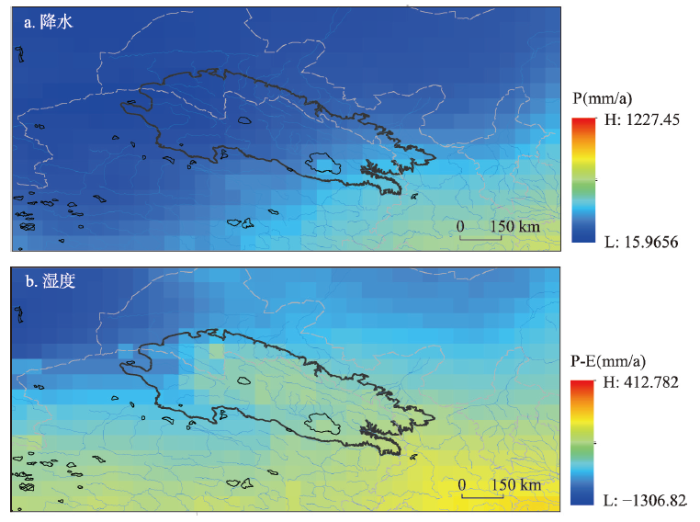
图3
1958—2018年祁连山地区的降水与湿度
注:数据来源CRU。
Fig. 3
Precipitation and moisture index in the Qilian Mountains in 1958-2018
4.2.2 中全新世暖期(7.2—6.0 ka BP)干湿变化
大量证据表明,全新世气候复杂,在到达稳定前曾发生千年或百年尺度的周期的冷暖事件[39]。根据祁连山地区部分古气候重建资料,约在中全新世暖期(7.2—6.0 ka BP)出现稳定的温暖湿润阶段。在该时期,扁都口剖面的磁化率(Magnetic susceptibility, MS)增加(图4a),表明受到东亚夏季风加强影响,祁连山地区水热组合发生变化,环境得到改善[11];洪水河剖面TOC含量增加,并在约7 ka BP达到峰值,表明湖泊处于较高的初级生产力水平和暖湿的气候环境(图4b)[20];花海盆地以碳酸盐沉积为主,湖泊CaCO3含量除了6.7 ka BP一个干旱事件,整体呈现为凹谷,表明入湖水量增大,气候湿润(图4c)[21];克鲁克湖钻孔HL05-2的CaCO3含量自8 ka BP骤降(图4d)后稳定在低值,表明降水量较多,碳酸盐析出较少[22];尕海DG03剖面CaCO3含量平均16%,含量较低,波动不大(图4e),说明湖泊相对比较稳定,气候较为湿润[16];青海湖钻孔1F TOC含量从5 ka BP下降至全新世晚期(图4f),波动较小,指示水分条件好[23];温暖湿润的气候,适宜树木生长,同时森林扩张具有滞后性,达连海森林孢粉在全新世中期处于较低水平(图4g),但后期呈上升趋势[15];三角城沉积剖面的有机质碳同位素组成在-30‰~-20‰,更为偏轻(图4h),说明降雨量较大,陆生植被相对繁盛[26];更尕海钻孔GGH-A的C/N值稳定(图4j),比值绝大部分低于10,湖泊沉积物以水生植物藻类为主,表明湖泊水位较高,气候湿润[17];敦德冰芯δ18O在全新世中期处于高值期(图4j),表明气候以温暖为特征[10]。
图4
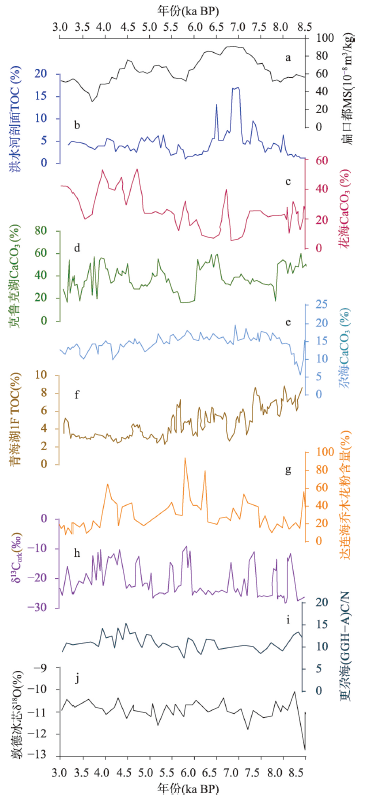
图4
中全新世暖期典型气候记录中古环境代用指标变化
Fig. 4
Changes of paleoenvironmental proxies during the MH
中全新世暖期共14条古气候记录代用指标的干湿等级分布如图5,有11条记录显示等级≤ 0,只有3条记录显示干旱状态(0~2)。整体上看出,在全新世中期(7.2—6.0 ka BP)祁连山地区温暖湿润,受季风波及范围影响,祁连山地区呈现北到南干湿指数越来越小,对应地区越来越湿润的现象。
图5

图5
祁连山地区中全新世暖期和中世纪暖期湿度等级
Fig. 5
Dry-wet map based on multi-proxy records of the Qilian Mountains in the MH and MWP
综上所述,全新世中期温暖湿润,由强盛的东亚季风带来大量降水,使得祁连山地区湖泊处于较高的初级生产力,植被向西迁移,森林逐渐扩张。
4.2.3 中世纪暖期(950—1250 AD)干湿变化
祁连山地区部分古气候重建资料的统计结果如图6。青藏高原东北部树轮重建的降水量(图6a)在中世纪暖期(950—1300 AD)逐渐降低,平均值较小冰期(1450—1850 AD)小;有研究发现干旱区祁连圆柏的生长受限蒸发或降水综合作用[40],即受到湿度影响,各地区祁连圆柏轮宽指数如图6b~6d所示:中世纪暖期(950—1300 AD)轮宽指数均值分别为0.061、0.927、0.954,在小冰期(1450—1850 AD)均值分别是-0.086、1.056、1.080,MWP时期轮宽指数均大于LIA时期,表明MWP时期较干旱[33-34]。哈利哈图下限轮宽指数序列(图6g)显示,WMP时期显著低于LIA时期,气候较干燥[35]。然而,祁连山中部上限祁连圆柏宽度与温度变化相关性较好[38],其轮宽指数变化(图6e)表明,MWP时期较LIA时期气温较高。由柴达木盆地祁连圆柏重建降水量(图6f)可以直观得出,MWP降水量较LIA时期较少,中世纪暖期较旱[32]。苏干湖盐度在MWP时期显著低于LIA时期,则MWP较LIA时期温暖干燥[30]。由于MWP期间温度高降水少,敦德冰芯δ18O含量在LIA时期也较多(图6i)。因此,相较于小冰期,祁连山地区中世纪暖期为暖干气候,MWP-LIA表现暖干—冷湿组合特征。
图6
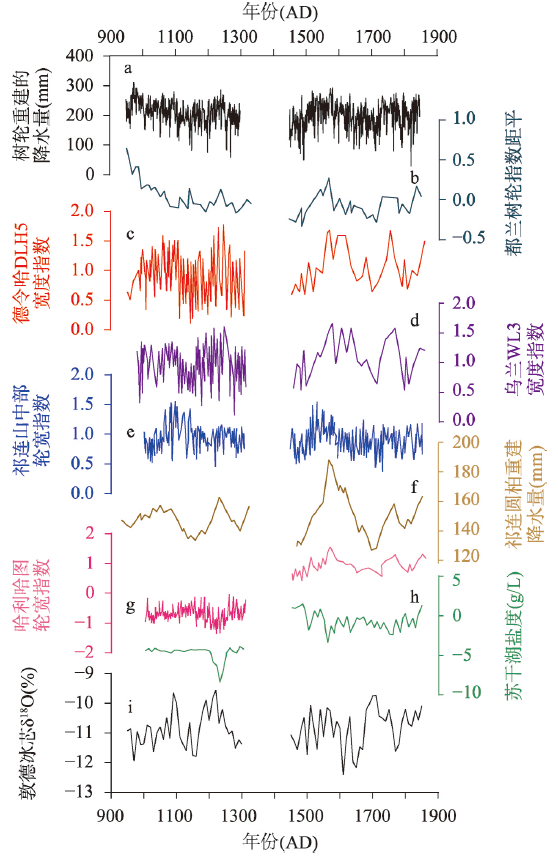
图6
祁连山地区中世纪暖期与小冰期典型气候记录中古环境代用指标变化
Fig. 6
Changes of paleoenvironmental proxies in the Qilain Mountains during the MWP and the LIA
祁连山地区MWP干湿等级分布(图5)显示,10条古气候记录中有9条显示等级≥ 0,只有1条记录显示湿润(-2~-1)状态。在950—1300 AD,祁连山地区干湿程度大体与小冰期相近,东部地区受到更多因素对气候产生影响,其干湿波动较西北地区明显。同时,记录显示祁连山地区干旱地点多于湿润地点,即MWP较LIA时期是一个干旱暖期。
综上所述,在数百年来,祁连山地区表现为暖干—冷湿组合特征。造成这种变化的可能机制可能是:暖期较高温度产生较大的蒸发,降水量不足以补给,导致湿度降低,暖期温暖干燥。也有研究猜测是因为季风在暖期推进过程使得季风边缘区偏干,北半球冷期时西风南移并加强,青藏高原低温导致北侧下沉气流减弱以及北大西洋涛动(NAO)整体偏负使风暴路径南移等[49]。
4.3 MH和MWP气候差异
图7
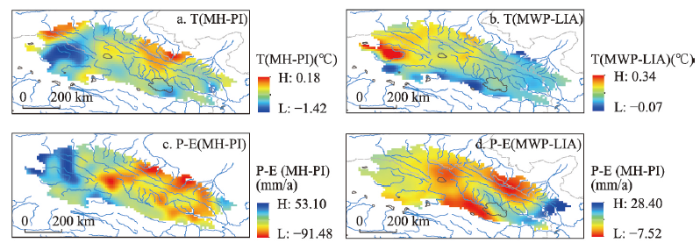
图7
祁连山地区中全新世暖期和中世纪暖期基于古气候模型的气温和湿度指数
Fig. 7
Temperature and moisture index based on paleoclimate model in the Qilian Mountains during the MH and MWP
5 讨论
5.1 千百年尺度祁连山地区对暖期的响应机制
对比分析古环境重建序列以及气候模型单因子或组合强迫试验等发现,地质历史时期的暖期由自然因子引发,MH温度和降水主要受到地球轨道参数的控制,MWP增温则是主要受太阳短波辐射变化驱动的“海洋恒温机制”所致,降水量与太阳辐射显著相关[52],现代暖期则主要是因为人类活动加剧,温室气体浓度增加导致的全球气温升高[48],严重影响气候变化。祁连山地区的降水主要受到各种环流控制,其中重点是季风、西风以及青藏高原环流[8]。研究发现,千年尺度上MH受到强盛的东亚夏季风影响,祁连山地区整体温暖湿润,西风环流随距离不断减弱,从西北到东南出现冷湿—暖干的变化。在百年尺度的MWP期间,该地区不同于季风影响区的气候模式,表现出温暖干燥特征,主要是由于太阳辐射增强,温度升高使得降水和蒸发量收支改变。近些年,受到人类活动影响,温室气体和硫化物气溶胶增加,中纬度地区明显增温,环流活动加强,降水增加,蒸发减弱,出现明显暖湿化趋势。因此,千百年尺度历史暖期的干湿变化由自然因子主导,而现代暖期受到温室气体增加和人类活动影响较大。
5.2 对现代暖期的指示意义
气候变化普遍具有周期性,历史暖期的干湿变化可以为现代变暖的气候变化提供一个历史参照。中亚地区中全新世暖期与现代暖期气候的相关研究表明,二者的夏季降水变化型存在一定程度的相似[53]。但是,两个时期的地表气温空间分布差异较大,中全新世暖期呈同心圆状分布,现代暖期呈纬向分布,且前者的副高较后者强,东部偏南气流强盛,这种现象与中全新世暖期受到地球轨道参数主控和现代暖期受到人类活动影响较大相关[54]。参照千年尺度的中全新世暖期的气候特征,未来祁连山地区气候达到稳定前必将经历多次冷暖事件,当前的暖湿化也许是短时间的气候间隔,更长时间尺度上的干湿格局还是主要由季风强弱、影响范围、方向与西风环流之间相互作用控制。
随着人类社会的演变,人地关系由适应自然生态系统转向改变生存环境,人为因素在逐渐夺取气候环境变化的主导权[58]。中全新世暖期与中世纪暖期气候主要受到自然变率(地球轨道参数,太阳辐射、火山活动)影响,而现代暖期气候变化受到人类活动大于自然因子。当前人类活动持续多样化,气候温暖化持续时间尺度也难以预测,即使现代暖期与历史暖期的气候有众多相似之处,过去气候也只能作为自然驱动下气候变化趋势的参考,用历史暖期气候响应机制来预测未来需要进一步评估。自然因素与人类活动共同作用将是准确预测研究区未来干湿格局的基础。
6 结论
通过古气候记录、古气候模型及现代观测资料研究祁连山地区中全新世暖期、中世纪暖期与现代暖期干湿变化,发现不同冷暖阶段气候及其成因均存在差异,探讨千百年尺度祁连山地区干湿变化对暖期的响应机制,主要结论如下:
(1)千年尺度:全新世大暖期受地球轨道参数主控,暖期鼎盛期东亚夏季风强盛带来大量降水,祁连山地区温暖湿润。
(2)百年尺度:中世纪暖期主要受到太阳辐射影响,温度升高。同时,夏季风为祁连山带来降水,但高温蒸发造成水分大量流失,水分收支不平衡,使得气候温暖干燥。
(3)现代暖期:人类活动加剧,温室气体含量上升使得增温明显,环流增强带来降水增加,祁连山地区气候呈现暖湿化趋势。现代气候是受到自然因子与人类活动影响相互作用的结果。
(4)中全新世暖期、中世纪暖期与现代暖期的气候主控因子、形成原因及发展条件并不相同。前两者是自然因素主控,后者人类活动成为影响该地区干湿格局的重要因素。因此,自然因素与人类活动共同作用是准确预测研究区未来干湿格局的基础。
参考文献
Are paleo-proxy data helpful for constraining future climate change
Preliminary study on signal, impact and foreground of climatic shift from warm-dry to warm-humid in northwest China
西北气候由暖干向暖湿转型的信号、影响和前景初步探讨
Climatic variation over Qilian Mountain region in last 50 years
[D].
近50年来祁连山地区的气候变化
[D].
Tightening ecological management facilitates green development in the Qilian Mountains
祁连山绿色发展: 从生态治理到生态恢复
Short commentary on CMIP6 paleoclimate modelling intercomparison project phase 4 (PMIP4)
第四次国际古气候模拟比较计划(PMIP4)概况与评述
Tree-ring based climate reconstruction for Qilian Mountain
[D].
祁连山地区树轮记录的气候变化研究
[D].
Multi-scale temporal characteristics of the dryness/wetness over northern China during the last century
近代中国北方干湿变化趋势的多时段特征
Climate fluctuation and vital events of Holocene in China
中国全新世大暖期的气候波动与重要事件
Millennial-scale Holocene climate variability in the NW China drylands and links to the tropical Pacific and the North Atlantic
DOI:10.1016/j.palaeo.2005.09.008 URL [本文引用: 2]
Study on hydro-thermal characteristic of eastern Qilian mountains in Holocene and present
祁连山东段全新世与现代水热组合特征研究
Late Glacial and Holocene development of Lake Donggi Cona, north-eastern Tibetan Plateau, inferred from sedimentological analysis
DOI:10.1016/j.palaeo.2012.04.013 URL [本文引用: 1]
Evolution of Chaka Salt Lake in NW China in response to climatic change during the Latest Pleistocene-Holocene
DOI:10.1016/j.quascirev.2007.12.006 URL [本文引用: 1]
Palaeovegetational and palaeoenvironmental changes since the last deglacial in Gonghe Basin, northeast Tibetan Plateau
DOI:10.1007/s11442-013-0999-5 URL [本文引用: 2]
Carbonate content in the core DG 03 of lake Gahai and its paleoenvironmental significance
尕海湖DG03孔碳酸盐含量及其环境意义
A 16-ka oxygen-isotope record from Genggahai Lake on the northeastern Qinghai-Tibetan Plateau: Hydroclimatic evolution and changes in atmospheric circulation
DOI:10.1016/j.quascirev.2017.03.004 URL [本文引用: 2]
Changes in palaeoproductivity of Genggahai Lake over the past 16 ka in the Gonghe Basin, northeastern Qinghai-Tibetan Plateau
DOI:10.1007/s11434-012-5191-2 URL [本文引用: 1]
Late Quaternary water depth changes in Hala Lake, northeastern Tibetan Plateau, derived from ostracod assemblages and sediment properties in multiple sediment records
DOI:10.1016/j.quascirev.2014.04.030 URL [本文引用: 1]
A Holocene climatic record from arid northwestern China
DOI:10.1016/S0031-0182(00)00139-5 URL [本文引用: 2]
Environment changes documented by geochemistry in Huahai Lake
[D].
花海湖泊环境变化的地球化学记录研究
[D].
Holocene millennial-scale climate variations documented by multiple lake-level proxies in sediment cores from Hurleg Lake, Northwest China
DOI:10.1007/s10933-010-9469-6 URL [本文引用: 2]
Water salinity and productivity recorded by ostracod assemblages and their carbon isotopes since the early Holocene at Lake Qinghai on the northeastern Qinghai-Tibet Plateau, China
DOI:10.1016/j.palaeo.2014.04.017 URL [本文引用: 2]
The grainsize of the Core QH-2000 in Qinghai Lake and its implication for paleoclimate and paleoenvironment
DOI:10.18307/2003.0203 URL [本文引用: 1]
青海湖QH-2000钻孔沉积物粒度组成的古气候古环境意义
A high-resolution climatic change since the Late Glacial Age inferred from multi-proxy of sediments in Qinghai Lake
晚冰期以来青海湖沉积物多指标高分辨率的古气候演化
The paleoenvironmental significance of organic carbon isotope in lacustrine sediments in the arid China: An example from Sanjiaocheng Palaeolake in Minqin
中国西北干旱区湖泊沉积物中有机质碳同位素组成的环境意义: 以民勤盆地三角城古湖泊为例
An evidence of millennial-scale summer monsoon boundary change in the northwest China: Analysis results from saline minerals in lake sediments of Yanchi lake and Zhuye lake
我国西北夏季风边界千年尺度变化的证据-来自盐池和猪野泽盐类矿物分析结果
High-resolution geochemical record for the last 1100 yr from Lake Toson, northeastern Tibetan Plateau, and its climatic implications
DOI:10.1016/j.quaint.2017.03.067 URL [本文引用: 1]
Climatic changes documented by stable isotopes of sedimentary carbonate in Lake Sugan, northeastern Tibetan Plateau of China since 2 ka BP
2ka来苏干湖沉积碳酸盐稳定同位素记录的气候变化
Moisture changes over the last millennium in arid central Asia: A review, synthesis and comparison with monsoon region
DOI:10.1016/j.quascirev.2010.01.005 URL [本文引用: 2]
Temperature variations recovered from tree-rings in the middle Qilian Mountain over the last millennium
祁连山中部过去近千年温度变化的树轮记录
A reconstructed precipitation series over the past millennium in the northeastern Qaidam Basin
柴达木盆地东北部过去1437a的降水变化重建
Decadal climatic variations indicated by Dulan tree-ring and the comparison with temperature proxy data from other regions of China during the last 2000 years
近2000年都兰树轮10年尺度的气候变化及其与中国其它地区温度代用资料的比较
Precipitation change since last millennium from tree ring in Delingha, Qinghai
树轮记录的青海德令哈地区千年降水变化
Recent millennium temperature changes records by tree ring in Wulan, Qinghai
树木年轮记录的青海乌兰地区近千年温度变化
Analysis of extreme temperature changes in Qilian Mountains in the past 60 years
DOI:10.7522/j.issn.1000-0534.2018.00135
[本文引用: 1]

Based on the daily maximum, daily minimum and average air temperature data of 24 meteorological stations from 1961 to 2017, 12 extreme air temperature indices recommended by the CCl/CLIVAR climate change monitoring and indices expert group were used to analyze the temporal and spatial variations of extreme air temperature indices in Qilian Mountains and the characteristic of the temporal and spatial variations are explained. The results showed that:The spatial distribution of warm indices increases to the periphery with the central and eastern part of Qilian Mountains as the region with smaller warming range. The spatial distribution of cold indices decreases from the south to the north. In contrast to warm extremes, indices that related to cold extremes showed warmer trend. The warming range of night indices is larger than day indices, which is consistent with the significant decrease of diurnal temperature range. The length of growing season length was significantly longer. The number of ice days and frost days significantly decreased, and the areas with large reduction were concentrated in the south of Qilian Mountains. After 1985, especially during the 1990s, the warming trend of Qilian Mountains accelerated. After 2000, the warming trend slowed down, and after 2010, the warming rate increased significantly. The extreme temperature indices have a good correlation with altitude. The higher altitude, the greater warming of extreme temperature indices. In the high-altitude area (>2500 m), the extreme temperature cold indices changes significantly, while in the low altitude area (< 2500 m), the extreme temperature warm indices changes significantly. The effect of the circulation index of Atlantic multidecadal Oscillation, Tropical Northern Atlantic Index, Tropical Southern Atlantic Index, North Tropical Atlantic SST Index, Caribbean SST Index on the extreme temperature warm index was stronger than that of extreme temperature cold index. Central Tropical Pacific SST mainly affects the extreme temperature cold indices, while South China Sea Summer Monsoon Index mainly affects the extreme temperature warm indices.
近60年来祁连山极端气温变化研究
DOI:10.7522/j.issn.1000-0534.2018.00135
[本文引用: 1]
利用24个气象站点1961-2017年逐日最高、最低和平均气温资料,采用CCl/CLIVAR气候变化检测监测和指数专家小组(ETCCDI)所推荐的12个极端气温指数,分析了祁连山区极端气温指数的时空变化及其原因。结果表明:极端气温暖指数以祁连山中部和东部为较小变暖幅度区,向外围递增,极端气温冷指数的空间分布由南向北递减。相较暖指数,冷指数变暖幅度更大;夜指数变暖幅度大于昼指数,这与气温日较差显著减少具有一致性;生长季长度明显延长;冰冻日数、霜冻日数显著减少,减少幅度较大的区域集中在祁连山南部。1985年后尤其在20世纪90年代期间祁连山加速变暖,2000年后变暖趋势有所减缓,2010年后变暖幅度大幅增加。海拔越高,极端气温指数的变暖幅度越大,高海拔区(>2500 m)极端气温冷指数变化明显,低海拔区(< 2500 m)极端气温暖指数变化明显。北大西洋年代际振荡(Atlantic Multidecadal Oscillation,AMO)、热带北大西洋指数(Tropical Northern Atlantic Index,TNA)、热带南大西洋指数(Tropical Southern Atlantic Index,TSA)、北热带大西洋海表温度指数(North Tropical Atlantic Index,NTA)、加勒比地区海温指数(Caribbean Index,CAR)对祁连山极端气温暖指数的影响强于极端气温冷指数,中热带太平洋海温(Nino 4)主要影响极端气温冷指数,南海夏季风(South China Sea Summer Monsoon Index,SCSSMI)主要影响极端气温暖指数。
Temperature during some stages of the Holocene in China
全新世几个特征时期的中国气温
Megathermal
全新世大暖期
Preliminary research in the Holocene Hypsithermal climate change
全新世大暖期气候环境特征及其机制的再认识
Advance in research on the Holocene climate fluctuations
中国全新世气候变化研究进展
Medieval warm period and little ice age
中世纪暖期与小冰期
An overview of studies on medieval warm period
中世纪暖期气候研究综述
Modeling study on the climate change during the Medieval Warm Period
DOI:10.18307/2006.0201 URL [本文引用: 1]
中世纪暖期温度变化的模拟
A preliminary reconstruction of mean surface air temperature over the last 1000 years in China
我国过去千年地表温度序列的初步重建
Several problems of temperature change research in China for the past 2000 years
过去2000年中国温度变化研究的几个问题
Overview on studies of medieval warm period in China
中国中世纪暖期气候研究综述
An overview of China climate change over the 20th century using UK UEA/CRU high resolution grid data
英国CRU高分辨率格点资料揭示的20世纪中国气候变化
Detection and prediction of climate change for the 20th and 21st century due to human activity in northwest China
人类活动对20世纪中国西北地区气候变化影响检测和21世纪预测
A discussion on the westerly-dominated climate model in mid-latitude Asia during the modern interglacial period
中纬度亚洲现代间冰期气候变化的“西风模式”讨论
Interplay between the Westerlies and Asian monsoon recorded in Lake Qinghai sediments since 32 ka
Spatiotemporal model and mechanism of monsoon rainfall in China during the medieval warm period and the current warm period
中世纪暖期和现代暖期中国季风降水时空模式及其机制
Decadal climatic variations recorded in Guliya ice core and comparison with the historical documentary data from east China during the last 2000 years
近2000a古里雅冰芯10a尺度的气候变化及其与中国东部文献记录的比较
The position of the Current Warm Period in the context of the past 22000 years of summer climate in China
Comparison of the summer surface air temperature and precipitation over east Asia between the Holocene thermal maximum and the RCP4.5 scenario
全新世暖期鼎盛期与未来变暖情景下东亚夏季降水和气温变化对比
Spatial pattern reconstruction of typical centennial warm periods of global temperature over the past millennium
全球过去千年典型暖期温度空间格局重建
Simulation of the characteristics and mechanism of Chinese typical warm periods over the past 1500 years
中国过去1500年典型暖期气候的模拟研究
Modeling study on the characteristics and mechanisms of global typical warm periods over the past 2000 years
过去2000年全球典型暖期特征与机制的模拟研究
Using the Fulcrum Cognitive Model to explore the mechanism of past human-land co-evolution
DOI:10.11821/dlxb202101002
[本文引用: 1]
The trajectory, pattern, and mechanism of the human-land co-evolution process is a critical issue in the field of human geography. The pattern of human-environment interaction has varied significantly during different phases of human evolution, suggesting a series of changes in the driving force of human-land co-evolution. Although a variety of underlying mechanisms specific to the key periods of human history (e.g., Paleolithic, Neolithic, Bronze, and historical ages) have been intensively investigated, there are still significant gaps in the widely accepted model of the fundamental law that governs human-land co-evolution across human history. In this paper we propose the Fulcrum Cognitive Model (FCM), with the objective of disentangling the mechanism of human-land co-evolution. The FCM focuses on the equilibrium between the natural ecosystem and human social system, which can be disturbed by both climatic/environmental change and human activities, and restored by an adjustment of the human social system. Moreover, we propose a "quantitative-change equilibrium pattern" and "qualitative-change equilibrium pattern" on the basis of FCM, to further describe the mechanism of past human-land co-evolution in different contexts. In the former pattern, a new equilibrium between the natural ecosystem and human social system is rebuilt by the corresponding changes in population size, without a shift in the fulcrum position. In contrast, in the latter pattern, societies improve their social resilience to the deterioration of the living environment through social and/or technological changes. In this case, the fulcrum position of the original equilibrium shifts and the pattern of human-environment interaction is transformed. Social resilience is gradually strengthened during the evolutionary process and the dominant influencing factor moves from natural causes towards anthropogenic factors. To test its feasibility, we applied the model to the changing patterns of the human-land relationship in Shanxi, Shaanxi, and Henan provinces in central north China between the Yangshao period (~5000-3000 BCE) and Zhou Dynasty (1046-256 BCE), based on a comprehensive analysis of updated archaeological and paleoclimatic data. The results suggested that the mechanism controlling the human-land relationship during ~4000-2600 BCE and 2600-256 BCE could be explained by the "quantitative-change equilibrium pattern" and "qualitative-change equilibrium pattern", respectively. The mechanism of human-land co-evolution in the past is very complicated and the interaction of these two patterns may vary in terms of its spatiotemporal scale, which will require further study in the future.
探讨过去人地关系演变机制的“支点”概念模型
DOI:10.11821/dlxb202101002
[本文引用: 1]
人地关系演变的历史、规律和机制是地理学研究的重要科学问题。在人类社会演化的不同阶段,人与环境相互作用的模式存在显著差异,揭示人地关系在时间维度上的演变轨迹和机制可为有效衔接古今人地关系研究提供重要依据。基于对过去人地关系研究案例的分析和总结,我们提出“支点”概念模型尝试解释人地关系演变的规律和机制。当特定区域人口数量增长到一定程度时,自然生态系统和人类社会系统达到平衡状态,随后的气候环境变化和人类活动变化都有可能打破其平衡状态。人类社会系统在面对生存环境变化压力时可能出现两种不同方式的响应:① 通过人口数量的调节适应生存环境变化而达到新的平衡,其特点是人与环境相互作用的模式(人类社会与自然生态系统平衡“支点”位置)不变;② 通过人类社会组织结构或技术革新方式使社会适应生存环境变化的“韧性”增强,体现为人与环境相互作用模式发生改变。随着时间的推移,社会韧性呈增强趋势,人地关系演变的主导因素也整体呈现由自然因素向人为因素的偏移。最后,以河南、山西和陕西三省仰韶文化时期(约公元前5000—公元前3000年)至周代(公元前1046—公元前256年)的人地关系研究为例,运用“支点”概念模型分析了其演变机制。
