

1 引言
粤港澳大湾区建设有利于充分发挥粤港澳综合优势,深化内地与港澳合作,提升粤港澳大湾区在国家经济发展和对外开放中的支撑引领作用,是丝绸之路经济带和21世纪海上丝绸之路对接融汇的重要支撑区,已经上升为国家级战略[1⇓-3]。随着改革开放和经济全球化的不断深入,粤港澳大湾区城镇用地空间格局与城镇化动力机制发生了深刻的变化,城市群历经了“单核发展”“双核驱动发展”“多中心网络化发展”等过程[4⇓-6]。作为中国开放程度最高、经济活力最强,最早实行改革开放的地区之一,20世纪80年代以来粤港澳大湾区城镇用地空间格局呈现出哪些类型?从哪些维度进行划分?不同维度与格局类型具有怎样的时空演变特征与原因?解决这些问题有利于深入理解城市群城镇用地空间格局演变的规律和机理,推进粤港澳大湾区建设为世界级城市群,为新型城镇化高质量发展提供科学参考。
目前,对城市群或大城市城镇用地空间格局的研究多采用单一层面或多层面的多个指标进行刻画,主要包括城镇用地的规模特征[7⇓-9]、形态特征[10⇓-12]和分布特征[13⇓-15]及其演变。城镇用地规模特征可以反应区域土地城镇化发展水平,其不仅关系到土地分配、地价税收等与社会、经济效益有关的一些活动,也影响城市生态环境,包括局地气候[16]、大气质量[17]、资源减少及环境污染程度[18]等,主要以区域城镇用地总面积、城镇扩展强度、土地城镇化率等指标进行表征。形状特征表示城镇用地形状的复杂性和紧凑性,不同形态的城镇用地斑块对生物的生存和能量的流动具有重要作用,已有研究表明,城市形态对生物多样性[19]、噪声污染[20]和城市内涝[21]等均具有一定影响。此外,形状特征也能在一定程度上反映斑块的边缘效应和其与周围斑块的镶嵌关系。一般来说,形状简单是一种更好的趋势,说明城市建设更多地受到规划控制,城区周界整齐规则,用地紧凑集约[11],主要以分维数、紧凑度或多种形状指数进行表征。另外,城镇用地分布特征表示不同城镇用地分布的位置、斑块分布的密度和聚集性,可以反映城市发展的方向、地理区位与相互作用关系[22],为优化城镇用地空间格局提供科学依据,其刻画主要以城镇用地的重心、斑块密度、斑块距离等指标进行表征。但是,当前对城市群城镇用地空间格局多层面特征的综合与相互关系研究较少,忽视了具有普适性的城镇用地空间格局类型的研究。规模、形态和分布等特征的独立刻画难以突出城镇用地空间格局的主要特征和演变规律,制约了地理学对新型城镇化建设进行分类指导与模式推广等学科支撑功能的发挥。如何找到城镇用地空间格局多维特征之间的关系,挖掘其主要核心特征,提取空间格局类型,是城镇用地空间格局刻画研究的重点之一,有利于对不同城镇用地空间格局类型及其演变造成的生产和生态影响做出准确的分析与预判。
以土地利用变化为基础的城市群城镇用地变化动力机制研究也是城市群研究的热点之一,如王利伟等利用因子分析和多元线性回归分析,测度行政力、市场力、外向力、内源力4种驱动力对京津冀城市群空间扩展的影响[23];王海军等采用Logistic-GTWR模型刻画邻域因子、自然因子和社会经济因子对武汉城市圈土地扩张的演化和空间分异格局的影响[24]。然而,目前大多数研究对城镇用地变化的驱动机制解析多针对面积变化的总量与速度,对城镇用地形态、分布及空间格局类型等多维度的城镇用地扩展驱动机制解释略显不足。其次,在城市群生态系统中,地理、生态、经济和社会因素之间在不同的时空尺度上存在广泛的相互作用[25],某一因素对城市发展的作用可能会受到城市系统中其他因素水平的影响。研究证明,对因子间相互作用的定量研究可以提高城市增长空间预测的准确性[26]。但是,已有研究侧重自然、社会、经济等因子对城市群城镇用地扩展的单因素影响力定量刻画与对比,多因子交互作用研究相对较少。因此,定量刻画驱动因子间的交互作用机制对明晰城市群城镇用地扩展的驱动机理和提高未来模拟预测精度具有重要价值。
本文深入研究1980—2020年粤港澳大湾区城镇用地空间格局类型的演变及其驱动机制。首先,从“规模—形态—分布”三维特征入手,基于模糊聚类分析对城镇用地空间格局进行类型划分与定义,刻画粤港澳大湾区内特别行政区、地级市和县级行政区的城镇用地空间格局的时空演变特征。其次,基于地理探测器定量测度影响粤港澳大湾区城镇用地面积、形状、分布和空间格局类型变化的多维影响力与交互作用。以期为优化粤港澳大湾区国土空间开发格局、促进城市群协调发展和新型城镇化建设提供科学依据。
2 研究区概况与数据来源
2.1 研究区域
粤港澳大湾区地临南海、地势平坦、河网密集、气候宜人,与东南亚隔海相望,是中国对外联系的重要门户,具有明显的地缘优势。其行政范围包括广东省的广州市、深圳市、珠海市、佛山市、惠州市、东莞市、中山市、江门市、肇庆市9个城市和香港、澳门两个特别行政区,其中,广州市和深圳市为副省级城市,东莞市和中山市是不设区县的地级市(图1)。1978年改革开放以来,特别是香港、澳门回归后,粤港澳合作不断深化实化,粤港澳大湾区经济实力、区域竞争力显著增强,已具备建成国际一流湾区和世界级城市群的基础条件。2000—2019年间,该地区常住人口从4997.51万人增加到9079.53万人,国内生产总值从20400.03亿元大幅增加到119877.65亿元,涨幅高达587.64%[27-28]。然而,近年来粤港澳大湾区水土资源告急、人口超负、环境透支以及高昂的生活和住房成本等问题相继出现,粤港澳大湾区城镇化发展模式面临转型。因此,在城镇分布密集、城镇化发展迅速、人地矛盾突出的粤港澳大湾区开展长时序城镇用地扩展空间格局类型与驱动力探测研究,极具必要性。
图1
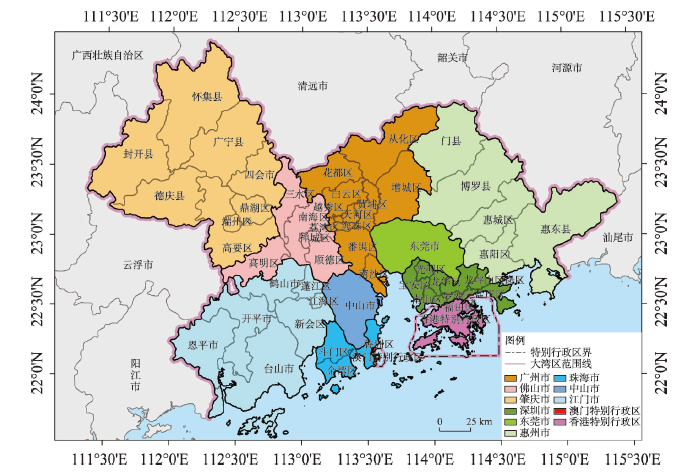
图1
粤港澳大湾区地理区位与2020年行政区划
注:基于自然资源部标准地图服务网站GS(2019)4342号标准地图制作,底图边界无修改。
Fig. 1
Geographical location and administrative divisions in 2020 of the Guangdong-Hong Kong-Macao Greater Bay Area
2.2 数据来源与预处理
本文采用的数据主要包括土地利用数据、社会经济统计数据和基础地理信息数据。① 土地利用来自中国科学院构建的中国1∶10万比例尺土地利用现状遥感监测数据库,包括1980年、1990年、2000年、2010年和2020年共5期100 m分辨率的栅格数据(图2)。本文所指城镇用地是该土地利用分类系统中城乡、工矿、居民用地中的城镇用地[29]。土地利用数据显示,1980—2020年间,广州、深圳、东莞、佛山等地市城镇用地扩展最为剧烈,40年间大湾区中心地区城镇用地扩展逐渐连接成片,期间存在少量城镇用地收缩现象,但由于面积较小,未在图中标识。② 社会经济数据包括各特别行政区、地级市和县级行政单元的常住人口数、地区生产总值、第二产业GDP、第三产业GDP、全社会固定资产投资额、地方财政一般预算收入,主要数据来源为1991—2020年《广东省统计年鉴》和广东省各地市统计年鉴。由于1980年的统计资料匮乏,城镇用地空间格局演变驱动力定量测度仅包括1990—2020年。各年份缺少的数据通过人口普查数据、各地市国民经济和社会发展统计公报等获取;港澳数据通过国家统计局、世界银行等获取。县级行政区划以2020年国家统计局公告为准(
图2
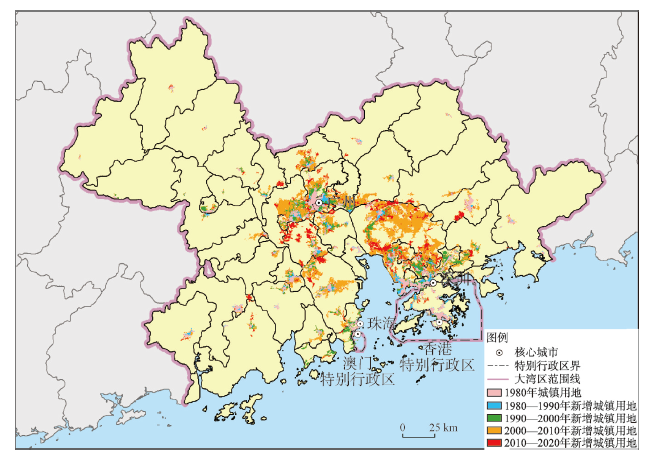
图2
1980—2020年粤港澳大湾区城镇用地空间演变
注:基于自然资源部标准地图服务网站GS(2019)4342号标准地图制作,底图边界无修改。
Fig. 2
Spatial evolution of urban land from 1980 to 2020 in the Guangdong-Hong Kong-Macao Greater Bay Area
2.3 驱动因子遴选
城镇用地扩展的驱动力主要包括自然因素、社会经济因素和政策因素等,各种影响因素通过相互作用,共同驱动城镇用地扩展[30]。其中,自然因素决定了区域城镇用地扩展的本底条件,粤港澳大湾区北部和东部丘陵散布,因此高程、坡度等地形条件将影响城镇用地扩展的方向和规模;此外,珠江三角洲的西江、北江和东江三大河流分布影响城镇用地扩展的强度和范围。社会经济因素是城镇化的内在因素,人口、GDP、固定资产投资、政府财政收入、交通运输和核心城市的牵引作用均直接或间接影响城市群城镇用地扩张。另外,由于政策因素通常与自然、社会、经济等因素紧密相关,所以政策因素对城镇用地扩展的影响可以通过自然、社会、经济因素的变化得以反映。因此,本文从自然因素和社会经济因素两大方面选取13个指标作为粤港澳大湾区城镇用地扩展的驱动因子(表1),并基于自然因素和社会经济因素的影响力变化分析讨论政策因素对粤港澳大湾区城镇用地扩展的作用。
表1 粤港澳大湾区城镇用地扩展驱动因子
Tab. 1
| 驱动因子 | 变量名称 | 单位 | 变量符号 |
|---|---|---|---|
| 自然因素 | 平均海拔 | m | ELE |
| 平均坡度 | ° | SLOPE | |
| 河网密度 | km/km2 | RIVER | |
| 社会经济因素 | 常住人口数量 GDP | 万人 亿元 | POP GDP |
| 全社会固定资产投资额 地方财政一般预算收入 路网密度① | 万元 万元 km/km2 | INVEST INCM ROAD | |
| 距核心城市距离(核心城市分别为香港、澳门、广州、深圳、珠海)② | km | XG、AM、GZ、SZ、ZH |
注:① 考虑到不同类型和等级道路的运输容量和通行能力的差异,对铁路、国道、省道、县道和乡道分别按照3、3、2、1、0.4的权重进行路网密度计算[
3 研究方法
3.1 空间格局类型划分方法
为提取具有普适性的城镇用地空间格局类型,找到空间格局不同层面特征之间的内在关系,挖掘各类型核心特征与功能,本文从城镇用地的规模、形态和分布特征划分城镇用地空间格局类型。研究以县级行政区划单元为最小分析尺度,考虑指数的地理含义明确性、相对独立性和可获得性等因素,规模特征选择城镇用地斑块总面积(CA),形态特征选择面积加权斑块分维数(FRAC),分布特征选择面积加权斑块最近距离(ENN)[33],对粤港澳大湾区城镇用地扩展时空格局进行刻画。CA指数表示区域城镇用地的面积规模大小,CA越大说明城镇发展水平相对较高;FRAC指数表示城镇用地形状的复杂性和紧凑性,一般来说,分维减少是一种更好的趋势,说明城市建设更多地受到规划控制,城区周界整齐规则,用地紧凑集约[11];ENN指数表示不同城镇用地斑块间分布的聚集性,ENN越大说明城镇用地斑块分布较为零散,飞地式扩展现象较为显著,ENN越小说明城镇用地斑块分布较为集中,其扩展分布于核心城区周围。计算公式:
式中:aij为区县j中第i个斑块的面积;pij为区县j中第i个斑块的周长;hij为区县j中第i个斑块中心到距离其最近的斑块中心的距离。
基于上述指标,利用模糊C均值(FCM)算法从规模、形态和分布3个维度对城镇用地空间格局类型进行聚类划分[33],并参考模糊聚类的划分方式确定各空间格局类型划分阈值,对各类型进行命名并总结其特点。首先,为了消除CA、FRAC和ENN指标之间的量纲影响,对每项指标进行Z-score标准化处理,使不同指标的数值具有可比性,经过处理后每个指标的数据符合均值为0、标准差为1的标准正态分布。然后,基于MATLAB利用FCM算法对粤港澳大湾区的特别行政区、市和县进行空间格局类型的初步划分[34]。最后,参考FCM聚类划分的结果,对模糊隶属度较低的单元进行调整,确定城镇用地空间格局类型划分的数量和阈值,对各类型进行定义,总结归纳其几何特征和地理特征。
3.2 驱动力探测方法
本文使用地理探测器中因子探测器和交互作用探测器展开分析[35],探测粤港澳大湾区各因子对城镇用地空间格局的规模、形态、分布和空间格局类型特征的影响力和多因子交互作用强度与类型。
因子探测器从空间异质性角度探索潜在因素或解释变量,可以定量表示各可能影响因子的相对影响力大小,其将影响因子划分的子区内的城镇用地规模/形态/分布/类型指标变化的方差之和占研究区城镇用地规模/形态/分布/类型指标变化总体方差的比例作为该因子的影响力的定量解释,则影响力p的计算如公式(4)所示:
式中:ni和n分别为层i和全区的单元数;
交互作用探测器可以识别不同的影响因子对城市群空间扩展是否存在交互作用以及交互作用的类型和强度,如公式(5)所示:
式中:p(M)和p(N)分别表示因子M和因子N的影响力;p(M ∩ N)表示因子M和N交互作用后的影响力。
本文对13个影响因素的因子分析与交互作用分析均基于R语言的GD包实现,GD包可以对每个因子自动确定最佳的离散化方法和离散化数量,本文所有因子的离散化方法采用等间距法、自然间断点法和四分位法中的影响力最大者,离散化数量选择4~6个离散化划分中的影响力最大者[36]。
4 结果与分析
4.1 粤港澳大湾区城镇用空间格局
4.1.1 城镇用地规模、形态和分布特征
1978年改革开放以来,粤港澳大湾区城镇用地的规模、形态和分布特征发生了明显的时空变化(图3)。① 粤港澳大湾区城镇用地总面积从1980年的828.07 km2剧烈增加到2020年的4551.86 km2,其增长呈现近似“S”型曲线,即1990年前缓慢增长,1990—2010年快速增长,增长速率在2010年达到最大,2010年后增长速率减缓。② 城市群发展空间结构由单核发展演变为多核协同发展。1978—2000年香港特别行政区城镇用地面积居于首位,但与其他地区的差距逐步缩减。21世纪初,东莞市、中山市和佛山市南海区城镇用地面积急剧增加,涨幅高达2.5~8倍,深圳市龙岗区和宝安区城镇用地面积持续增加,超过香港特别行政区。③ 2010—2020年粤港澳大湾区城镇用地规模特征空间格局趋于稳定,城镇用地面积大于100 km2的行政单元集中分布于沿湾地区,面积介于20 km2和100 km2之间的行政单元主要分布在粤港澳大湾区的东西两翼,而西北部城镇用地面积普遍较小。④ 表征形态特征的城镇用地斑块分维数整体呈增加趋势,且在2010年达到峰值,城镇用地斑块形状的复杂性增加、紧凑性减弱。⑤ 对比香港特别行政区,其城镇用地规模虽为最高等级,但城镇用地形态一直保持为中高等级,而内地城镇用地扩张同时形态复杂性显著提高,提示2010年前的城镇扩张存在一定的无序性,但该现象在2020年规模特征接近稳定时有所改善,城镇用地斑块形状的紧凑性略有提高。⑥ 从分布特征来看,粤港澳大湾区城镇用地斑块分布整体上经历了“单一斑块集中分布”→“多斑块离散分布”→“多斑块集中分布”的演化过程。
图3
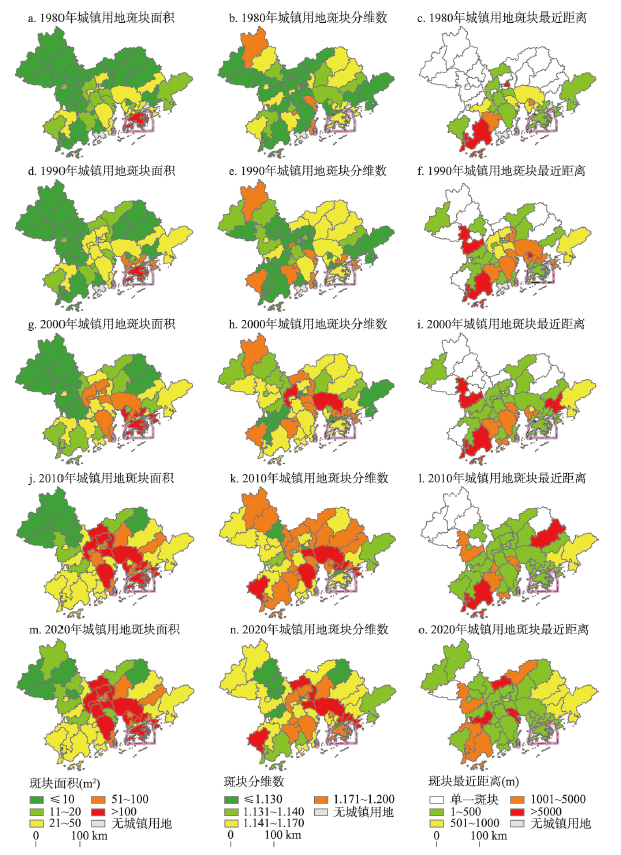
图3
1980—2020年粤港澳大湾区城镇用地规模、形态和分布特征
注:基于自然资源部标准地图服务网站GS(2019)4342号标准地图制作,底图边界无修改。
Fig. 3
Area, shape, and distribution characteristics of urban land in the Guangdong-Hong Kong-Macao Greater Bay Area during 1980-2000
4.1.2 空间格局类型划分与演变特征
从规模、形态和分布3个方面,基于FCM聚类对1980—2020年间粤港澳大湾区城镇用地空间格局类型划分。结果显示,1990—2010年的空间格局类型划分方式相似,1980年和2020年的划分方式与其他年份差异较大,这是由于40年的研究时段跨度较大,城镇用地空间格局的规模、形态和分布特征发生了显著的变化。为探索区域城镇用地空间格局类型演化特征,不同年份应以相同标准进行划分,其中,2010年的划分方式具有明显的划分阈值,因此,本文以2010年城镇用地空间格局类型划分方式为参考,综合考虑其他年份的特征,最终确定各年份的城镇用地空间格局类型和划分标准如式(6)所示,其几何特征和地理特征如表2所示。由于本文以区县级行政区划为研究尺度,个别行政区总面积较小,故认为土地城镇化率大于50%的行政单元也属于大面积型。划分结果表明,粤港澳大湾区城镇用地的规模和形状复杂性具有一定的正相关性。
式中:CA为区域城镇用地斑块总面积(km2);FRAC为面积加权斑块分维数;ENN为面积加权斑块最近距离(m);LandUrban为土地城镇化率。
表2 粤港澳大湾区城镇用地空间格局类型特征及典型图谱
Tab. 2
| 空间格局类型 | 几何特征 | 地理特征 | 典型图谱 |
|---|---|---|---|
| 分形/复杂大面积型 | ① 城镇用地斑块面积大于等于100 km2或土地城镇化率大于50%; ② 形状复杂。 | 城镇用地空间分布广、面积大,城镇用地边界复杂,分形特征较为明显,形状紧凑性较弱。该类型是城镇用地发展的相对高级阶段,城市基础设施健全,经济社会发展水平较高,人口密集。 | 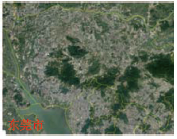 |
| 分形小面积型 | ① 城镇用地斑块面积小于100 km2; ② 形状复杂; ③ 面积加权平均斑块最近距离小于5000 m。 | 城镇用地空间分布范围较小,斑块面积相对较小,城镇用地边界复杂,呈现分形特征,形状紧凑性较弱。该类型是城镇用地发展的相对中级阶段,城市基础设施较为健全,经济社会发展潜力大,人口较为密集。 | 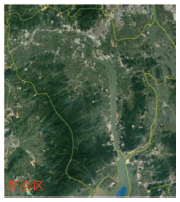 |
| 复杂小面积型 | ① 城镇用地斑块面积小于100 km2; ② 形状较复杂; ③ 面积加权平均斑块最近距离小于5000 m。 | 城镇用地空间分布范围较小,斑块面积相对较小,城镇用地边界较为复杂,形状紧凑性高于分形小面积型。该类型是城镇用地发展的相对中级阶段,城市基础设施较为健全,经济社会发展潜力大。 | 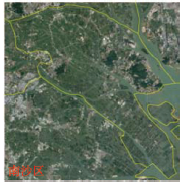 |
| 简单小面积型 | ① 城镇用地斑块面积小于100 km2; ② 形状简单紧凑; ③ 面积加权平均斑块最近距离小于5000 m。 | 城镇用地空间分布范围较小,斑块面积相对较小,城镇用地边界较简单,紧凑性较高。该类型是城镇用地发展的相对初级阶段,城市基础设施较为简单,经济社会发展潜力大。 | 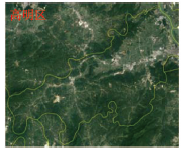 |
| 散布型 | ① 城镇用地斑块面积小于100 km2; ② 面积加权平均斑块最近距离大于等于5000 m。 | 城镇用地斑块面积相对较小,发展受地形、河流等因素影响呈现出典型的飞地特征,城镇用地斑块分布较为零散。该类型可能是城镇扩展过程中的过渡阶段,随着扩展程度的加剧,不同斑块会聚集成片;也可能是具有卫星城的城市,其主要城镇用地分布具有明显的空间分离性。 | 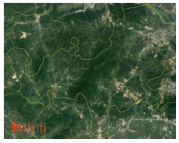 |
注:典型图谱截取自2020年谷歌地球遥感影像,亮灰色为城镇用地。
1979年党中央、国务院批准广东在对外经济活动中实行“特殊政策、灵活措施”,并决定在深圳、珠海、汕头等城市试办经济特区,为珠三角地区城镇化发展提供了新契机,此后,该区域城镇用地空间格局类型发生了较大的变化(图4)。1980—1990年粤港澳大湾城镇用地空间格局类型基本稳定,以复杂小面积型和简单小面积型为主,分形/复杂大面积型仅有香港特别行政区和广州市越秀区。2000年中国加入世界贸易组织后,珠江三角洲地区成为中国对外开放的前沿阵地,粤港澳大湾区的空间格局类型发生较大变化,分形/复杂大面积型和分形小面积型空间范围持续扩大,城镇用地发展呈现面积和形状复杂性同步增长的趋势。2010年后,随着国土资源优化配置的大力推进,粤港澳大湾区的形态特征得到优化,简单小面积型和复杂小面积型的城镇用地空间格局类型增加,规则性和紧凑性有所提高,散布型空间格局类型数量减少,城镇用地空间分布较为集中。
图4
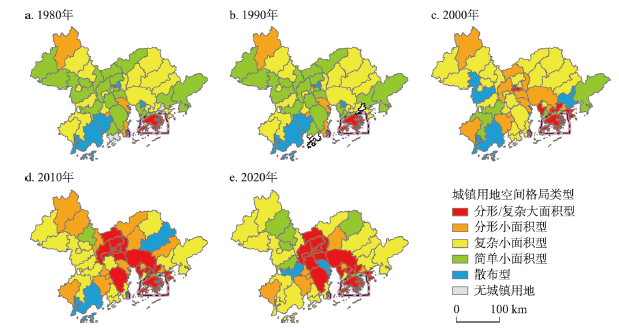
图4
1980—2020年粤港澳大湾区城镇用地空间格局类型分布
注:基于自然资源部标准地图服务网站GS(2019)4342号标准地图制作,底图边界无修改。
Fig. 4
Spatial distribution of pattern types of urban land in the Guangdong-Hong Kong-Macao Greater Bay Area during 1980-2020
4.2 粤港澳大湾区城镇用地变化驱动力分析
4.2.1 因子探测结果
1987年深圳市率先实行国有土地所有权和使用权分离改革,标志着以市场化手段配置土地制度的创立,此后,珠江三角洲地区城镇用地空间格局发生了较大的变化,深圳市多个行政单元城镇用地空间格局转变为大面积型,广州市、佛山市、东莞市城镇用地的形状特征趋于复杂,人口、GDP、地方财政收入、固定资产投资额和路网密度等社会经济因素对城镇用地面积和形态变化影响显著,但核心城市对城市群发展的牵引作用尚未显现。进入21世纪以来,广东省常住人口总量快速增长并进一步向珠三角中心城市聚集,粤港澳大湾区基于其特殊的区位优势、巨大的人口红利和廉价的土地要素,城镇用地迅速扩张[37],但受2008年全球金融危机以及自身产业结构调整的影响,珠三角经济增速减缓。在此期间,GDP和人口对城镇用地规模的影响力有所减弱,人口因素对城镇用地形状的影响有所增强。另外,随着香港、澳门的回归,粤港澳合作不断深化实化,香港、澳门特别行政区、广州市和深圳市的牵引力对城镇用地的规模、形态、分布及空间格局类型演变的影响显著提升。2010年后,各影响因子对城镇用地规模、分布和类型变化的作用差异有所减弱,但社会经济因素对形状特征的影响力上升,而核心城市的牵引力作用下降,结合该时段城镇用地形态趋于简单规则化的特征,从一定程度上表明了政府城市规划和设计的成果开始显现(图5)。
图5
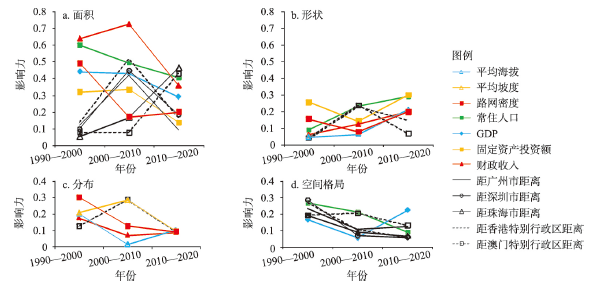
图5
1990—2020年粤港澳大湾区城镇用地规模、形态、分布和空间格局类型变化的影响力变化
注:仅显示研究期间在0.1水平上显著的影响因子。
Fig. 5
Driving forces of area, shape, distribution and pattern types characteristics changes of urban land in the Guangdong-Hong Kong-Macao Greater Bay Area during 1990-2020
4.2.2 交互作用探测结果
总体来看,驱动因子交互作用后对粤港澳大湾区城镇用地空间格局演变多具有促进作用。从不同维度来看:① 对城镇用地面积特征变化的影响力交互作用最为复杂且随时间发生较大的变化,2000年前以协同增强和非线性增强为主导,2000年后转变为协同增强、非线性增强和单因子减弱共同主导,各时间段交互作用平均影响力降低;社会经济因子间的交互作用对城镇用地面积特征的影响显著,具有显著影响的因子种类多、影响力大、交互作用复杂(图6a~6c)。② 对城镇用地斑块分维数的影响因子交互作用以非线性增强为主导类型,说明对城镇用地形状特征的影响因子通过交互作用,提高了因子单一作用时的影响力,且该交互作用具有随时间加强的趋势(图6d~6f)。因此,在规划城镇用地形态时,需要综合考虑各因子之间的相互作用,尤其是社会经济因子与坡度和核心城市距离因子的交互作用能够显著影响城镇用地的形态特征,需要重点考察。③ 对城镇用地斑块最近距离的交互作用平均影响力持续降低,其中,香港和澳门特别行政区对区域城市的影响和地形、交通等因子交互后,能够对城镇用地斑块分布产生显著影响(图6g~6i)。④ 对城镇用地空间格局类型的影响因子交互作用在研究期间均以非线性增强为主导类型,仅有少部分协同增强与单因子减弱的交互作用类型,交互作用平均影响力呈降低趋势。其中,距香港、澳门特别行政区及广州市、珠海市等核心城市的距离与人口、GDP和地形因子叠加后对城镇用地空间格局的类型演变起到促进作用(图6j~6l)。
图6
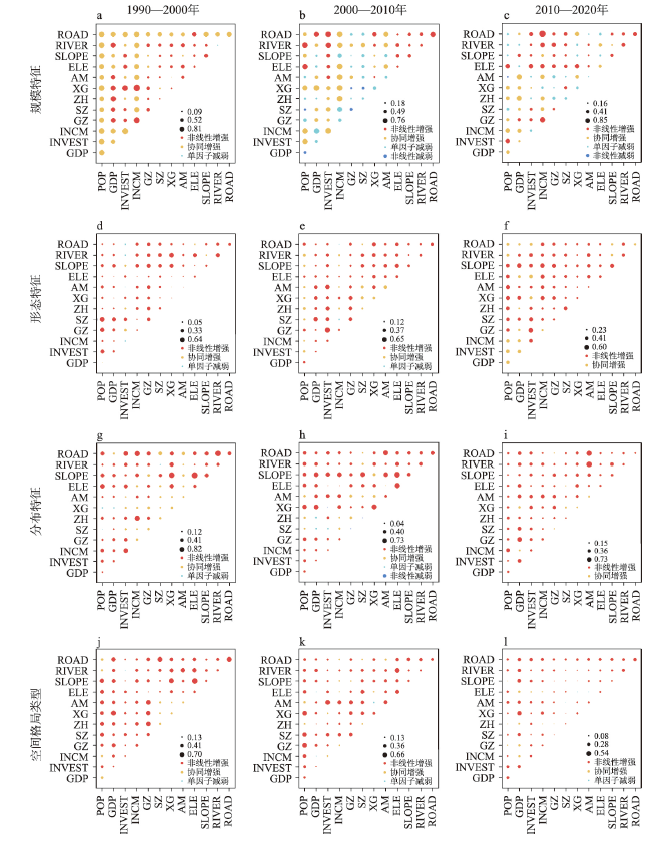
图6
1990—2020年粤港澳大湾区城镇用规模特征、形态特征、分布特征和空间格局类型变化驱动力交互作用
注:变量符号见
Fig. 6
Interaction of driving forces of area, shape, distribution and pattern types characteristics changes of urban land in the Guangdong-Hong Kong-Macao Greater Bay Area during 1990-2020
5 结论与讨论
本文基于1980—2020年粤港澳大湾区土地利用遥感解译数据,从规模、形态和分布3个维度,基于模糊聚类对1980—2020年粤港澳大湾区城镇用地空间格局类型进行划分与时空演变特征刻画,利用地理探测器对城镇用地扩展驱动力及其交互作用机制进行多维分析。主要结论如下:
(1)粤港澳大湾区城镇用地空间格局类型可划分为分形/复杂大面积型、分形小面积型、复杂小面积型、简单小面积型和散布型共5种类型,面积规模和形状复杂性呈现一定的正相关性。20世纪90年代后,随着改革开放的深入和土地要素市场化改革,粤港澳大湾区城镇用地空间格局类型发生较大变化,主要表现为分形/复杂大面积型空间格局类型以广州和深圳为中心的扩张,及分形小面积型空间范围持续扩大。2010年后,随着国土资源优化配置的大力推进,粤港澳大湾区的形状特征得到优化,简单小面积型和复杂小面积型的城镇用地空间格局类型增加,规则性和紧凑性有所提高,城镇用地空间分布更为集中。基于规模、形态和分布划分出的5种空间格局类型,有利于把握和分析城镇用地空间格局的主要特征,提高城镇用地时空格局表达的综合性和简洁性。
(2)1990—2000年人口、GDP、地方财政收入、固定资产投资额和路网密度等社会经济因素对城镇用地面积和形态变化影响显著,但核心城市对城市群发展的牵引作用尚未显现。进入21世纪以来,GDP和人口对城镇用地规模的影响力有所减弱,人口因素对城镇用地形状的影响有所增强。另外,随着粤港澳合作不断深化,核心城市牵引力对城镇用地的面积、形状、分布及空间格局演变的影响显著提升。2010年后,各影响因子对城镇用地面积、分布和类型变化的作用差异有所减弱,但社会经济因素对形状特征的影响力上升,核心城市的牵引力作用下降。
(3)驱动因子交互作用后对城镇用地空间格局演变大多具有促进作用。距核心城市距离与大多数因子交互作用后,表现为协同增强或非线性增强,说明核心城市的牵引作用与其他因子作用叠加会表现出更大的驱动力,这是因为核心城市一般作为城市群的经济中心、综合交通枢纽、科技教育文化中心,有利于提高资源的投资产出比,促进加快现代化城市建设。另外,路网密度、河网密度与多数因子交互也产生了“1+1>2”的效果,反映出交通优势对城镇用地扩展的强烈推动作用,交通基础设施作为城市群空间构筑和生产要素配置的纽带,使得不同城市要素联系加强[38];2018年随着港珠澳大桥的建成通车,珠海与香港、深圳之间的通勤效率极大提升,以珠海为核心的珠江西海岸地区将迎来重要发展机遇。
未来研究可结合兴趣点数据进一步区分不同功能的城镇用地,刻画其时空演变的空间格局和驱动力机制;更加精确地遴选和表达驱动因子,如目前针对交通要素选择路网密度进行表征,存在难以准确反映区域可达性和路网连接的公共服务资源等问题,后续研究可设计更具针对性的驱动因子进行定量表征;开展驱动力时空差异研究,从不同时间阶段的城镇用地发展的动力差异分析扩展到不同区位的城镇用地发展驱动机制研究;并将多因子交互作用的研究结果与城市群城镇用地变化模拟预测研究相结合,探索研究结果的应用价值。
参考文献
Economic spatial connection and spatial structure of guangdong-hong kong-macao greater bay and the surrounding area cities: An empirical analysis based on improved gravity model and social network analysis
粤港澳大湾区及周边城市经济空间联系与空间结构: 基于改进引力模型与社会网络分析的实证分析
Deciphering the spatial structure of China's megacity region: A new bay area the Guangdong-Hong Kong-Macao Greater Bay Area in the making
Understanding the structure and determinants of city network through intra-firm service relationships: The case of Guangdong-Hong Kong-Macao Greater Bay Area
Urban transformation and institutional policies: Case study of mega-region development in China's Pearl River Delta
DOI:10.1061/(ASCE)UP.1943-5444.0000160 URL [本文引用: 1]
Exploring the dynamics of migration to mega-delta cities in Asia and Africa: Contemporary drivers and future scenarios
Spatiotemporal patterns and driving forces of urban expansion in coastal areas: A study on urban agglomeration in the Pearl River Delta, China
Spatial and temporal characteristics of spatial expansion of urban land in Wuhan urban agglomeration
武汉城市群城镇用地空间扩展时空特征分析
Multi-dimensional analysis of urban expansion patterns and their driving forces based on the center of gravity-GTWR model: A case study of the Beijing-Tianjin-Hebei urban agglomeration
DOI:10.11821/dlxb201806007
[本文引用: 1]

Research into urban expansion patterns and their driving forces is of great significance. Under the background of the integrated development of the Beijing-Tianjin-Hebei (Jing-Jin-Ji) urban agglomeration, it is important to study the temporal and spatial patterns of urban land expansion and the driving forces development. This paper uses land-use data of the Jing-Jin-Ji urban agglomeration from 1990 to 2015 and reveals the multi-dimensional characteristics of the urban land expansion patterns. We then combine the urban spatial interaction and the spatial and temporal nonstationarity of the urban land expansion process and build the center of gravity-geographically and temporally weighted regression (GTWR) model by coupling the center of gravity model with the GTWR model. Using the center of gravity-GTWR model, we analyze the driving forces of urban land expansion at the city scale, and summarize the dominant mode and core driving forces of the Jing-Jin-Ji urban agglomeration. The results show that: (1) Between 1990 and 2015, the expansion intensity of the Jing-Jin-Ji urban agglomeration showed a down-up-down trend, and the peak period of expansion was in 2005-2010. Before 2005, high-speed development was seen in Beijing, Tianjin, Baoding, and Langfang, which were then followed by rapid development in Xingtai and Handan. (2) Although the center of gravity of cities in the Jing-Jin-Ji urban agglomeration showed a divergent trend, the local interaction between cities was enhanced, and the driving forces of urban land expansion showed a characteristic of spatial spillover. (3) The spatial development mode of the Jing-Jin-Ji urban agglomeration changed from a dual-core development mode to a multi-core development mode, which was made up of three function cores: the transportation core in the northern part, the economic development core in the central part, and the investment core in the southern part. The integrated development between functional cores led to the multi-core development mode. (4) The center of gravity-GTWR model analyzes urban land expansion as a space-time dynamic system. The model proved to be feasible in the analysis of the driving forces of urban land expansion.
基于重心-GTWR模型的京津冀城市群城镇扩展格局与驱动力多维解析
DOI:10.11821/dlxb201806007
[本文引用: 1]
城镇用地扩展格局及驱动力研究对城市群发展规划与决策具有重要意义。以京津冀地区为例,基于城镇用地扩展强度指数、城镇用地扩展差异指数、分形维数、土地城镇化率和重心转移模型,多维解析了城市群城镇用地扩展格局特征,并耦合重心转移模型和时空地理加权回归(GTWR)模型构建重心-GTWR模型,在对空间格局进行长时间序列多维度指标分析的基础上,运用该模型依序对其特征进行驱动力解读,进而总结凝练京津冀区域发展的主导模式与城市核心驱动力。主要结论为:① 1990-2015年,京津冀城市群城镇用地扩展强度呈现“下降—上升—下降”的趋势,高峰时期在2005-2010年,在2005年之前高速发展城市集中在北京、天津、保定和廊坊,2005年之后集中在邢台和邯郸;② 城市群城镇用地重心虽呈现出发散态势,但城市之间的局部相互作用力逐渐增强,城镇用地扩展驱动力表现出空间溢出特征;③ 京津冀城市群空间发展模式由以北京和天津为中心的双核发展模式向多核发展模式转变,并出现北部资源运输核心、中部经济发展核心和南部投资发展核心三大功能核心组团,城市群趋向于多核功能协同发展模式;④ 重心-GTWR模型结合了时空非平稳性和城市空间相互作用,将城市群城镇用地扩展作为一个时空变化系统进行分析,经验证,该模型在城镇用地扩展格局驱动力分析研究中具有可行性。
Spatio-temporal evolution characteristics and mechanisms of influence of urban construction land expansion in Xinjiang, the core area of the Silk Road Economic Belt
丝绸之路经济带核心区新疆城镇建设用地扩展的时空演变特征及影响机理
Impact of high-speed traffic on the temporal and spatial evolution of urban form in Shandong province
高速交通对山东省城市形态时空演变的影响
Spatial-temporal changes of urban spatial morphology in China
中国特大城市空间形态变化的时空特征
Urban expansion in China and its spatial-temporal differences over the past four decades
DOI:10.1007/s11442-016-1339-3 URL [本文引用: 1]
Analysis of the spatial cluster development characteristics of Pearl River Delta urban agglomeration from 2000 to 2017
2000-2017年珠三角城市群空间聚集发展特征分析
Research on spatial evolution of Zhongyuan urban agglomeration based on DMSP-OLS nighttime light data
基于DMSP-OLS夜间灯光数据的中原城市群空间演变分析
Study on urban expansion and gravity evolution in rapid urbanization areas based on nighttime light data: Taking Henan Province as an example
基于夜间灯光数据的快速城镇化地区城市扩展与重心演变分析: 以河南省为例
Analysis of the relationship between urban dynamic change pattern of the Yangtze River Delta and the regional eco-environment
长江三角洲地区城镇时空动态格局及其环境效应
The impacts of urban structure on PM2.5 pollution depend on city size and location
Theoretical analysis of interactive coupled effects between urbanization and eco-environment in mega-urban agglomerations
DOI:10.11821/dlxb201604001
[本文引用: 1]
Mega- urban agglomerations in China play a vital role in both national economic development strategies and national new-type urbanization, and undertake important historical responsibility with the world economic center transfer to China. However, they suffer a series of increasingly serious eco- environmental problems in the process of development. Thus,studies on the interactive coupled effects between urbanization and eco-environment in megaurban agglomerations are the frontier areas and high priority tasks in the earth system science for the future ten years. This paper analyses the basic theory frame of the interactive coupled effects between urbanization and eco- environment in mega- urban agglomerations systematically. In theoretical aspect, based on the nonlinear relationship and coupling characteristics of the natural and human elements in mega- urban agglomerations system, we could estimate the interactive coercing intensity, nearcoupling and telecoupling mechanism ofthe inside and outside mega-urban agglomerations system after scientific identification of the key elements, and then form the basic interactive coupling theory. Moreover, we could build a spatio- temporal coupling dynamic model, which is integrated with multi- elements, multiscales,multi-scenarios, multi-modules and multi-agents. The model will be used to develop the intelligent decision support system for urban agglomeration sustainable development. In methodology aspect, the mega- urban agglomeration is regarded as an open complex giantsystem. We should establish the standardized shared database for exploring the interactive coupled effects between urbanization and eco- environment. Then using new technology for analyzing big data and the integration methods incorporating of multi- elements, multi- scales,multi- targets, multi- agents, multi- scenarios and multi- modules, we can build a methodology framework to analyze the complex interaction coupling between urbanization and ecoenvironment. The technical route is to analyze spatiotemporal evolution characteristics, identifythe key elements, interpret coupling relationship, reveal the mechanism of coercing effect, find the general rules, filtrate the control variables, solve the critical thresholds, conduct regulation experiments, simulate different scenarios, propose an optimized schemes, and achieve national goals. Furthermore, we could put forward the overall optimization scheme. In general, this research could provide theoretical guidance and method support for the transformation and sustainable development in mega-urban agglomerations.
特大城市群地区城镇化与生态环境交互耦合效应解析的理论框架及技术路径
DOI:10.11821/dlxb201604001
[本文引用: 1]
特大城市群地区是国家经济发展的战略核心区和国家新型城镇化的主体区,担当着世界经济重心转移承载地的历史重任,但在发展过程中面临着日益严重的资源与生态环境的胁迫压力。开展特大城市群地区城镇化与生态环境交互耦合效应的研究,是未来10 年地球系统科学研究的前沿领域和高优先研究主题。本文系统解析了特大城市群地区城镇化与生态环境交互耦合效应的基本理论框架。首先从理论上分析了特大城市群系统各自然要素和人文要素交互作用的非线性耦合关系及耦合特征,科学辨识近远程主控要素作用下城市群系统内外部各要素相互作用的胁迫强度、近远程耦合机理与规律,总结特大城市群地区城镇化与生态环境交互耦合圈理论,进一步构建多要素—多尺度—多情景—多模块—多智能体集成的时空耦合动力学模型,研发特大城市群地区可持续发展优化智能调控决策支持系统;其次从方法上将特大城市群地区视为一个开放的复杂巨系统,在建立同一标准化共享数据库的基础上,采用多要素—多目标—多模型—多情景环境下的城镇化与生态环境交互耦合集成技术方法、大数据支持下的城镇化与生态环境交互耦合技术方法,构建多尺度—多技术—多智能体集成的城镇化与生态环境交互耦合技术框架,按照分析时空演变特征—寻求主控要素—辨识耦合关系—揭示胁迫机制—发现耦合规律—筛选调控变量—求解临界阈值—进行调控试验—完成情景模拟—提出优化方案—完成情景模拟—提出优化方案—实现国家目标这样一条技术路径,提出解决问题的整体优化方案。本文旨在为特大城市群地区由问题集中区转为可持续发展区提供理论指导和方法支撑。
Biodiversity in cities needs space: A meta-analysis of factors determining intra‐urban biodiversity variation
DOI:10.1111/ele.12427
PMID:25865805
[本文引用: 1]
Understanding varying levels of biodiversity within cities is pivotal to protect it in the face of global urbanisation. In the early stages of urban ecology studies on intra-urban biodiversity focused on the urban-rural gradient, representing a broad generalisation of features of the urban landscape. Increasingly, studies classify the urban landscape in more detail, quantifying separately the effects of individual urban features on biodiversity levels. However, while separate factors influencing biodiversity variation among cities worldwide have recently been analysed, a global analysis on the factors influencing biodiversity levels within cities is still lacking. We here present the first meta-analysis on intra-urban biodiversity variation across a large variety of taxonomic groups of 75 cities worldwide. Our results show that patch area and corridors have the strongest positive effects on biodiversity, complemented by vegetation structure. Local, biotic and management habitat variables were significantly more important than landscape, abiotic or design variables. Large sites greater than 50 ha are necessary to prevent a rapid loss of area-sensitive species. This indicates that, despite positive impacts of biodiversity-friendly management, increasing the area of habitat patches and creating a network of corridors is the most important strategy to maintain high levels of urban biodiversity. © 2015 John Wiley & Sons Ltd/CNRS.
Effects of urban morphology on traffic noise: A parameter study including indirect noise exposure and estimated health impact
Influence of urban forms on long-duration urban flooding: Laboratory experiments and computational analysis
Research on spatio-temporal characteristics and driving factors of urban expansion in Nanchang City based on BRT model
基于BRT模型的南昌市城市扩展时空特征及驱动因素研究
Spatial expansion pattern and its driving dynamics of Beijing-Tianjin-Hebei metropolitan region: Based on nighttime light data
DOI:10.11821/dlxb201612007
[本文引用: 1]
Urban spatial expansion has been research hotspot of urban geography for a long time. However, urban spatial progress and its driving forces showed diversified state under the context of different political systems and different development phases in the world. For example, there are debates on metropolitan expansion path between Western countries and China. One view advocated that metropolitan spatial expansion showed a trend from clustered to dispersed under the role of scale-economy. Another view found that above theory could not explain metropolitan spatial expansion progress in developing countries, such as China and India. In these metropolitan regions, rapid urban spatial expansion existed in "urban-rural integration" areas, not central big cities of metropolitan regions. Thus, it was different from Western developed countries due to particular political and economic factors in developing countries. In order to clarify metropolitan spatial pattern in a transitional period from planned economy to market economy, we utilized nighttime light data to analyze Beijing-Tianjin-Hebei metropolitan area from 1992 to 2012 as a case. A series of measurement methods has been used in the study, such as expansion intensity index, spatial correlation model and multi-dimensional model. The results are as follows: (1) Beijing, Tianjin, Tangshan were hotspot regions of metropolitan expansion during the whole research period. "Triangle region" among Baoding-Tianjin-Hebei were coldspot regions of metropolitan expansion. (2) Although metropolitan expansion has showed a dispersed trend, centralized powers are still strong in the progress of metropolitan development. (3) Metropolitan driving forces showed a diversified state. Market power was the main driving forces, followed by administration power, exogenous power and endogenous power. Market power, administration power and exogenous power has showed an upward trend. However, endogenous power has showed a downward trend. (4) We put forward some policy suggestions to optimize metropolitan spatial structure, such as reducing administrative intervention, building market-driven mechanism, strengthening internal and external two-way reform and promoting industrial upgrade.
转型期京津冀城市群空间扩展格局及其动力机制: 基于夜间灯光数据方法
DOI:10.11821/dlxb201612007
[本文引用: 1]
针对中西方城市群空间扩展路径研究的争论,以京津冀城市群为例,运用夜间灯光数据,采取扩展强度指数、空间关联模型、多维驱动力分析模型,定量揭示了城市群时空扩展路径及其动力机制。结果表明:① 1992-2012年,京津冀城市群时空扩展呈现以京津唐为核心的中心集聚扩展模式,保定—衡水—石家庄之间的“三角地带”成为城市群空间扩展的冷点区;② 城市群空间扩展虽然已经出现了扩散势头,但向心集聚的惯性作用力依然强大;③ 城市群时空扩展的动力机制表现出以市场力为主要驱动因子的特征,行政力、外向力和内源力对城市群空间扩展的影响作用依次递减,从城市群空间扩展的驱动力演化趋势看,市场力、行政力、外向力的影响呈现上升趋势,而内源力的影响系数则呈现下降趋势。最后,提出降低行政干预、构建市场主导机制、强化内外双向开放、推动产业升级政策建议,促进城市群空间结构持续优化。
Analysis of driving forces of urban land expansion in Wuhan metropolitan area based on Logistic-GTWR model
基于Logistic-GTWR模型的武汉城市圈城镇用地扩展驱动力分析
An insight on drivers of land use change at regional scale
DOI:10.1007/s11769-006-0014-5 URL [本文引用: 1]
The impact of interactions in spatial simulation of the dynamics of urban sprawl
DOI:10.1016/j.landurbplan.2004.08.006 URL [本文引用: 1]
A 2010 update of National Land Use/Cover Database of China at 1: 100000 scale using medium spatial resolution satellite images
DOI:10.1016/j.rse.2014.04.004 URL [本文引用: 1]
Driving forces and their interactions of built-up land expansion based on the geographical detector: A case study of Beijing, China
DOI:10.1080/13658816.2016.1165228 URL [本文引用: 1]
Code for Highway Classification
公路等级代码
Characterizing spatial patterns of population distribution at township level across the 25 provinces in China
DOI:10.11821/dlxb201508004
[本文引用: 1]
Spatial pattern of population distribution has a typical character of scale dependency. Fine-scale estimation of the population distribution has been a huge challenge in the field of population geography. In China, township is the finest administrative unit in official population census data. Thus, population density data at township level can be used to describe and characterize the population spatial pattern and changes elaborately, and support optimized layout plan of Chinese population, and government policy decision making. Township boundaries across 25 provinces in China had been collected in this study. The 5th national population census data was spatially joined to the boundary layer for population density calculation. Methods of Lorenz curve, geo-spatial analysis, and latitude/longitude transect had been applied to reveal the agglomeration degree, spatial patterns of population distribution with latitude and longitude. Based on the correlation and stepwise regression analysis, four variables, including relief degree of land surface (RDLS), water system density (WSD), road system density (RSD) and nighttime light index (NTL), were introduced to check the variety of population distribution in each province. The results showed that: (1) the variety of population distribution can be distinguished clearly by the mean population density on township scale than that of county level. (2) The overall population distribution can be characterized as dense in the southeast and sparse in the northwest, while lower population density occurs in some part of southeastern China, and vice versa. (3) The population density at township level along six designed longitude and latitude transects varies greatly. The possible impact factors include the three-level landscape features, local topography, regional economy, and the proximity to coastline, transportation hub, and hydrological systems. The correlation coefficient at provincial level, between the RDLS, WSD, RSD, NTL, and the population density has been identified as 0.56, 0.28, 0.61, and 0.69, respectively. At township level, topography and economy exert more impacts on population distribution in Liaoning, Jilin, Beijing, Tianjin, Shanghai, Hebei, Henan, Shaanxi, Shanxi, Shandong, Anhui, Jiangsu, Hunan, Hubei, Jiangxi, Zhejiang, Fujian, Guangdong, and Hainan. In addition to the four factors mentioned above, it is necessary to introduce more natural or social factors to explore the population distribution pattern in Tibet, Qinghai, Inner Mongolia, Yunnan, and Guizhou. This study expanded the research scale and dimension of the research in population geography research in China. The resulted population density dataset in 2000 is expected to enrich the baseline data resources for population geography development in China and the world.
基于乡镇尺度的中国25省区人口分布特征及影响因素
DOI:10.11821/dlxb201508004
[本文引用: 1]
人口空间分布具有典型的尺度特征,精细尺度的人口分布是当前人口地理学研究的热点和难点。乡镇(街道)是中国人口普查数据公开发布的最小行政单元,乡镇级人口密度计算及其分布特征研究能够更客观、精细地刻画中国人口分布的空间格局和态势,为促进中国人口的合理优化布局提供科学依据和决策支持。本文收集处理了2000年中国25个省(直辖市、自治区)的乡镇(街道)级行政边界数据,基于第五次人口普查乡镇(街道)人口统计数据,计算了乡镇级平均人口密度。采用Lorenz曲线、空间分析及样带分析的方法,分析了研究区乡镇(街道)人口分布的疏密结构、空间集聚性、纬向和经向规律。利用相关分析和逐步回归分析,分省探究了地形起伏度、水网密度、路网密度及社会经济发展水平(利用夜间灯光指数表征)等4个因素对于乡镇级人口分布的影响。研究表明:① 乡镇级平均人口密度能够有效区分出县域内部的人口密度高低差异,整体不均衡性高于基于县级平均人口密度的研究结果;② 乡镇(街道)人口分布总体规律是西北稀疏东南密集,同时,东南密中有疏,西北疏中有密;③ 乡镇(街道)人口分布的经纬向规律变异较大,既受中国三级阶梯地貌大势的影响,也受局部微地形及区域中心城市的影响,并和海岸线、交通枢纽及大江大河的分布具有一定的空间耦合性。④ 乡镇级平均人口密度与地形起伏度、水网密度、路网密度及夜间灯光指数等显著相关,省级平均相关系数分别为-0.56、0.28、0.61、0.69。⑤ 在乡镇尺度上,地形条件及区域发展水平对辽、吉、京、津、沪、冀、豫、陕、晋、鲁、皖、苏、湘、鄂、赣、浙、闽、粤、琼等省份的人口分布具有较强的决定作用。⑥ 对于藏、青、蒙、滇、黔等5省或自治区,需要引入更多的自然环境及社会因素来解释其人口分布的特殊规律。本研究扩充了中国人口地理学的研究尺度和维度,并引入了新的定量分析和空间分析方法,所构建的覆盖中国25省(直辖市、自治区)的乡镇(街道)级人口分布科学数据集丰富了中国人口地理学的2000年本底数据资源。
Methods research on describing the spatial pattern of land use types in China
DOI:10.11821/dlxb202001011
[本文引用: 2]
Understanding the evolving spatial pattern of land use is the basis of the theory and practice of land use/cover change (LUCC). It is helpful to optimize the use of land resources spatially and to improve the level of land use planning and management when the spatial patterns of land use are described effectively. At present, the commonalities in the scope of the spatial pattern of land use are still unclear, and research on the spatial pattern of land use has only recently begun to pay attention to the shape, patch distribution, structure, and relationships among different types of land use. In addition, the correlations among different pattern indicators have resulted in the redundancy in the pattern metrics. Further study is needed to establish the corresponding relationships between indicators and land use spatial patterns. This study summarized the area, shape, and patch distribution for land use maps as geometric characteristics, and summarized the structure and diversity as land use class characteristics. Based on the above conceptual model, an index system of land use spatial patterns was established. Then, the corresponding relationships between the indicators and the spatial patterns were established using fuzzy C-means clustering. The results indicated that the geometric characteristics of land use in China could be divided into five types: a simple large patch type, a complex large patch type, a complex small patch type, a simple small patch type, and a scattered type. Different geometric features reflected the characteristics of the area, the shape and the patch distribution and the combination of regional land use types. In 2010, there were 61 structures of land use in China, but a subset of 14 structures was the majority. The structural characteristics clustered in space and showed apparent spatial heterogeneity of different land use types. The diversity of land use in China was dominated by 3-5 categories, accounting for 66.69% of all the grids. The diversity over space was generally high in the northeast and the southeast, but low in the northwest. In summary, this study enriches the theoretical system of land use spatial pattern and fills a gap in the systematic description of the overall spatial patterns of China's land use.
中国土地利用空间格局刻画方法研究
DOI:10.11821/dlxb202001011
[本文引用: 2]
土地利用空间格局研究是土地利用/覆盖变化(LUCC)理论和实践的基础,对土地利用空间格局进行有效刻画有利于国土资源空间优化,提升土地利用规划和管理水平。由于土地利用空间格局的研究范畴尚不明晰,目前土地利用空间格局的研究对形状、斑块分布和结构等方面关注较少,缺乏对不同土地利用类型间相互关系的研究;同时,格局指标繁多且存在较大的相关性,如何建立指标与土地利用空间格局的对应关系值得进一步研究。本文在深刻理解土地利用空间格局内涵的基础上,将面积、形状和斑块分布总结为土地利用几何特征,将结构和多样性总结为土地利用类型特征,建立了土地利用空间格局刻画指标体系,利用模糊C均值聚类分析,明确了指标与空间格局间的对应关系。结果表明,中国土地利用几何特征可以划分为简单大斑块型、复杂大斑块型、复杂小斑块型、简单小斑块型和散布型五种,不同的几何特征反映了不同土地利用类型的面积、形状和斑块分布的特点,体现了区域土地利用类型的组合关系。2010年中国土地利用共存在61种不同的结构,但主要的结构类型仅有14种,结构特征具有明显的空间聚集性,体现了不同土地利用类型的空间分异性。中国土地利用多样性以3~5类为主,占比达66.69%,其特征总体上呈现“东北、东南高,西北低”的态势。该研究丰富了土地利用空间格局研究的理论体系,填补了中国土地利用整体空间格局刻画的空白。
Preliminary application of the fuzzy C-mean clustering method to the soil mapping in the lower reaches of Heihe River
模糊C均值聚类方法在黑河下游土壤属性制图中的初步应用研究
Geographical detectors-based health risk assessment and its application in the neural tube defects study of the Heshun region, China
DOI:10.1080/13658810802443457 URL [本文引用: 1]
An optimal parameters-based geographical detector model enhances geographic characteristics of explanatory variables for spatial heterogeneity analysis: Cases with different types of spatial data
The new process of urbanization in the Pearl River Delta
DOI:10.11821/dlyj020180505
[本文引用: 1]
Since the reform and opening up, the PRD (Pearl River Delta) region has started a rapid urbanization process by making full use of its open-policies and location advantages. However, it was this rapid development model that brought the PRD region into trouble when the international financial crisis broke out in 2008. In response to the crisis, the PRD region began to explore a new way to promote the process of urbanization. Firstly, this paper reviews the features of traditional urbanization in the PRD, which are foreign capital promoting, production factors driving, developing from below and open-policies oriented. Accordingly, this paper believes the reasons that make the PRD region into dilemmas are the rising of labor costs, the shortage of land resources, the restriction in exports and the constraints of environment. Then the paper puts forward the main four characteristics of the new urbanization process in the PRD region: (1) Seeking new impetuses for development by substituting the "resource oriented" mode with the "knowledge source oriented" mode. (2) Transforming to a composited development model which can activate the domestic capital, the heavy industry, and the large-scale enterprises instead of the traditional one relying on foreign capital, light industry and small business. (3) Changing the economic-centered strategy to the human-oriented concept. (4) Improving development quality through strengthening infrastructure construction, optimizing urban image and highlighting culture. (5) Promoting urban-rural coordination by implementing the rural revitalization strategy. Finally, the paper explores and comes to conclusions on four key issues about the new process of urbanization in the PRD region: (1) The essence of the new urbanization process in the PRD is to rely on technological progress to promote the transformation and upgrading of the industry. (2) The PRD region has some advantages in production efficiency, foreign trade, innovation, market economy consciousness and economic internationalization. If it can successfully get rid of the path dependency relying on the technological innovation, the "Pearl River Delta model" will become a typical one of urban agglomeration development in China. (3) The PRD region has to strengthen the innovation and reform, accelerate the transformation of social development and coordinate the relationship between urban construction and the carrying capacity of resources and environment, so as to break through the Middle Income Trap. (4) The PRD region should make good use of the national strategy on building the Guangdong-Hong Kong-Macao Greater Bay Area to deepen its cooperation with Hong Kong and Macao and play a greater role in global competition.
珠三角城镇化新进程
DOI:10.11821/dlyj020180505
[本文引用: 1]
改革开放以来,珠三角地区依靠优惠政策,利用区位优势,吸收外来投资,开始了快速城镇化的进程。总结珠三角快速城镇化的主要特点,即在开放政策的导向下,以土地、劳动力等生产要素为基础,外资推动、自下而上的城镇化。然而,2008年国际金融危机以来,这种模式的问题充分暴露。分析传统城镇化模式所遇的到劳动力成本上升、土地资源短缺、产品出口受限等困境,提出珠三角地区在解决困境中所形成的城镇化新进程的基本特点,即创新引领、复合驱动、以人为核心、强调品质、城乡协调发展并对珠三角城镇化新进程的本质特点、能否成功转型、与粤港澳大湾区的关系,以及能否再次成为中国城镇化的典范进行了探讨,以期为新时期珠三角地区以及中国城镇化可持续发展提供参考。
