

1 引言
如何有效地定量描述城市及城市群体的空间结构,一直是地理学工作者关注的难题。Mandelbrot提出的分形理论为解读城市形态提供了重要的分析工具[1,2]。自20世纪80年代以来,地理学家开展了诸多卓有成效的城市分布分形研究,发现了城市的大量分形特征,揭示了城市系统的复杂性。这些研究多数从单分形理论出发,强调分形体具有严格的自相似性、各向同性以及只存在一个标度因子[3,4]。但是,城市作为一个复杂系统,可能具有两个或两个以上的标度过程的分形,单一的分形维数不能满足描述不同区域及层次上不同的分布概率或生长概率,因此需要借助多分形理论来描述其结构特征。多重分形的概念首先由Mandelbrot和Renyi引入,随后Farmer等在1983年定义了多重分形广义维数[5]。地理学家通过测度复杂空间系统不同层次、不同部分的分形特征,借助多分维谱线开展结构分析[6],比单一分形维数分析能够揭示更加深刻的信息。
对城市内部空间结构的多分形研究,得到了很多有价值的认识。Ariza-Villaverde等采用沙盒多重分形法对位于西班牙Cordoba的两个不同街区进行了分析,研究表明相较于单一分形维数,Renyi多分维谱能够更好地揭示城市形态特征,展示不同社会经济制度和规划影响下形成的街道布局特征[7]。Roberto等通过对1786—2010年伦敦街道网络的多重分形进行分析,发现与单一分形维数相比,多分形能够更好地描述城市形态的动态变化[8]。Pavón-Domínguez等利用多分形研究西班牙的道路网络,揭示出其分形的地区差异性,并揭示出这种差异取决于基础子网的贡献[9]。Salat等基于1912年和2012年京都土地价格数据,运用多分形分析揭示了城市发展的非均衡特征,验证了多重分形谱线在测度空间分布异质性方面具有优于其他方法的准确性[10]。陈青等以郑州为例,根据郑州市域和市辖区建设用地的多分维分析城市用地的演化特征,从标度的视角揭示了城市发展过程的空间分异以及空间结构演化中的问题[11]。陈彦光等使用多分形方法研究了很多城市体系问题。该团队在早期基于多分形理论探讨了城市等级体系的数学模型,并以美国城市体系为例开展了实证分析[12];以豫北地区为研究区,对城镇体系空间结构的多分形性质进行了实证研究,揭示了其多分维谱特征[13];从人地关系的视角,运用多分维谱分别分析了河南省和京津冀地区的城镇体系和水系的空间结构,证明了城市体系的分形发育与水系的分维结构具有一定的数理关系[14,15],研究了京津冀地区的城镇建设用地和总建设用地的多分形结构特征,揭示了城市体系空间演化过程中带来的城市问题[16]。
2 研究区域、数据与方法
2.1 研究区域
图1

图1
长江中游城市群的地理位置和行政区划
注:基于自然资源部标准地图服务网站GS(2019)1651号的标准地图制作,底图边界无修改。
Fig. 1
The location and administrative division of urban agglomeration in the middle reaches of the Yangtze River
2.2 研究数据
本文采用2018年月平均NPP-VIIRS夜间灯光数据,综合利用位置与亮度信息。NPP-VIIRS数据未经短暂光源和背景噪声处理,这将造成影像数据在局部区域出现像元DN值波动[31],因此,应校正NPP-VIIRS灯光影像以提升数据精度。首先,以长江中游城市群矢量界线为掩膜对2018年每月的夜间灯光数据进行提取。为了避免夜间灯光影像网格形变带来的影响,将投影坐标系由WGS-1984坐标系转换为兰伯特等面积投影坐标系,并将影像重采样为500 m×500 m的网格。其次,为了去除背景噪声,采用已经经过官方处理并消除了灯光异常值和背景噪声的2016年年平均NPP-VIIRS夜间灯光影像作为掩膜数据,对2018年每月的夜间灯光数据进行处理,得到去除噪声的夜间灯光影像图。最后,由于NPP-VIIRS夜间灯光数据会存在非城市区域的极高亮度值像元,本文将长江中游城市群中GDP排名第一的城市武汉的中心区域的DN值作为极高值的阈值,以此过滤非城市中心的DN值极高值。最终处理得到的长江中游城市群2018年年度NPP/VIIRS夜间灯光影像图如图2所示。
图2
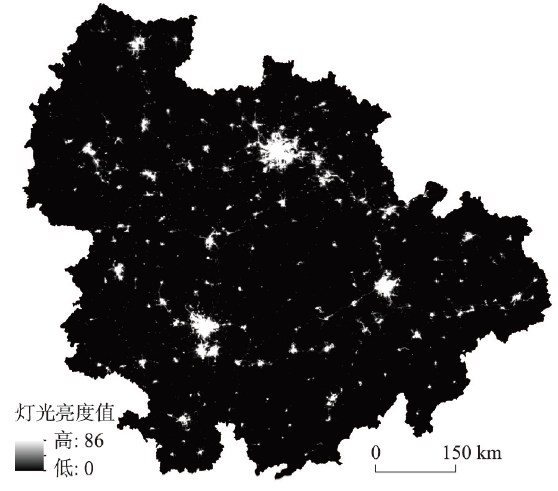
图2
2018年长江中游城市群NPP/VIIRS夜间灯光影像图
Fig. 2
NPP/VIIRS nighttime light data image of urban agglomeration in the middle reaches of the Yangtze River, 2018
2.3 研究方法与测算过程
本文借助一系列的多分维测度来进行多分形分析,以充分表达长江中游城市群内部空间结构差异[32]。多分形测度由全局参数和局部参数构成,以广义关联维数Dq和质量指数τ(q)为代表的全局参数揭示整体特征,以奇异性指数α(q)和其对应的局部维数f (α(q))为代表的局部参数揭示局部特征[3, 6]。参数q称为距次,通过改变参数q值,能够反映出长江中游城市群不同密度区域的分形特征。在多分维谱线中,当矩次q趋于正无穷时,揭示的是高密度区的信息,对应至地理空间,则表示长江中游城市群核心区、城市中心区域的变化特征,分维越高,说明其空间结构越复杂;当矩次q趋于负无穷时,揭示的是低密度区的信息,对应至地理空间中,则反映了城市群边缘地区、城市边缘地区的变化特征。矩次q = 0时,反映了多分形的容量维,代表了局部分维f (α)的极限。若q < 0时,q-Dq谱线收敛较慢;并且q > 0时,q-Dq谱线收敛较快,则说明高密度地区分形结构发育较为完善。反之,则说明低密度地区分形结构发育较为完善。
目前的研究中,测算分维多采用盒子法测量[33,34,35],该方法借助ArcGIS软件实现。① 确定最大盒子的范围,本研究选择各个城市群的行政区划边界的最小外接矩形为最大外框(图3)。② 创建多个尺度的盒子,通过ArcGIS软件,分别将长江中游城市群、环长株潭城市群、环鄱阳湖城市群、武汉城市圈、宜荆荆城市群的最大盒子划分为1×1、2×2、4×4、…、512×512,得到各个尺度的盒子。③ 城市分形体在不同尺度或区域具有不同生长几率[4],因此,应综合城市夜光位置与亮度信息,以揭示城市分形体内部的非均质结构。在数据处理中,将多边形转化为点集,能够更有效地反映分形特征[16]。基于此,本文提出一种新的数据转换方法:依据灯光亮度值,将预处理好的夜间灯光影像数据转为点的矢量数据,灯光亮度值为1的像元转化为1个矢量点,灯光亮度值为2的像元转化为2个矢量点,以此类推。④ 对多分形参数进行估计,其中,矩次q的范围取-30~30。选择这一范围主要是基于以下两个理由:一是从计算结果来看,对比-20~20、-30~30、-40~40这3个取值区间,当q = -30和q = 30时,已经非常接近相应参数的极限值;二是矩次q的绝对值过大会导致估算结果的可靠性大幅下降。在计算中,一个实体城市会被划分在多个不同盒子中进行计算,这符合分维测算的数理思想,即通过不同尺度的盒子覆盖分形体以测量分形体“面积”,虽然分形体面积不可测,但仍可通过测算“面积”的过程建立幂指数关系,据此测算分维等相关参数[36]。一个实体城市被多个盒子分割后,在分形测算中又将通过幂指数关系等测度重新整合。
图3
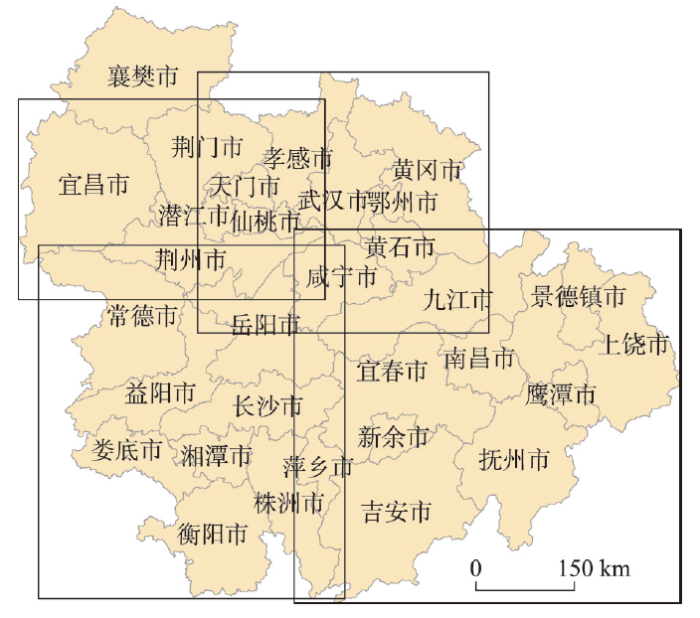
图3
长江中游城市群各分区最大外框示意图
Fig. 3
Largest boxes for fractal dimension estimation of urban agglomeration in the middle reaches of the Yangtze River and its four sub-agglomerations
在全局参数方面,Renyi广义关联维数表达式为[4]:
式中:使用盒子法测量分维数,每次使用不同的尺度为ε的盒子覆盖某城市群,Mi指城市群被盒子覆盖部分所包含的夜间灯光点数;M指城市群范围内所有夜间灯光点数。若同次覆盖的盒子尺度相同,则Pi可视为灯光强度的分布概率,即Pi越大,表示该区域夜间灯光分布密度越高。另一个全局参数是质量指数τ(q),其与广义关联维数的对应关系如下:
式(2)揭示了广义关联维数Dq和质量指数τ(q)间的等价性,基于此,本文主要运用广义关联维数q-Dq谱进行全局分析。
式中:Pi与式(1)意义相同。根据式(3)计算q值不同的情况下,Pi对应的μi。奇异性指数和相应的维数分别为:
运用最小二乘法,基于式(4)和式(5)计算奇异性指数α(q)和其对应的局部维数 f (α(q)),基于式(1)和式(2)借助估算参数Dq和τ(q)。
在局部参数中奇异性指数不同的值对应着城市群内不同的区域,在同一城市群中,奇异性指数越大说明其所对应的集合密度越低,反之则高。局部分维数f (α(q))是奇异性指数对应区域的维数,局部分维数越大,则奇异性指数对应集合的生长概率越低,反之则高。将奇异性指数α(q)与其对应的局部分维数f (α(q))结合构成局部分维谱α-f (α)谱,其不论上下左右,合理范围都是0~2之间。需要特别说明的是,在使用盒子法测度多分维时,得到的容量维是分维的上限,从而使D-∞的值上浮,进而导致其广义维数和奇异性指数都有可能突破嵌入空间的欧式维数限制,即D-∞ = α(-∞)>d = 2,突破的数值一般小于0.2[9]。对局部分维谱α-f (α)谱的解读,可以从以下3个角度展开:① 对比α-f (α)谱线的峰值,α-f (α)谱线是一条单驼峰的弧线,其峰值为(α(0), f (α(0)))。更大的α(0)意味着更高的空间填充程度;更大的f (α(0)意味着更复杂的空间结构[16]。② 奇异性指数的极差∆α,即α+∞和α-∞间的差值,α-f (α)谱线越宽则∆α越大,说明测度对象密度极值差越大,空间填充程度越高,空间异质性越强[16, 39]。③ 局部分维数收敛时的高度差∆f,∆f =f (α+∞)-f (α-∞),当∆f > 0时,α-f (α)谱呈单峰偏左,即研究对象的分形呈离心式发展;当 ∆f < 0时,α-f (α)谱呈单峰偏右,即研究对象的分形呈向心式发展[6];当∆f ≈ 0时,α-f (α)谱为一个左右对称的弧线,即研究对象的分形相对均衡发展[40]。
3 研究结果
3.1 整体结构特征
通过计算长江中游城市群夜间灯光多分形的全局参数和局部参数,得到Dq、τ(q)、α(q)和f (α)谱线相对于矩次q的展开结果。具体分析时,以广义关联维q-Dq谱和局部分维α-f (α)谱为主。广义关联维q-Dq谱对应的全局参数反映了长江中游城市群空间结构的整体情况,局部分维α-f (α)谱对应的局部参数反映长江中游城市群的单元格局情况。在分析广义关联维数Dq前,首先要确定长江中游城市群夜间灯光分维是否存在多个标度率,即判别双对数坐标图中散点是否呈线性分布。若是,则说明长江中游城市群空间结构具有自相似性,说明城市群各区域发展相对平衡;若否,即散点图中标度间断,则说明城市群空间结构具有自放射性,说明城市群内各区域发展差异较大。
3.1.1 整体容量维分析 长江中游城市群夜间灯光分布的容量维拟合结果如图4所示,其中D0为整体拟合的容量维数;D(1)为第一标度区维数,由前4个点拟合;D(2)为第二标度区维数,由后5个点拟合。长江中游城市群夜间灯光分布的容量维的整体拟合优度R2(0.9936)小于分段拟合的拟合优度R2(0.9993和0.9995),其容量维出现了显性双标度现象,表明长江中游城市群夜间灯光的分布在全域尺度上具有双分形结构,意味着长江中游城市群不同区域的分形发育不同步,即城市群内不同区域的发展呈不均衡状态,分形发育不足。这种现象出现的原因可能是因为长江中游城市群内部城市较多并且分布较分散,仍处于城市群发育的初级阶段,主要以中心城市带动周边城市发展为主,但由于城市之间存在相互竞争,武汉、长沙、南昌核心城市的极化发展也在一定程度上抑制了周边其他城市的发展,故在全域尺度上,长江中游城市群空间结构不均衡。
图4
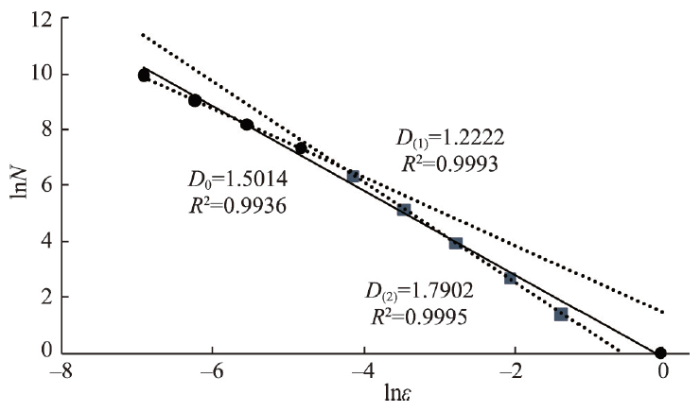
图4
长江中游城市群夜间灯光的容量维
Fig. 4
Nighttime light capacity dimensions of urban agglomeration in the middle reaches of the Yangtze River
3.1.2 整体广义关联维谱线分析 从全局参数出发,观察长江中游城市群整体广义关联维q-Dq谱线(图5a),长江中游城市群夜间灯光的q-Dq谱线突破理论上限2,但突破数值小于0.2,这可能是算法导致的偏差。q < -5.5时,长江中游城市群的夜间灯光分维超过了2,随着q值的减小,逐渐接近于2.2,过高的q值表明长江中游城市群边缘地区的扩展呈现无序状态。此外在q > 0时,随着q值的增大,Dq收敛较慢,在q < 0时,随着q值的减小,Dq收敛较快,表明长江中游城市群夜间灯光分布密集的地区分形结构发育不足。综上所述,长江中游城市群尚未形成有序的空间秩序。其原因是,首先长江中游城市群作为巨型城市群,区域内城市间城镇化发展状态差异较大,呈现出多组团竞争的格局;其次,在新型城镇化背景下,由于近年来长江中游城市群处于城镇化的高速发展期,城镇化速度加快,城镇空间向外扩张速率和内部开发强度差异显著,导致区域空间结构失序。
3.1.3 整体局部分维谱线分析 从局部参数出发,观察长江中游城市群整体局部分维α- f (α)谱线(图5b),其峰值为1.5014,高于其内部四大子城市群,这表明长江中游城市群空间结构较为复杂。长江中游城市群夜间灯光奇异性指数α(q)的宽度∆α为1.1543,高于长江中游城市群内部各子城市群,说明长江中游城市群空间异质性较强,内部区域空间结构差异较大。局部维数f (α)收敛时的高度差∆f < 0,表明长江中游城市群夜间灯光分布呈中心集聚模式,说明长江中游城市群城镇化发展主要围绕中心城市展开。
图5
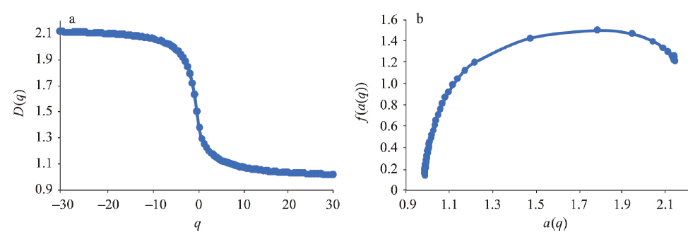
图5
长江中游城市群夜间灯光的广义关联维数和α-f (α)谱
Fig. 5
Multifractal dimension spectrum of urban agglomeration in the middle reaches of the Yangtze River
3.2 分区结构特征
长江中游城市群是一个由不同子城市群构成的复杂结合体,有必要对其进行分区研究。分区依据行政区划进行划分,即将长江中游城市群分为以武汉为中心的武汉城市圈、以长沙为中心的环长株潭城市群、以南昌为中心的环鄱阳湖城市群以及宜荆荆城市群。通过对以上4个分区城市群估算多分维谱,包括容量维、广义关联维数谱线和局部分维谱线,分析长江中游城市群内局部区域的空间特征,并对比分析其与整体空间结构的异同,解读长江中游城市群分形结构特征的成因。
3.2.1 分区容量维分析 首先分析4个子城市群夜间灯光的容量维。在容量维的拟合计算过程中(图6),D0为整体拟合的容量维数,D(1)为第一标度区维数,由前4个点拟合;D(2)为第二标度区维数,由后5个点拟合。结果显示环长株潭城市群、环鄱阳湖城市群、武汉城市圈夜间灯光的容量维的整体拟合优度R2均小于分段拟合的拟合优度R2,说明环长株潭城市群、环鄱阳湖城市群、武汉城市圈夜间灯光的容量维均有两个标度区,呈双分形结构,表明3个子城市群在不同尺度下分形的发育不同步,不同区域的发展呈不均衡状态。然而宜荆荆城市群夜间灯光容量维的整体拟合优度R2(0.9948)大于分段拟合的拟合优度R2(0.9939和0.9937),即宜荆荆城市群的夜间灯光容量维只存在一个标度区,表明宜荆荆城市群发展呈均衡状态,但分形结构发育不够完善。从局部区域反映整体结构上,表明长江中游城市群整体空间结构的不均衡主要是由环长株潭城市群、环鄱阳湖城市群、武汉城市圈共同作用的结果,受宜荆荆城市群的影响较小。
图6
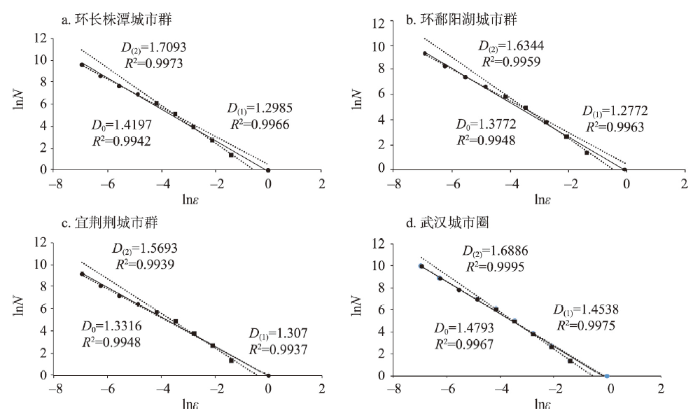
图6
环长株潭城市群、环鄱阳湖城市群、宜荆荆城市群、武汉城市圈夜间灯光容量维估计的双对数坐标图
Fig. 6
Log-log plots for capacity dimensions of nighttime light in the four sub-agglomerations in the middle reaches of the Yangtze River
在长江中游城市群中,武汉城市圈中武汉的发展速度、发展水平都远远超过其他城市;环长株潭城市群中长沙市、株洲市、湘潭市等发展进程较为一致,而同样存在发展较为缓慢的中小城市;环鄱阳湖城市群中,除了南昌,其他各市、县经济发展水平普遍偏低。因此,3个子城市群内均存在发育不同步、发展不平衡的特征。宜荆荆城市群中宜昌市、荆州市、荆门市呈等边三角形分布的特征,拥有相同的文化、相近的地理位置、相似的历史背景,3个城市中并未形成某个中心,而是基本同步发展,因此其空间结构较为均衡。
此外,分段拟合结果中第二标度区容量维D(2)与第一标度区容量维D(1)差值越小,表明自仿射性越趋向于向自相似方向演化。如表1所示,武汉城市圈的D(2)与D(1)差值较小,即武汉城市圈较环长株潭城市群和环鄱阳湖城市群演变为自相似性的趋势更明显。
表1 长江中游城市群及其分区夜间灯光容量维计算结果
Tab. 1
| 区域名称 | 整体容量维D0 | 第一标度区容量维D(1) | 第二标度区容量维D(2) | 标度区容量维差值D(2)-D(1) |
|---|---|---|---|---|
| 长江中游城市群 | 1.5014 | 1.2222 | 1.7902 | 0.568 |
| 环长株潭城市群 | 1.4197 | 1.2985 | 1.7093 | 0.4108 |
| 环鄱阳湖城市群 | 1.3772 | 1.2772 | 1.6344 | 0.3572 |
| 宜荆荆城市群 | 1.3316 | - | - | - |
| 武汉城市圈 | 1.4793 | 1.4538 | 1.6886 | 0.2348 |
3.2.2 分区广义关联维谱线分析 然后分别观察4个分区的广义关联维q-Dq谱(图7)。① 在q>0时,与长江中游城市群整体的变化趋势相似,q-Dq谱线随着q值的增大,武汉城市圈、环长株潭城市群、环鄱阳湖城市群和宜荆荆城市群Dq较慢收敛至接近水平线,表明4个子城市群的中心区域空间结构较为混乱。该现象是由各城市间发展水平差异和各城市内部开发强度差异导致的。② 在q>0时,武汉城市圈分维高于其他城市圈,长株潭城市群分维亦高于长江中游城市群整体,说明武汉城市圈和环长株潭城市群空间结构更为复杂。③ 长江中游城市群夜间灯光和环长株潭城市群夜间灯光的Dq函数在正矩处重叠,在负矩处存在差异,这意味着环长株潭城市群对长江中游城市群的空间结构有较大的影响,而他们之间差异可以理解为环鄱阳湖城市群、宜荆荆城市群、武汉城市圈等共同对长江中游城市群空间结构的影响。
图7
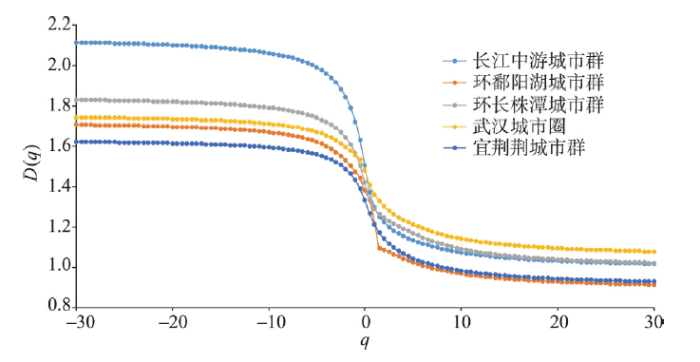
图7
长江中游城市群整体和分区的广义关联维q-Dq谱
Fig. 7
The generalized correlation dimension spectrum of nighttime light in the middle reaches of the Yangtze River and its four sub-agglomerations
3.2.3 分区局部分维谱线分析 最后,利用局部分维α-f (α)谱线探究4个分区的细节情况(图8),4个子城市群空间结构特征为:① 通过4条曲线的峰值对比,发现武汉城市圈的峰值最高,其空间结构最复杂;宜荆荆城市群的峰值最低,因此其空间结构较其他3个城市群来说更简单。② 4个子城市群α-f (α)谱线的宽度∆α较为相似,表明4个子城市群夜间灯光分布的最高密度和最低密度差异较为接近,空间异质性程度处于同水平。长江中游城市群整体的α-f (α)谱线宽度∆α高于4个子城市群,说明4个子城市群与长江中游城市群内部其他城市间差异较大。③ 4个子城市群α-f (α)谱线均呈单峰偏右,其收敛时的高度差∆f均小于0,表明4个子城市群均属中心集聚式发展。这揭示了4个子城市群集聚型的空间发育模式,也体现了灯光亮度数据揭示城市内部空间变化的优势。
图8
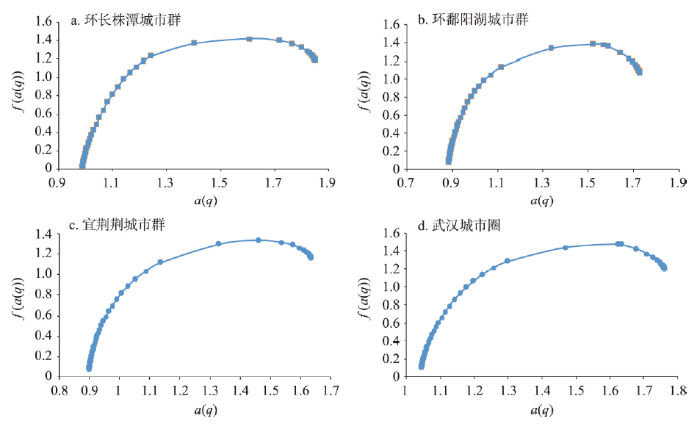
图8
环长株潭城市群、环鄱阳湖城市群、宜荆荆城市群、武汉城市圈的α-f (α)谱
Fig. 8
The partial dimension spectrum of nighttime light in the four sub-agglomerations of the middle reaches of the Yangtze River
4 结论与讨论
4.1 结论
本文依据复杂系统理论,基于2018年NPP-VIIRS夜间灯光数据,以长江中游城市群为研究对象,运用多分形模型,采用盒子法测量、最小二乘法计算多分形全局参数和局部参数,揭示不同尺度下长江中游城市群空间结构的多分形特征及其关系,发现及验证了诸多对长江中游城市群的经验认识:
(1)长江中游城市群区域一体化程度较低。长江中游城市群夜间灯光容量维分析表明该城市群在全域尺度上出现显性双标度的双分形结构,说明其内部发展不均衡。武汉城市圈、环长株潭城市群、环鄱阳湖城市群夜间灯光的容量维均呈现出显性双标度的双分形结构,区域内部发展不均衡;而宜荆荆城市群则呈现出单标度结构,区域发展相对均衡。从局部区域反映整体结构上,表明长江中游城市群整体空间结构的不均衡主要是由环长株潭城市群、环鄱阳湖城市群、武汉城市圈共同作用的结果,受宜荆荆城市群的影响较小。长江中游城市群双分形结构可能源于:其内部城市较多并且分布较分散,仍处于城市群发育的初级阶段,主要以中心城市带动周边城市发展为主,但由于城市之间存在相互竞争,武汉、长沙、南昌核心城市的极化发展也在一定程度上抑制了周边其他城市的发展,故在不同尺度上,长江中游城市群空间结构分异显著,尚未形成一体化格局。因此未来要重视长江中游城市群发展中存在的群内发展非均衡态势,中小城市应结合自身发展实际,融入到中心城市引领的城市群的发展进程之中,缩小群内各城市之间的发展差异。
(2)长江中游城市群空间结构在不同层级和区域存在差异,呈现出多尺度复杂特征。长江中游城市群广义关联维谱线表明,该区域夜间灯光分布密集地区分形结构发育存在不足,城市群边缘地区拓展也呈现出无序状态,该城市群尚未形成有序的空间结构。4个子城市群的广义关联维谱线表明子城市群间发展不同步,武汉城市圈的空间结构比宜荆荆城市群、环鄱阳湖城市群、环长株潭城市群的空间结构更复杂。这是由于在武汉城市圈中,武汉的发展远超其他城市,形成了显著的单中心结构。长江中游城市群和子城市群的α-f (α)谱线对比分析表明,相较于4个子城市群,长江中游城市群整体的空间结构更为复杂,4个子城市群与长江中游城市群内部其他城市间空间结构差异较大。对比分析长江中游城市群和子城市群的广义关联维谱线和α-f (α)谱线,可以发现长江中游城市群作为巨型城市群,区域内城市间城镇化发展状态差异较大,区内尚未形成统一的中心地等级体系,呈现出多组团竞争的格局,在不同尺度中涌现出了各具特色的局部空间,导致长江中游城市群整体空间结构混乱,空间拓展失序。因此,大中小城市协调发展和区域一体化仍是长江中游城市群未来发展的重点。通过规划方案和管理制度调整,强化城市群内不同发展水平城市间的联系,弱化区域空间异质性,能够使其更快达到均衡发展的状态,提高长江中游城市群的整体发展水平。
(3)长江中游城市群在不同尺度中均倾向于中心集聚式发展。长江中游城市群α- f (α)谱线分析表明,长江中游城市群空间结构仍处于初级的中心城市极化发展阶段,导致核心城市对资源的吸纳作用大于辐射带动作用,周边城市的资源要素仍然处于向核心城市集聚的过程。子城市群容量维分析表明宜荆荆城市群对长江中游城市群空间结构的影响较小。综上所述,由武汉、长沙和南昌组成的三角形区域是长江中游城市群发展的中心。4个子城市群均倾向于中心集聚式发展,其中武汉城市圈、环长株潭城市群和环鄱阳湖城市群主要围绕武汉、长沙和南昌3个中心城市发育。而宜荆荆城市群亦呈现显著的独立发展特征,空间结构变化主要集中于城市内部。因此,应强化城市群之间、城市之间的要素流动和网络联系,促进城市群一体化发展。
4.2 讨论
通过本文发现,利用多分维谱来研究城市群空间结构,能够从不同尺度、不同区域上揭示城市群空间结构的分异,判断出城市群非均衡发展特征,细分出不同类型的局部空间,进而提出优化发展建议。传统的关于城市群空间结构的研究,多从单一尺度对城市群空间结构进行探讨分析,无法揭示城市群空间结构的尺度依赖性问题。本文使用多重分形方法,将隐藏在无序表象背后的标度秩序呈现出来,有利于揭示城市群空间结构的整体与局部细节。
本文基于分形理论提出和尝试了一种夜间灯光遥感数据转化方法,能够较好综合夜间灯光遥感所包含的地理位置和灯光亮度两种信息,反映不同城市内部开发强度的差异,揭示出城市群空间结构中更微观的细节,更精确的表达不同尺度的城市群分形特征。
未来可以进一步深化的工作包括:① 目前是从静态层面对城市群空间结构特征进行研究,可以加入时间尺度的分析,从动态层面对城市群空间结构的演化过程进行研究。② 在夜间灯光数据处理上,背景噪声的处理目前无法做到完全精准,希望能有更好的处理方法。③ 在研究尺度上更加精细,更充分的探讨城市群微观空间特征。
参考文献
The fractal simulation of urban structure
DOI:10.1068/a181143 URL [本文引用: 1]
Monofractal, multifractals, and self-affine fractals in urban studies
DOI:10.18306/dlkxjz.2019.01.004
[本文引用: 3]

Fractal geometry provides a powerful tool for scale-free spatial modeling and analyses in geography. However, a number of basic concepts are puzzling. The three common fractals, that is, monofractal (unifractal), multifractals, and self-affine fractal, are often misunderstood by students of geography. This article clarifies some confusing fractal concepts for urban fractal modeling and fractal dimension analysis. Using simple mathematical models based on three growing fractals that bear an analogy to urban growth, we can distinguish the three types of common fractal structure. The similarities and differences between monofractal, multifractals, and self-affine fractal are as follows: 1) A monofractal is a simple self-similar fractal that bears only one scaling factor (scaling ratio), and a multifractal object is a complex fractal system that bears at least two scaling factors for different parts. Each scaling factor dominates all different scales and is independent of directions and levels. 2) A self-affine fractal bears different scaling factors in different directions of growth or at different levels of scales. The basic feature of self-affine growing fractal is anisotropy, which differs from the isotropic self-similar growing fractals. 3) Both self-affine fractal and multifractals may possess two scaling factors, but there are essential differences between self-affine fractals and multifractals. A self-affine fractal often takes on the form of bi-fractals, which can be reflected by two scaling ranges on a log-log plot. However, there is only one scaling range for a multifractal pattern. As an example, two-scaling fractal modeling is applied to the rank-size distributions of cities to illustrate the concept of urban multifractals. By comparison with these multifractal models, we can better understand monofractals and self-affine fractals in geographical research.
城市地理研究中的单分形、多分形和自仿射分形
DOI:10.18306/dlkxjz.2019.01.004
[本文引用: 3]
分形几何学在城市地理研究中具有广泛的应用,然而很多基本概念却让初学者感到迷惑。如何区分单分形、自仿射分形与多分形,是一个基本而重要的问题。简单分形容易理解,而真实的地理现象很少是单分形的。城市生长过程具有自仿射特征,而城市空间格局却具有多分形性质。作者发现,各种分形的共性在于三个方面:标度律、分数维和熵守恒。论文基于标度、分维和熵守恒公式,借助隐喻城市生长的规则分形来区分单分形、多分形和自仿射分形,讨论分形系统演化的机理、分形与空间自相关和空间异质性的联系,同时澄清一些在地理分形研究中的常见错误概念。最后以城市位序-规模分布为例,说明并对比单分形和多分形在城市地理研究中的建模与应用思路。
Fractal theory and its development
分形理论及其发展历程
Multifractals of central place systems: Models, dimension spectrums, and empirical analysis
DOI:10.1016/j.physa.2014.01.061 URL [本文引用: 3]
Multifractal analysis of axial maps applied to the study of urban morphology. Computers,
Multifractal to monofractal evolution of the London street network.
Multifractal approach for comparing road transport network geometry: The case of Spain
DOI:10.1016/j.physa.2018.07.034 URL [本文引用: 2]
Uncovering inequality through multifractality of land prices: 1912 and contemporary Kyoto
Multifractal spectral analysis of urban land use patterns of Zhengzhou City: 1986-2018
郑州城市用地格局时空演化的多分形分析
Multi-fractal dimension spectra of hierarchies of cities: Mathematical models and empirical analysis
城市等级体系的多分维谱: 数学模型与实证分析
A study of multifractal measures of the spatial structure of the urban system in central plains
豫北地区城镇体系空间结构的多分形研究
Multifractal measures based on man-land relationships of the spatial structure of the urban system in Henan
河南省城镇体系空间结构的多分形特征及其与水系分布的关系探讨
Spatiotemporal relationships between urban system and water system in the Beijing-Tianjin-Hebei region
京津冀城镇体系与水系结构的时空关系研究
DOI:10.18306/dlkxjz.2020.03.003
[本文引用: 1]
京津冀地区人水关系矛盾突出,分形可以有效描述城镇体系和水系时空演化特征,从而揭示两者演化关系,为城市问题的解决提供一些理论和经验依据。论文采用分形理论中的网格维数和多分维谱,首先分别刻画了两者的时空演化特征,其次探讨了城镇体系和水系结构之间的时空关系,最后探究了水系结构退化的影响因素。主要结论有:① 1990—2010年,京津冀地区建设用地的网格维数升高、自相似性增强、从集聚向分散转变,意味着建设用地朝着空间填充程度增强、有序、分散的方向发展,而水系反之,证明两者具有不同的时空演化方向;② 21世纪10年代,京津冀的人水关系十分紧张,南水北调虽然缓和了京津冀用水问题,改善了大尺度上的水系结构,但在小尺度上改善有限;③ 越靠近城市中心,建设用地分形形态发育越成熟,结构越有序,越靠近外围越混乱无序;④ 京津冀地区水系退化,由自然和人为两方面因素造成,21世纪以后人为因素的影响较为显著。针对京津冀地区水系退化,提出如下政策建议:在城市建设过程中,一方面科学规划城市水系,重视低等级水系的保护;另一方面节约集约利用水资源,完善水资源管理机制。未来,需要进一步探索城市发展和水系的非线性关系,为城市可持续发展提供依据。
Multifractal spectral analysis of land use structure of the Beijing-Tianjin-Hebei urban system
DOI:10.18306/dlkxjz.2019.01.005
[本文引用: 4]
<p>Cities and urban systems both bear scale-free properties, from which no characteristic scales can be found for mathematical modeling and quantitative analysis. Therefore, fractal geometry is useful for making scaling analysis. Complex urban systems cannot be effectively described by simple fractal models, but can be characterized by multifractal theory. This paper is devoted to exploring the spatiotemporal features of urban change in the Beijing-Tianjin-Hebei region from 1995 to 2013. Using multifractal parameter spectrums, we can reveal the spatial dynamics of urbanization from the aspects of urban form and urban system. The main findings are as below: 1) The spectral curves of global fractal dimension are abnormal. If <i>q</i>>1 and <i>q</i>→∞, the spectral lines quickly converge to horizontal lines; when <i>q</i><0 and <i>q</i>→-∞, the spectral lines quickly surpass the upper limit of fractal dimension, 2, which represents Euclidean dimension of embedding space. 2) The spectral curves of local fractal dimension are also not entirely normal. The peaks of the <i>f</i>(<i>α</i>) curves incline to the left, and the left ends of the curves are higher than the right ends. The problem lies in that the curves go beyond the maximum value of 2. 3) Fractal dimension growth curves can be described by the quadratic logistic function. Capacity parameters and inflection points of different fractal dimension growth curves are different. The main conclusions are as follows: 1) The urban fringes are disorderly developed, while the central areas of the main cities in the Beijing-Tianjin-Hebei region is overfilled with construction land, leaving little buffer space. 2) The main mode of urban growth is to expand to the outside region, but there are signs of central agglomeration in the total construction land of Hebei Province. 3) Land use of the main cities is close to saturation, and the speed of land expansion has peaked for Beijing and Tianjin, but not in Hebei Province yet. In short, it is necessary to optimize the land use structure in the Beijing-Tianjin-Hebei region by city planning.</p>
京津冀城镇用地空间结构的多分维谱分析
DOI:10.18306/dlkxjz.2019.01.005
[本文引用: 4]
城市形态和城镇体系都具有分形性质,但简单分形模型不能有效揭示城市系统的复杂结构特征及其背后的问题。多分形模型及分析方法是研究城市空间复杂性和描述城市异质性的有效手段。利用城镇建设用地和总建设用地的多分维谱分析,可以发现京津冀城镇体系及主要城市的空间演化问题。主要结果如下:①京津冀总建设用地的全局谱线不正常,代表中心区的谱线收敛过快,而代表边缘区和乡村地区的谱线收敛位置严重越界;②局部谱线单峰左偏,左(趋向中心区)高密、右(趋向边缘区)低疏,且右边数值越界;③多分维增长曲线服从二次logistic函数,但不同区域和城市的增长曲线的拐点位置不同。深入分析谱线特征及其异常根源,得出如下结论:①京津冀主要城市的中心区填充过密,没有太多缓冲空间,而边缘区无序扩展,需要通过规划进行优化;②京津冀城市生长以外延扩展模式为主,但河北省总建设用地有中心集聚迹象;③京津冀地区特别是主要城市用地接近饱和,土地扩展速度高峰已经过去,只有河北省部分区域例外。
The theory and practice of new urbanization in China
DOI:10.13249/j.cnki.sgs.2014.06.641
[本文引用: 1]
Issue of urbanization is a comphrensive subject which is related to harmonious development of each department of national economy and building a harmonious society. New urbanization is the guarantee of healthy and stable development of urbanization. The research work of the thesis has higher academic meaning and practical value. Urbanization promoted social and economic development of China in the past decades. But some problems arised in the process of urbanization in some areas, such as the rapid pace and disordered state of development, the blind expansion on the edge of cities, degradation of land and water resources, destruction of the ecological environment, and many unsafe, uncomfortable problems in urban environment.From the geographical space and natural resource conservation point of view, this article focuses on three theoretical issues. 1) How to have a good understanding of the basic characteristics and realizing route of new urbanization; 2) How to build a innovation model of new urbanization; 3) In the process of implementing new urbanization, how to understand the development law of China's urbanization, and to take a new road of urbanization with Chinese characteristics.
中国新型城镇化理论与实践问题
DOI:10.13249/j.cnki.sgs.2014.06.641
[本文引用: 1]
城镇化问题是当代中国社会经济发展的综合性课题,是涉及到国民经济各部门如何协调发展,达到一个新的现代化和谐社会发展的根本问题;新型城镇化是中国城镇化健康稳定发展的基本保证,在当前的新形势下,探索中国新型城镇化理论与实践问题,具有重要的学术价值与实践意义。在过去一阶段,虽然城镇化推动了中国社会经济发展取得了巨大成就,并在城市现代化建设与城乡一体化方面也取得了惊人的发展,但在某个时期或一些地区,城镇化过速发展阶段,出现了无序的发展状态,大中城市边缘盲目扩展,水土资源日渐退化,生态环境遭受破坏,特别是有些政府决策人对城镇化的许多制约因素认识不足,甚至决策失误,导致了城市环境出现许多不安全、不舒适的问题。着重从地理空间与自然资源保护的角度,探索中国新型城镇化3个理论与实践问题:① 如何认知中国新型城镇化的基本特征与新的路径;② 在全球经济一体化形势下,如何构建新型城镇化的创新模式;③ 在新型城镇化实施过程中,如何认识中国城镇化本身的发展规律,走具有中国特色的新型城镇化道路。
Basic rules and key paths for high-quality development of the new urbanization in China
DOI:10.11821/dlyj020180445
[本文引用: 1]
The high-quality development of the new urbanization in China is focused on man-earth harmony, people-oriented principle, low-carbon, ecology, innovation, wisdom and safety. It is an organic unity of high quality citizenization, infrastructure, living environment, urban construction, public service and urban management. Promoting the new urbanization is an important way for China to build a moderately prosperous society in all respects and achieve modernization basically, and it is an important way to realize the strategy of rural revitalization. To promote the development of China's new urbanization, we need to follow the four stage rule and gradual development rule. To realize the strategy transformation of new urbanization, it is necessary to make more changes: from the quantitative to the quality-oriented, from the "one step" to "step by step" in realizing our goals, from radical to gradual, from inducing "negative effect" to releasing the "positive energy", from passive to active, from "land-oriented" to "people-oriented". The current situation and background conditions of China's urbanization are very different from one place to another. Thus, we should avoid "one-size-fits-all" in promoting the development of new urbanization. Adhering to the principle of adapting local conditions and appropriate conditions, the paper divides the new urbanization area into five major types, including urban agglomeration region (I), major grain-producing region (II), farming, forestry, and animal husbandry region (III), linked poverty alleviation region (IV), and ethnic autonomous region (V), which are further divided into 47 sub-regions. The urbanization development mode between different regions and different subregions cannot be copied from each other, and we need to implement some diversified and differentiated models. According to the main functions of different types of urbanization regions, the different development policies of urbanization should be formulated, and development goals and priorities should be put forward according to local conditions, and the classification guidance should be proposed according to the appropriate conditions. The key paths to promote the high-quality development of China's new urbanization include: enhance the overall synergy of high-quality development and improve the quality of urban agglomeration development; promote the integrated development of industrial and urban areas and the equalization of basic urban public services, and improve the quality of urban development; propel integrated development between urban and rural areas and accelerate the revitalization of rural areas; highlight the main functions of urbanization quality development in different types of areas in accordance with local conditions; innovate institutional mechanisms and ensure that high-quality development is carried out throughout the trial process of new urbanization; standardize small towns with distinctive features and lay a solid foundation for the high-quality development of new urbanization; strengthen the analysis and regulation of the capacity of resources and environment for the high-quality development of new urbanization.
中国新型城镇化高质量发展的规律性与重点方向
DOI:10.11821/dlyj020180445
[本文引用: 1]
中国新型城镇化高质量发展是一种人地和谐、高效低碳、生态环保、节约创新、智慧平安的质量提升型城镇化,是高质量的城市建设、高质量的基础设施、高质量的公共服务、高质量的人居环境、高质量的城市管理和高质量的市民化的有机统一。高质量推进新型城镇化发展需要遵循城镇化发展的四阶段性规律和渐进式规律,实现新型城镇化由数量型向质量型、由“一步到位”向“分步到位”、由激进式向渐进式、由诱发“负效应”向释放“正能量”、由被动性向主动型、由“地为本”向“人为本”的战略转型。考虑到中国新型城镇化发展的地域差异显著,新型城镇化高质量发展客观上要因地制宜、因类指导,可将全国新型城镇化高质量发展区域划分为城市群地区(Ⅰ)、粮食主产区(Ⅱ)、农林牧地区(Ⅲ)、连片扶贫区(Ⅳ)、民族自治区(Ⅴ)共5大高质量发展类型区和47个亚区。未来推进中国新型城镇化高质量发展的重点路径包括:增强新型城镇化高质量发展的整体协同性,提高城市群发展质量;推动产城深度融合发展,加快实现基本公共服务均等化,提升城市发展品质与质量;推动城乡深度融合发展,在新型城镇化高质量发展中实现乡村振兴;突出因地制宜,明确不同类型地区城镇化高质量发展的主体功能;创新体制机制,全过程推进城镇化高质量发展;量力而行,以特取胜,规范建设特色小镇,夯实新型城镇化高质量发展的基石;把新型城镇化高质量发展与区域资源环境承载力及高质量保护有机结合起来。
Comparison and optimization of the spatial structure benefits of urban agglomeration: A case study of Changsha-Zhuzhou-Xiangtan urban agglomeration and Dongting Lake urban agglomeration
DOI:10.13249/j.cnki.sgs.2019.10.005
[本文引用: 1]
Urban agglomeration is an important space carrier to promote new urbanization, and the spatial structure is the spatial reflection of the degree, stage and process of urban agglomeration. From the 3 aspects of urban agglomeration benefit, distance benefit and spatial connection benefit, this article use ArcGIS and urban interaction intensity model to compare the spatial structure benefits of the Changsha-Zhuzhou-Xiangtan urban agglomeration and Dongting Lake urban agglomeration in the development stage. The results show that Dongting Lake urban agglomeration has a comparative advantage in external scale including the population scale, land area and the city quantity. However, the compactness of urban agglomerations is low, the advantages of urban scale structure are not obvious enough and the spatial connection between important cities is not tight enough. It shows a more obvious "big and scattered" characteristics, and the quality of development and the degree of development are not good. Changsha-Zhuzhou-Xiangtan urban agglomeration is relatively small in terms of number of cities, population size and land use, but its compactness and scale benefits are relatively high, and the scale structure has a relatively high degree of dominance. On this basis, aiming at maximizing the efficiency of urban agglomeration spatial structure, the spatial structure system of “one heart, two circles and three axes” and “1+5” urban agglomeration with Changsha as the center city is proposed, which to provide references for the optimization and development of the urban agglomeration spatial structure.
城市群空间结构效益评价与优化研究: 以长株潭城市群与环洞庭湖城市群为例
DOI:10.13249/j.cnki.sgs.2019.10.005
[本文引用: 1]
从城市群规模效益、距离效益和空间联系效益3个方面出发,运用ArcGIS和城市相互作用强度模型对长株潭城市群和环洞庭湖城市群空间结构效益进行评价比较分析。结果表明:环洞庭湖城市群在外在规模上具有相对优势,具体表现为人口规模、空间规模以及城市数量较大,但城市群的紧凑度不高,城市规模等级结构优势不够明显,空间可达性较差,重要城市之间的空间联系不够紧密,呈现“大而散”的特征;相对而言,长株潭城市群城市数量、人口规模及用地较小,但其紧凑度及规模效益较高,城市规模等级结构优势度相对较高,可达性较好,重要城市之间的空间联系较为紧密。在此基础上,以实现城市群空间结构效益最大化为目标,构建了以长沙为中心城市的“一心两圈三轴”结构体系。
Understanding the city-transport system of urban agglomeration through improved space syntax analysis
DOI:10.1177/01600176211023879 URL [本文引用: 1]
Measuring network configuration of the Yangtze River middle reaches urban agglomeration: Based on modified radiation model
DOI:10.1007/s11769-020-1131-2 URL [本文引用: 1]
Analysing the spatial structure of urban growth across the Yangtze River middle reaches urban agglomeration in China using NPP-VIIRS night-time lights data
Urban agglomeration development plan in the middle Yangtze River Basin.
http://www.ndrc.gov.cn/zcfb/zcfbtz/201504/t20150416_688229.html, 2015-04-13.
长江中游城市群发展规划.
http://www.ndrc.gov.cn/zcfb/zcfbtz/201504/t20150416_688229.html, 2015-04-13.]
A scientometric visualization analysis for night-time light remote sensing research from 1991 to 2016
An overview on data mining of nighttime light remote sensing
论夜光遥感数据挖掘
GDP spatialization in China based on nighttime imagery.
DOI:10.3724/SP.J.1047.2012.00128 URL [本文引用: 1]
夜间灯光遥感数据的GDP空间化处理方法
DOI:10.3724/SP.J.1047.2012.00128
[本文引用: 1]
随着夜间灯光遥感数据的应用日渐成熟和资源环境研究领域,对空间型社会经济数据的需求增加,利用相关分析和回归分析的方法,首次定量探讨夜间灯光数据与统计型的社会经济数据的空间关系。为提高模型精度,按照我国省级行政边界分区建模,分析全国县级的地区生产总值、第一产业、第二产业、第三产业分别与夜间灯光指数的空间相关关系,最终建立全国的1km GDP密度图。结果表明,全国范围的夜间灯光数据与第一产业的相关性不明显,相关系数0.554,模型拟合效果差,R<sup>2</sup>为0.306;夜间灯光数据与地区生产总值、第二产业、第三产业均有明显的对数线性关系,尤其是与第二产业和第三产业之和,相关系数为0.824,R<sup>2</sup>为0.679。利用分区模型估算,生成的GDP密度图能较完整地反映全国社会经济分布详况,以及宏观分布特征。
Evolution process of urban spatial pattern in Hubei province based on DMSP/OLS nighttime light data
DOI:10.1007/s11769-016-0814-1 URL [本文引用: 1]
Spatial pattern evolution and optimization of urban agglomerations in the middle reaches of the Yangtze River: A method based on DMSP/OLS night light data
长江中游城市群空间格局演变及优化研究: 基于DMSP/OLS夜间灯光数据的方法
Aligning pixel values of DMSP and VIIRS nighttime light images to evaluate urban dynamics
Potential of NPP-VIIRS nighttime light imagery for modeling the regional economy of China
DOI:10.3390/rs5063057 URL [本文引用: 1]
Regional inequality in China based on NPP-VIIRS night-time light imagery
Multifractal phenomena in physics and chemistry
DOI:10.1038/335405a0 URL [本文引用: 1]
Multifractal characterization of urban form and growth: The case of Beijing
DOI:10.1068/b36155 URL [本文引用: 1]
Remote sensing-based fractal analysis and scale dependence associated with forest fragmentation in an Amazon tri‑national frontier
DOI:10.3390/rs5020454 URL [本文引用: 1]
Bi-fractal structure and evolution of the Beijing-Tianjin-Hebei region urban land-use patterns
DOI:10.18306/dlkxjz.2019.01.007
[本文引用: 1]
One of the indicators of regional integration of urban and rural areas is the integration of the structure of systems of cities and towns. This process can be described and evaluated using the concept of scaling. Fractal geometry is one of the powerful tools for scaling analysis. An important parameter of geographic spatial distribution characteristics is fractal dimension. Based on data derived from remote sensing images and census data, this study carried out fractal analysis, rank-size distribution analysis, and allometric scaling analysis of cities and urban system in the Beijing-Tianjin-Hebei region. The aim was to explain the process of urban growth in the region from 1995 to 2013. The results show three characteristics of urban form and growth: 1) Both the spatial structure and the rank-size distribution of the cities in the Beijing-Tianjin-Hebei region are of self-affine pattern, indicating bi-fractal property. 2) The relationship between urban population and urban area of the Beijing-Tianjin-Hebei region indicates a false linear correlation. 3) With the change of the urban system, the self-affine bi-fractal structure evolved gradually into a self-similar fractal structure. The main conclusions are as follows: 1) There is a structural incongruity in the system of cities and towns in the Beijing-Tianjin-Hebei region. The urban hierarchy takes on a dual structure, but the direction of urban change shows a significant trend of internal structure integration. 2) Land use in large cities is not intensive enough. The unordered expansion of urban fringe led to the waste of land resources. Planners and local governments should make use of the characteristics and trends of change of the urban system to formulate planning schemes and management measures.
京津冀城市用地形态的双分形特征及其演化
DOI:10.18306/dlkxjz.2019.01.007
[本文引用: 1]
区域城乡一体化的标志之一是城镇体系结构的一体化,这个过程可以从标度的角度进行描述和评价。分形是标度分析的重要方法,地理空间无尺度分布特征的典型参数是分维。论文以京津冀城镇体系为例,利用遥感图像的解译数据和人口普查数据开展分形分析、位序-规模分布分析和异速标度分析,用以解释1995—2013年间京津冀城镇体系演化的过程。结果表明,京津冀城镇体系及其演化的特征有:①京津冀空间结构和位序-规模分布都表现为自仿射双分形结构;②京津冀区域的城市人口-城区面积异速标度退化为假线性关系;③随着城镇体系的演化,自仿射的双分形结构逐步向自相似分形结构演化。由此得出结论:其一,京津冀城镇体系存在结构性的不协调因素。其空间结构和等级结构具有二元化特征,但演化方向却呈现内在结构一体化的显著趋势。其二,大城市用地不够集约。城市边缘区的无序扩张导致土地利用铺张浪费。地方政府和规划专家可以有意识地利用城镇体系演化的这种特征和趋势制定管理措施和优化规划方案。
Approaches to estimating fractal dimension and identifying fractals of urban form
DOI:10.18306/dlkxjz.2017.05.001
[本文引用: 1]
Fractal cities and city fractals have been studied for about 30 years, but many basic problems have not yet been fully solved. Among the various basic fractal problems about cities, the most important are how to estimate fractal dimension and how to identify fractal nature of a city as a system or a system of cities in an effective way. Based on urban form and the box-counting method, this article discusses the approaches to calculating fractal dimension and determining fractal property of cities. The theoretical foundation of fractal dimension computation is the concept of perfect covering. In other words, in the process of fractal dimension measurement, a fractal object should be covered with boxes in the best way: nothing more, nothing less. In practice, it is hard to find the optimal way of box covering. Therefore, three rules should be followed. First, the sequence of measuring scales should be consistent with the cascade structure of a fractal city so that the fractal details can be captured in a reasonable way. Second, the operation of obtaining observational data should be simple and convenient to use so that the method can be applied by beginners. Third, the size of the dataset for fractal dimension estimation should be large enough so that the result of fractal parameters is stable. A conclusion can be reached that the geometric scale rather than the arithmetic scale should be employed to make a measurement because the fractal structure can be abstracted as geometric sequences instead of arithmetic sequences, and the measuring scale sequence should comply with the 1/2n rule (that is, 1, 1/2, 1/4, …). After estimating the fractal dimension of a city, the fractal property can be identified by the statistics from fractal dimension calculation. The good way of identifying the fractal nature of urban form is to use confidence statement, which consists of fractal dimension values, margin of error, and level of confidence. Given a level of significance (for example, α=0.05), we can draw an inference that a city's form is of fractal structure because it has a fractal dimension with a determinate level of confidence (for example, (1-α)×100%=95%). Using statistical analysis, however, one can never have full (100%) assurance that a city has a fractal form.
城市形态的分维估算与分形判定
DOI:10.18306/dlkxjz.2017.05.001
[本文引用: 1]
城市形态的分形是城市发育到一定阶段涌现出的有序格局和复杂结构,其基本特征是空间分布的无尺度性质。当研究者基于某个显著性水平推断城市分维存在时,实际上就是基于相应的置信度判断分形特征。虽然分形城市研究已经多年,但大量有关维数测算的基础问题依然悬而未决。本文根据分形几何学的基本思想论证城市形态分维测算的若干问题。分维测量的准则是最佳覆盖——不多不少、恰到好处的覆盖。盒子覆盖是最容易理解的测量方法。采用盒子覆盖法测量城市形态分维时,应考虑三个标准:一是快速逼近,二是简便操作,三是稳定拟合。直观估计分维的办法是利用双对数坐标图。由于城市形态不是严格意义的分形,而是类似于文献中的“前分形”,测量尺度与相应测度的幂律关系通常仅在一定尺度范围内有效,从而形成所谓标度区。本文围绕城市形态的分维测量和分形判断开展一系列讨论,包括尺度选取、标度区识别和统计标准等问题,对今后城市分形研究具有理论启示和方法论的参考价值。
Direct determination of the f(α) singularity spectrum
A comparison between two OLS-based approaches to estimating urban multifractal parameters
Multifractal analysis of Hang Seng index in Hong Kong stock market
DOI:10.1016/S0378-4371(00)00606-3 URL [本文引用: 1]
Multi-fractal measures of city-size distributions based on the three-parameter Zipf model.
DOI:10.1016/j.chaos.2004.02.059 URL [本文引用: 1]
