

1 引言
生态系统服务是指人类直接或间接从生态系统中获得的所有惠益[1,2]。随着社会经济的发展和人类活动的增强,区域自然生态系统受到人类干扰的影响越来越大,让原本脆弱的生态环境愈加恶化[3,4]。2005年联合国发布的千年生态系统评估(the Millennium Ecosystem Assessment, MA)报告表明,过去半个世纪内全球24项生态系统服务已有15项发生了退化[5]。因此,在人类社会快速发展过程中,如何有效评估和管理生态系统服务已成为可持续发展的关键[6,7]。依据生态系统服务的空间分异规律对区域生态功能进行地理分区,划定生态系统服务功能区,有利于促进生态系统政策制定和管理,对于提升人类福祉具有重要的现实意义[6]。
1976年Bailey从生态系统角度提出了首个真正意义上的生态区划[18]。此后,各国学者加强了生态区划相关研究[19],使其理论与方法都取得了快速发展。近年来国际上对于生态系统服务的制图和区划也逐渐重视起来[20],但是国内起步较晚,生态系统服务分区的研究方法还不成熟,与之相类似的区域多称之为“生态功能区”[21]。20世纪末傅伯杰等建立了中国生态环境综合区划的原则、方法和指标体系[22],并提出了中国生态区划方案,为进一步在全国范围内开展生态功能区划奠定了坚实基础[23]。在此基础上,国家环保部和中国科学院于2008年和2015年先后发布了《全国生态功能区划》[24]和《全国生态功能区划(修编版)》[25],明确了不同区域生态系统的主导服务类型及生态保护目标。此后,学者们对生态功能区划开展了大量的研究工作,取得了丰富的研究成果[26,27,28,29]。评估方法上,除通过构建生态服务功能重要性指数[30]、综合指标法[31]进行生态功能分区外,常采用自组织特征映射网络(SOFM)[21, 32]或K-means聚类分析法[33]识别生态系统服务簇,在分类基础上对研究区进行生态功能分区。其中学者们通过识别生态系统服务簇,进行了城市地区[34]、山区[35]和流域[36]等不同尺度的生态功能区的划定,但针对特定的地质条件和地貌特征区域的生态系统服务功能分区研究较少,尤其在喀斯特山区则更为鲜见。
中国是世界上喀斯特地貌分布最广的国家之一,喀斯特地区约占国土面积的15%[37]。喀斯特地区生态系统类型多样[38],为人类提供了多项生态系统服务[39,40]。但该地区生态系统具有低环境容量和低抗干扰能力的特征[41]。随着城镇化的快速推进和不合理的土地利用方式的转变,自然资源消耗日益严重,石漠化和水土流失等地质灾害加剧,破坏了喀斯特生态系统的内部结构,生态系统退化加剧[42]。研究喀斯特地区生态系统服务时空格局特征及其功能分区对于维护区域生态安全、国土空间开发保护及促进区域可持续发展具有重要意义。然而,目前针对喀斯特山区生态系统服务格局的研究多从静态的、单一的生态系统服务的维度开展[43,44,45],动态的、多种生态系统服务价值的研究较少。特别是基于多种生态系统服务价值评估结果开展喀斯特山区生态系统服务功能分区的研究更加缺乏[46]。
因此,本文以地处滇东南喀斯特山区的典型区域——文山市为例,选择食物供给、产水量、植被净初级生产力(NPP)、土壤保持、生境质量和旅游文化6项生态系统服务,定量估算2000—2017年各项生态系统服务价值,分析各项生态系统服务时空格局特征,揭示其动态演化规律;识别生态系统服务簇,划分喀斯特山区生态系统服务功能区,并针对各功能区不同的主导服务类型提出差异化的生态系统管控建议。研究结果可为其他喀斯特山区城市生态保护及土地管理提供参考,对复杂的喀斯特生态系统科学制定和实施生态系统服务管理政策具有重要的意义。
2 材料与方法
2.1 研究区概况
云南省是中国三大喀斯特中心之一,以文山州石漠化土地分布面积最广,发生区域相对集中。该州8县均被列为国家石漠化综合治理试点县(市),其中文山市地处文山州西部(23°06′N~23°44′N,103°43′E~104°27′E)(图1a),国土面积2977.19 km2。据中国第三次石漠化监测结果,截至2016年底,文山市喀斯特土地面积共2335.22 km2,占国土面积的78.44%,石漠化土地面积939.90 km2,占全市喀斯特土地面积的40.29%,喀斯特地貌广布,石漠化较为严重(图1b)。总体地势西北高、东南低,地形复杂,境内峰谷相间,山峦连绵起伏,岩溶发育,是典型的峰从洼地分布区,最高海拔2991.2 m,最低海拔618 m,高差大,山区、半山区面积占全市总面积的90%,平坝区域仅占10%,属典型的高原喀斯特山区城市。
图1
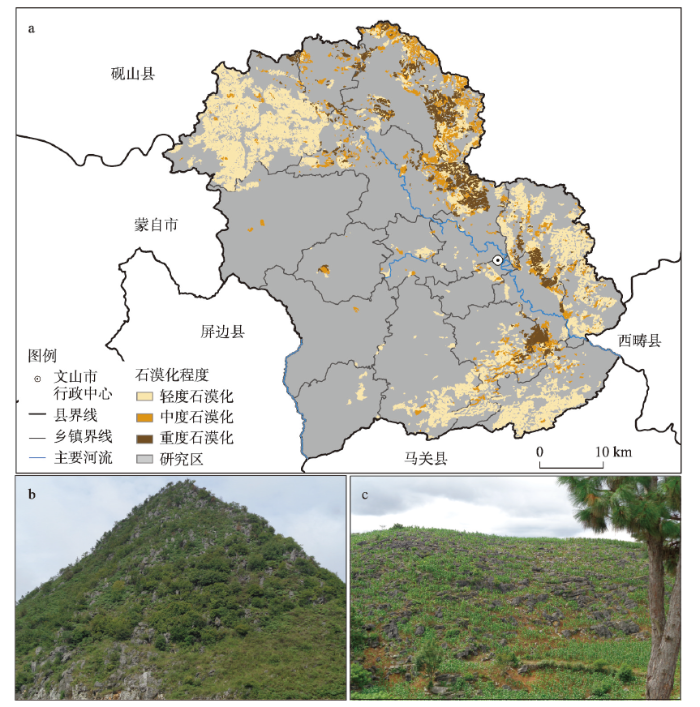
图1
研究区位置示意及野外考察图
注:图b、c由赵筱青2018年分别于文山市柳井彝族乡和文山市古木镇拍摄。
Fig. 1
Diagram of the location of the study area and field surveys
文山市生态环境脆弱,土壤以红壤、石灰岩土和黄棕壤土为主,土壤肥力较低,岩石裸露率高,石漠化程度严重,土层浅薄,土地生产力较低。境内纬度低,属亚热带季风气候,2017年年均降水量为1152.4 mm,降雨时空分布不均,全年降雨量的80%来自于雨季,降水的高度集中极易发生水土流失,导致石漠化程度加深,同时自然灾害频发,生态系统遭受破坏,生态恶化。截至2017年底,文山市社会经济发展水平相对滞后,全市常住人口50.10万人,人口密度167.15人/km2,人均耕地面积较少。全市1281.86 km2耕地中,25°以上坡耕地所占比重较大,已成为当地居民赖以生存的基本农业生产用地,耕地质量较差,土地利用方式粗放,山多地少的地理特征突出,人地关系紧张(图1c)。盲目的毁林开荒、大量坡耕地开垦、乱砍滥伐、过度樵采等人类活动强烈,在这种情况下,石漠化极易发生。
文山市是喀斯特地貌发育典型、生态环境脆弱、石漠化现象严重、人地矛盾突出、社会经济发展滞后的典型喀斯特山区。因此本文选择文山市为案例研究区,能够真实反映喀斯特山区的自然环境和社会经济基本情况,具有很好的代表性和典型性。
2.2 数据来源与处理
研究数据集主要包含卫星影像数据集、土地利用/覆被数据集、气象数据集及其他相关辅助数据集。所有空间数据均统一转换为WGS_1984_UTM_48N坐标系,具体数据信息见表1。
表1 数据来源及说明
Tab. 1
| 数据类型 | 数据源 | 数据说明 |
|---|---|---|
| Landsat-5影像 | 美国地质勘探局( | TIF (30 m) |
| Sentinel-2影像 | 欧洲航天局( | TIF (10 m) |
| NDVI | 美国国家航空航天局( | TIF (250 m) |
| DEM | 地理空间数据云( | TIF (30 m) |
| 土地利用/覆被数据 | 遥感影像 | Shp |
| 土壤数据 | 文山市自然资源局 | Shp |
| 中国土壤数据集(v1.1) ( | TIF (1000 m) | |
| 气象数据 | 文山市气象局 | 2000—2017年 |
| 统计年鉴、旅游数据 | 文山市统计局、旅游局 | |
| 基础地理信息数据 | 国家地理信息中心( |
2.2.1 土地利用/覆被数据集 2000年和2010年旱季的Landsat-5遥感影像来源于美国地质勘探局,2017年旱季的Sentinel-2遥感影像来源于欧洲航天局,所有影像的云量均控制在5%以内,并通过辐射校正、几何校正、图像增强、镶嵌裁剪等预处理,采用人机交互解译获取文山市2000年、2010年和2017年的土地利用/覆被数据。同时,采集了203个野外验证点对解译结果进一步修正,形成各年份土地利用/覆被数据(图2),总体解译精度达到88.18%,能够满足本文研究需要。
图2
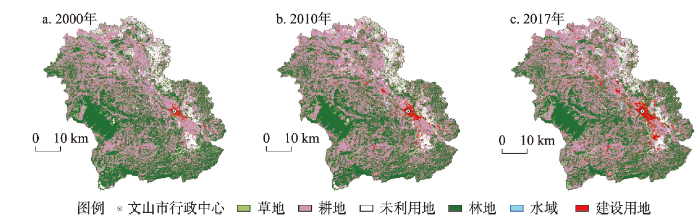
图2
2000—2017年文山市土地利用类型分布
Fig. 2
Distribution of land use types in Wenshan city from 2000 to 2017
2.2.2 卫星影像数据集 除用于土地利用遥感解译的Landsat和Sentinel卫星影像数据外,2000—2017年MODIS 13Q1产品(时间分辨率为16 d,空间分辨率为250 m)来源于美国国家航空航天局。通过MRT(MODIS Reprojection Tools)软件对NDVI数据进行投影批处理,采用国际通用的最大合成法(Maximum Value Composites)[47]形成各年份NDVI数据集。
2.2.3 气象数据集 气象数据主要包括月平均气温、月降水量、日照时数和太阳总辐射量。通过空间插值构建区域气象数据集,分辨率为30 m×30 m。
2.2.4 相关辅助数据集 其他相关辅助数据主要包括道路、河流和区县行政区域界线等数据。
2.3 研究方法
2.3.1 生态系统服务估算 根据MA[5]提出的生态系统服务分类方法,立足于喀斯特山区生态环境脆弱、基岩裸露、土层较薄和蓄水能力差等区域实际,参考前人相关研究[44-45, 48-49],选取了食物供给(FP)、产水量(WY)、植被净初级生产力(NPP)、土壤保持(SC)、生境质量(QH)和旅游文化(TC)6项生态系统服务,采用InVEST、CASA和RUSLE模型对此进行评估。其中食物供给与产水量代表供给服务,喀斯特山区面临耕地面积减少、质量下降等问题,近年来中国西南喀斯特山区干旱发生频率较高,对农作物生产影响较大,因此评估食物供给与产水量对地区粮食安全有重要意义;NPP与固碳释氧关系密切,在支持服务中它是区域物质与能量循环的基本来源,对调节服务中的区域气候调节也有重要贡献;喀斯特山区水土流失严重,面临石漠化、生物多样性退化等多种生态问题,故选取土壤保持和生境质量作为支持服务的研究对象;同时,喀斯特山区具有陡峰、峡谷、溶洞和瀑布等各种奇特自然景观,也是少数民族聚集区,民俗文化丰富多彩,因此选取旅游文化来表征区域的文化服务。
(1)食物供给
式中:ck为区域k内单位面积食物供给能量的平均值(kJ/km2);Pmk是指区域k内m作物的单位面积产量(t/km2);Am为m作物的能量(kJ/t);cki是区域k内像元i的单位面积食物供给能量(kJ/km2);NDVIki为区域k内像元i的NDVI值;NDVIk,mean为区域k内耕地NDVI的平均值。
(2)产水量
产水量服务采用水量平衡原理进行估算,借助InVEST模型进行计算:
式中:Yxj是j类土地利用类型x像元上的年产水量(mm);AETxj是j类土地利用类型x像元上的年实际蒸散量(mm);Px是x像元上的年降雨量(mm)。
(3)植被净初级生产力
植被净初级生产力(Net Primary Production, NPP)的计算采用CASA模型[53]:
式中:APAR(x, t)表示像元x在第t月的光合有效辐射(MJ/m2);ε(x, t)表示第t个月像元x的实际光能利用率(gC/MJ)。
(4)土壤保持
土壤保持量采用通用土壤流失方程(RUSLE)计算[54]:
式中:R为降雨侵蚀力因子;K为土壤侵蚀力因子;LS为坡度坡长因子;C为植被覆盖管理因子;P为土壤保持措施因子,P值的选取参考曾凌云[55]在喀斯特地区的研究。
(5)生境质量
(6)旅游文化
Eade等[60]指出,在一定范围内某些特定像元的旅游服务价值要比其他像元高,而影响某一像元旅游文化服务的因素主要有两方面:景点可达性(距离)和景点可见度。旅游文化服务随着距景点的距离增大而减少,随着景点的可见性增加而升高。假定景点可达性与景点可见度所影响的旅游收入一致,通过ArcGIS软件进行缓冲区和可视性分析,计算得到各像元的旅游文化服务价值。公式如下:
式中:Vt表示像元t处的旅游文化服务价值;Vt(a)表示像元t处景点可达性影响的旅游文化服务;Vt(b)表示像元t处景点可见性影响的旅游文化服务;Pi表示景点i在像元t处缓冲区的旅游收入平均值;Ci表示景点i在所有可见像元的旅游收入平均值;n为像元t处可见景点数量。
表2 生态系统服务冷热点分区
Tab. 2
| Z(Gi*)取值范围 | ≥ 2.58 | [1.96, 2.58) | [1.65, 1.96) | (-1.65, 1.65) | (-1.96, -1.65] | (-2.58, -1.96] | ≤ -2.58 |
|---|---|---|---|---|---|---|---|
| 分区 | 极显著热点 | 显著热点 | 热点 | 不显著区 | 冷点 | 显著冷点 | 极显著冷点 |
3 结果与分析
3.1 喀斯特山区文山市生态系统服务时间变化特征
由表3可知,2000—2017年间,生境质量服务整体呈下降趋势,波动较小。生境质量与地类自身的生境适宜性以及周边人类活动扰动关系密切。文山市建设用地的持续扩张和耕地面积的大幅增加(图2),人类活动强度加大,景观破碎化,使得研究区生境质量降低;食物供给服务在2000—2010年间增长较快,2010—2017年间增长较慢,与文山市耕地作物从传统的粮食作物转向特色经济作物这种农业生产结构调整有关,说明居民生活质量不断改善,对食物要求更加多元化;产水服务呈先减后增趋势,其中2010—2017年变化幅度较大。产水量的年际差异主要受气温和降雨量的影响,2000—2010年文山市降雨量小幅下降,气温升高增加了植被的潜在蒸发,产水量降低,2010—2017年降雨量较往常年份显著升高,且气温降低减少了植被的潜在蒸发,使得区域整体产水量显著增加(图3);NPP呈先增后减,整体波动上升的趋势。气温的升高可以通过代谢增强光合作用以及提高营养物的分解来增加NPP服务量,反之亦然[64],降水的增加会改善土壤水分对植被的供给,有利于光合速率增强,从而提高NPP[65]。2000—2017年文山市降水量呈增加趋势,NPP服务量整体呈上升趋势,前10年文山市气温显著升高,NPP服务量增加,后7年间气温下降,NPP服务量减少(图3);土壤保持服务呈持续增长趋势。土壤保持服务量的变化与各土壤侵蚀因子密切相关[66],降雨是引起土壤侵蚀的主要驱动力之一,降雨量的多少直接影响降雨侵蚀力因子(即RUSLE的R因子)的大小[67],通常降雨量越多,R越大。2000—2017年文山市年均降雨量呈上升趋势(图3),降雨侵蚀力增强,潜在土壤侵蚀量增加,加之植被覆盖度较高的林地和草地面积减少,进一步增强了土壤侵蚀,多个因子综合作用导致17a间文山市土壤保持服务量显著增加;旅游文化服务持续增长且增长幅度较大,2017年年均值达0.080。总之,2000—2017年文山市除生境质量服务年均值下降外,其他生态系统服务年均值均呈上升趋势。
表3 2000—2017文山市6项生态系统服务年均值
Tab. 3
| 服务类型 | 2000年 | 2010年 | 2017年 | 2000—2017年变化量 |
|---|---|---|---|---|
| 食物供给(MkJ/km2) | 1593.124 | 2010.858 | 2061.138 | 468.014 |
| 产水量(mm) | 397.970 | 349.961 | 681.177 | 283.207 |
| NPP(gC/(m2 a)) | 874.210 | 963.202 | 922.829 | 48.619 |
| 土壤保持(t/(hm2 a)) | 429.009 | 473.157 | 848.706 | 419.697 |
| 生境质量(-) | 0.588 | 0.566 | 0.561 | -0.027 |
| 旅游文化(元/m2) | 0.002 | 0.024 | 0.080 | 0.078 |
图3
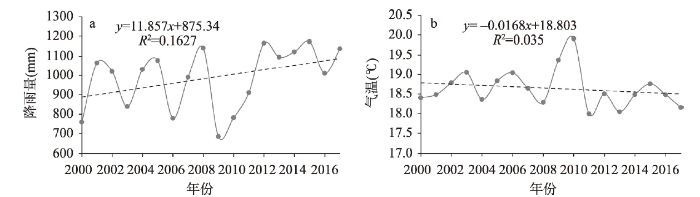
图3
2000—2017年文山市降雨量和气温变化
Fig. 3
Rainfall and temperature changes in Wenshan city from 2000 to 2017
3.2 喀斯特山区文山市生态系统服务空间格局变化特征
3.2.1 生态系统服务空间分布格局 2000—2017年,食物供给服务的高值区主要位于文山市北部、中部和东南部的平坝和河谷地区,该区域坡度较小,交通可达性高,水土资源条件良好,适宜农业生产,是耕地的主要分布区,而低值区多集中于西部和西南部的林地分布区,以及东北部和中东部未利用地成片分布区(图4a~4d)。
图4
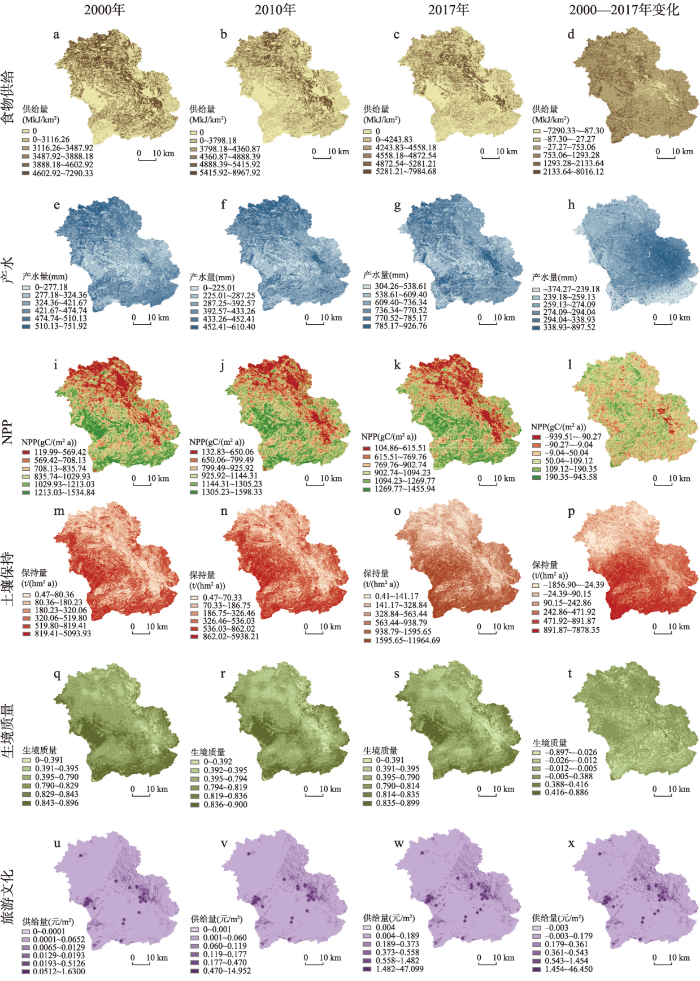
图4
2000—2017年文山市生态系统服务时空分布及变化
Fig. 4
Spatio-temporal distribution and changes of ecosystem services in Wenshan city from 2000 to 2017
产水服务高值区分布较为零散,北部、南部及中部均有分布,2010年和2017年高值区主要集中于中部偏东的河谷地区,而低值区在中部和中西部连片集中分布(图4e~4h)。产水量的高低与土地利用类型关系密切。中部偏东的河谷地区是产水量升高最为明显的地区,该地区也是文山市主城区所在地,即建设用地聚集区,在城区建设用地持续扩张的情况下,其他用地类型向建设用地大量转移,不透水面的增加使得该地区产水服务的增加趋势十分明显。
NPP高值区集中于文山市西部及南部,该区域林地面积广大,植被覆盖度较高,而低值区主要集中于北部平坝、中部河谷和东北部未利用地广泛分布的地区(图4i~4l),这些地区因其他地类转为建设用地,林地转向其他地类等原因导致植被覆盖度下降。
生境质量服务高值区主要分布于文山市北部、西部及东部,该区域林地分布面积广,生境适宜性较高,生境受到较少威胁,而低值区在中部、南部以及北部平坝区分布较为集中(图4q~4t),该区域植被覆盖度较低,说明生境质量服务的分布与植被覆盖度密切相关。
旅游文化服务的空间分布与文山市风景区的分布保持一致,高值区在研究区西部和中部城区景点附近呈点状密集分布,其他无景点区域旅游文化服务明显较低(图4u~4x)。
2000—2017年文山市6项生态系统服务高值区集中分布在西部和南部,零散分布于北部和中部,6项生态系统服务低值区集中分布在北部(包括东北部和西北部)和中部(包括中东部和中西部),少量分布于南部(包括东南部和西南部)。研究期内文山市生态系统服务具有明显的空间分异特征,主要与不同的土地利用类型、生态环境状况好坏、人类活动强弱、基础设施的建设和旅游资源是否丰富等原因密切相关。
3.2.2 生态系统服务空间热点分析
(1)单项生态系统服务冷热点空间分布
根据2000—2017年6项生态系统服务的年均值数据,利用Gi*热点分析工具,绘制得到文山市各项生态系统服务冷热点空间分布图(图5)。
图5
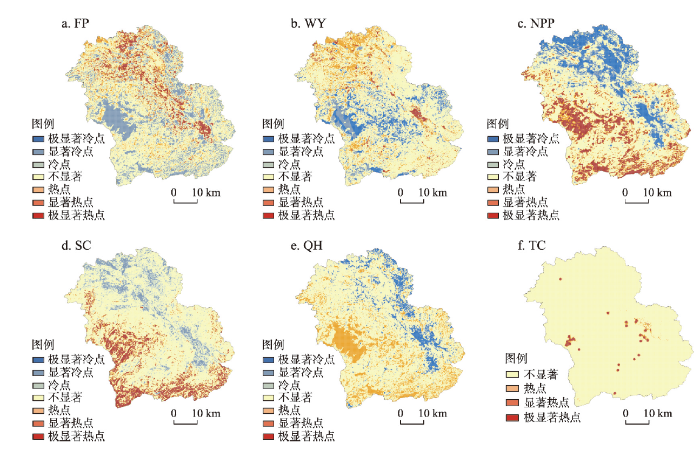
图5
文山市各项生态系统服务冷热点分布
Fig. 5
Distribution of cold and hot spots of ecosystem services in Wenshan city
由表4可知,FP与WY两者的冷热点区域在空间分布上较为相似,热点区域主要分布于北部、中部及南部地区,冷点区域主要分布于西南部和东部,但在局部地区有一定差异,如南部食物供给热点区主要分布在南部偏东,而南部产水量热点区主要分布在南部偏西;NPP、SC和QH的冷热点区域在空间分布上基本一致,热点区主要集中于西部和南部,冷点区则广泛分布于北部、中部偏东和东南部;TC因其数据本身特殊性,在空间上只有热点区与不显著区,无冷点区分布,热点区集中分布于西部风景区及中部城区景点周围,零星分布于南部地区。热点区面积占比排序为:NPP > QH > WY > FP > SC > TC,表明NPP和QH服务在空间上高值区聚集效应较为明显;冷点区面积占比排序为:SC > NPP > FP > QH > WY,表明SC和NPP服务在空间上低值区聚集效应较为显著(表4)。
表4 文山市各项生态系统服务冷热点空间分布范围及面积占比(%)
Tab. 4
| 服务类型 | 热点区(热点、显著热点和极显著热点) | 冷点区(冷点、显著冷点和极显著冷点) | |||
|---|---|---|---|---|---|
| 空间分布 | 占比(%) | 空间分布 | 占比(%) | ||
| 食物供给(FP) | 北部、中部、东南部 | 23.74 | 西部、南部、东北部 | 27.54 | |
| 产水量(WY) | 北部、中部偏东、西部偏南 | 24.19 | 西部、西南部、东部、中部 | 22.11 | |
| NPP | 西部、南部、中部 | 30.86 | 北部、中部偏东、东南部 | 30.5 | |
| 土壤保持(SC) | 西部、南部 | 21.99 | 北部、中部偏东、东南部 | 31.56 | |
| 生境质量(QH) | 西部、南部、东部 | 26.97 | 东北部、中部偏东、东南部 | 22.51 | |
| 旅游文化(TC) | 西部、中部偏东、南部 | 2.56 | 无冷点分布 | 0 | |
6项生态系统服务的冷热点区域空间分布有所差异,但整体上具有重叠性。除旅游文化服务的热点区和冷点区面积仅占2.56%和0%外,其他5项生态系统服务的冷热点区域面积分布占比较为接近,均在21%~32%。
(2)生态系统服务综合热点区识别
根据以上分析,各项生态系统服务的冷热点分布区域在空间上具有重叠性,即某一区域同时是多项生态系统服务的热点区。为进一步分析研究区内各空间单元生态系统服务综合供给能力的大小,对6项生态系统服务的热点区进行叠加分析。结果表明,文山市同一空间单元内热点区重合的生态系统服务最多有4项,最少有0项(图6)。其中热点数量为2的综合生态系统服务热点区分布面积最大,占全市总面积的30.14%,主要服务类型为食物供给服务和产水服务,该区域分布广泛,集中在北部及中部城区范围;其次是无法提供综合生态系统服务(即热点数量为0)的区域占全市总面积的29.42%,主要分布在东部和南部,与未利用地的空间分布较为相似;只有1项生态系统服务呈高值的区域占总面积的25.94%,主要服务类型是产水服务,集中于文山市北部及中部,与热点重合数为2的区域交错分布;热点重合数量为3的区域较少,占总面积的13.92%,该区域主要服务类型是NPP、土壤保持和生境质量服务,连片分布于西部及南部,以林地为主;4项及以上高值生态系统服务重合的地区面积最少,仅占总面积的0.58%,其主要服务类型是NPP、土壤保持、生境质量和旅游文化服务,分布于文山市西部和西南部林地的核心区域。总之,文山市能够同时提供多项高值生态系统服务功能的区域较少,85.5%的区域只能提供两项及以下高值生态系统服务功能。
图6
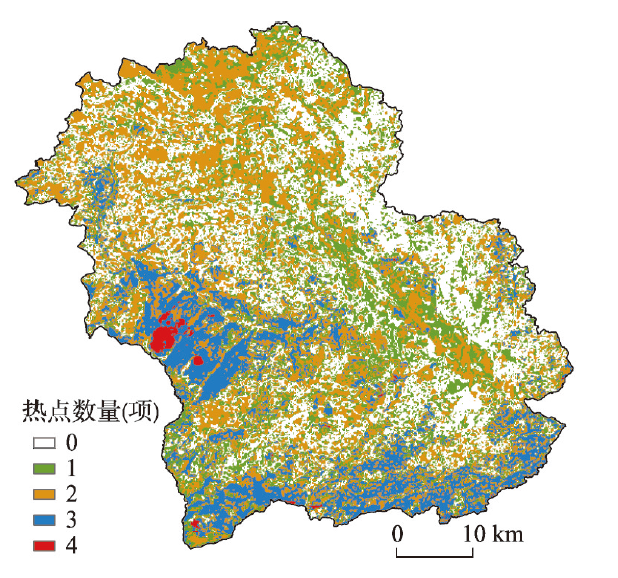
图6
文山市多重生态系统服务热点空间分布
Fig. 6
Spatial distribution of multiple ecosystem service hotspots in Wenshan city
3.3 喀斯特山区文山市生态系统服务功能分区
图7

图7
文山市生态系统服务簇分类结果
Fig. 7
Classification results of ecosystem service clusters in Wenshan city
3.3.2 生态系统服务功能分区及管控建议
(1)生态系统服务功能分区
服务簇1中土壤保持(1.4433)、NPP(1.0309)和生境质量(0.9542)均为最高值(图7b),这些服务对于喀斯特山区生态系统保护与修复十分重要。从空间分布来看(图2、图8),该区域主要集中于西部林地与南部丘陵地带,如区域内植被遭受破坏,会对生态系统造成难以逆转的损害,故将服务簇1划分为生态保护区;服务簇2中除旅游文化和产水服务外,其它生态系统服务均处于区域平均水平以上(图7b),且空间分布上为服务簇1至服务簇3的过渡地带(图8),故将服务簇2划分为生态过渡区;服务簇3中食物供给服务最高(0.9997),产水服务也较好(0.5159)(图7b),且空间位于文山市粮食生产的主要集中区域,多为平坝、河谷地形地貌(图2、图8),是确保全市粮食安全的重要区域,故将其划分为农业主产区;服务簇4中旅游文化服务最突出(1.9834),其次为产水量(1.9436),均为4个服务簇中的最高值,但其他4项生态系统服务均为全区最低值(图7b),难以发挥生态保护与粮食生产安全功能,且在空间分布上主要集中分布于文山市城区范围(图2),适宜生产生活,故将其划分为人类生产生活区。
图8
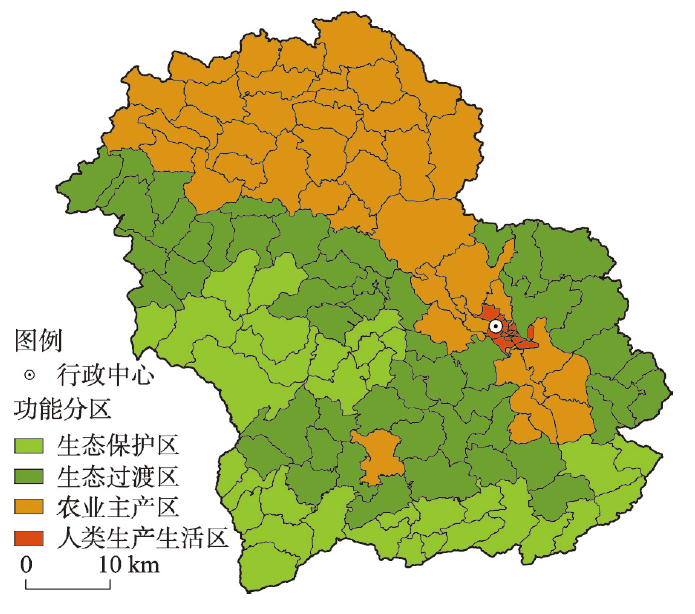
依据同一生态系统服务簇在地理空间上具有集聚效应的性质,按照文山市4个生态系统服务簇的具体特征和主导生态系统服务功能划定区域生态系统服务功能区:生态保护区、生态过渡区、农业主产区和人类生产生活区(图8)。
(2)生态系统服务功能分区管控建议
生态保护区包含33个行政村,占文山市行政村总数的23.74%,集中分布于西部和南部。其中西部片区是文山市境内海拔最高的区域,以山地地形为主,也是土壤侵蚀的潜在高发区,区内林地面积占比较大、完整性好,对维持生物多样性具有重要意义;南部片区林地则十分破碎,人类活动较为频繁(图2、图8)。该功能区的管理目标以土壤保持、调节气候和维持区域生物多样性为主。其中,西部的生态保护片区与老君山国家自然保护区空间分布一致,受人类活动干扰较小但敏感度高,一旦受到破坏,生态系统服务将遭受损失且恢复困难。因此西部片区应严格限制农业生产或基础设施建设活动,减少对自然植被的破坏,积极实施退耕还林等政策和老君山生态移民工程,加强自然保护区的建设与管理,完善生态补偿机制,转变粗放型农业生产方式,提高土壤保持、NPP和生境质量等生态系统服务能力;南部的生态保护片区受人为干扰较强,应着力提升当地居民的林地保护意识,注重生态廊道构建,提升林地斑块的完整性和连接度,保障区域内生物物种的扩散和交流,维持区域生态安全。
生态过渡区规模最大,包含50个行政村,占文山市行政村总数的35.97%,主要集中于中南部和中北部片区,少数分布在东部片区。区域内海拔较生态保护区低,人类对自然生态系统的干扰增强,形成了耕地、林地交错分布的土地利用格局。作为生态扩张与城镇建设用地扩张的交界地带,区域内生态保护、农业生产和城镇建设矛盾较为突出(图2、图8)。该功能区应以维持生态系统服务稳定为前提,适当提升耕地生产能力为管理目标。在城镇扩张过程中,要以保护生态用地完整性为前提,合理控制新增建设空间,促进建设用地的组团布局;在生产活动中应注重水土保持,结合退耕还林和石漠化综合治理等重点生态工程建设,发展以核桃、油茶、八角、漆树、红豆杉等为重点的特色经济林,合理发展林下草果和中药材种植;根据区域农林结合的特点,自然景观与乡村田园交错的天然优势,因地制宜发展乡村观光农业,研发具有文山特色的农业产品,提高区域农民经济收入。
农业主产区包含43个行政村,占文山市行政村总数的30.94%,主要分布于北部和中东部平坝、河谷地区,从西北至东南呈带状分布(图2、图8)。农业主产区是关系研究区粮食安全的重要区域,区域内地形平坦,土壤肥力高、灌溉设施较完善,耕作条件较好。基本农田保护、保障区域粮食生产安全是农业主产区的生态系统主要管理目标。该功能区应积极推进高标准基本农田建设,全面提升农业基础设施,保证稳定的种植面积,促进粮食增产增收;严格控制建设占用,加强耕地占补平衡管理,建立耕地保护经济补偿机制,增强农民耕地保护意识;实施农田改造提质,提升耕地生产能力和生产效率;优化农业产业结构,生产具有地区特色的农业产品,挖掘喀斯特山区的地域及民族文化内涵,推动农业有序、高效发展。
人类生产生活区包含13个行政村,在各功能区中规模最小,仅占文山市行政村总数的9.35%,集中分布于中部河谷地区,即中心城区及周边区域(图2、图8)。该区是文山市人口密集区,也是经济活动、开发建设突出地区。区内应以打造宜人景观设施,加强污染防治,改善人居环境等为管理目标。应注重土地集约利用,推行节地型和紧凑型城区建设,完善城乡公共基础设施,营造舒畅、宜人的公共开放空间;加强污染治理,实施盘龙河沿岸截污体系建设,保障流域水资源安全;推进城市生态绿化体系建设,打造城市生态绿色景观带,为区域生物流动提供支持;适当扩大绿地公园建设,打造园林城市,构建以城郊游憩带、城市公园、市民广场为主的城市休闲体系,提升游客满意度,增强其与周边旅游景区的通达度。
4 讨论
4.1 喀斯特山区生态系统服务评估结果验证
根据以上模型,2000年、2010年和2017年研究区产水量年均值分别为397.97 mm、349.96 mm和681.18 mm,Wang等[70]采用InVEST模型计算了中国西南喀斯特地区的产水量,从其空间分布图中可知,文山市2000年和2015年产水量年均值一般低于600 mm,大致位于300~600 mm之间,与本文的产水量评估结果基本一致。
2000年、2010年和2017年研究区生境质量年均值分别为0.58800、0.56622和0.56052,黄国金[74]采用InVEST模型对2000—2017年贵州乌江喀斯特流域生态系统服务进行评估,结果表明2000年、2010年和2017年研究区生境质量年均值分别为0.609、0.613和0.614,与本文所获得的生境质量指数结果相差不大。
综上,采用InVEST、RUSLE和CASA模型评估的文山市产水量、NPP、土壤保持和生境质量数据结果与同在中国西南喀斯特地区的模型模拟结果基本一致,均属同一数值范围内,说明本文采用各模型对滇东南喀斯特山区文山市的生态系统服务物质量模拟结果具有较高的可信度,能反映研究区生态系统服务变化的实际情况。而数值上存在的差异可能与所选研究区域的时空尺度、模型参数的设置等因素相关。但是本文还存在不足之处,例如,估算的喀斯特山区文化服务价值仅从旅游景点维度去考虑文化服务功能,未对美学、游憩等文化服务功能开展全面和精确的评估;此外,模型参数主要参考相似地区的前人研究成果,在未来研究中将通过野外数据采集与观测,对生态系统服务估算所采用的模型参数进行本土化调整,提高模型评估结果的精度。
4.2 喀斯特山区生态系统服务空间热点分析讨论
目前国内外对生态系统服务空间格局的研究日趋增多,亦日趋成熟。但采用空间统计方法分析生态系统服务时空分布规律的研究尚显不足[75]。研究除了采用InVEST、CASA和RUSLE模型对生态系统服务进行空间制图外,还应用空间统计方法分析各项生态系统服务的冷热点空间分布特征,进行综合热点区的识别。将综合热点区数量分布图与文山市土地利用现状图和石漠化发生区域图进行空间叠加分析(图9),发现综合热点区空间分布格局与林地和石漠化程度有很大的一致性,说明土地利用类型、石漠化程度是影响文山市生态系统服务综合供给能力的重要原因。如图9a所示,西部和南部林地主要集中区也是生态系统服务综合热点区数量为3、4的主要分布区,能够同时提供3-4项高值生态系统服务的区域与西部和南部的林地核心区高度重合,说明土地利用类型是影响区域生态系统服务功能的重要因素之一;由图9b所示,整体来看,石漠化发生区主要集中在文山市西北部、东北、东部和东南部(图1),这些地区也是生态系统服务综合热点区数量为0的主要分布地,热点数量为0的区域与石漠化发生区高度重合,说明石漠化程度与综合热点区空间分布具有一致性,在一定程度上影响区域生态系统服务的综合供给能力。
图9
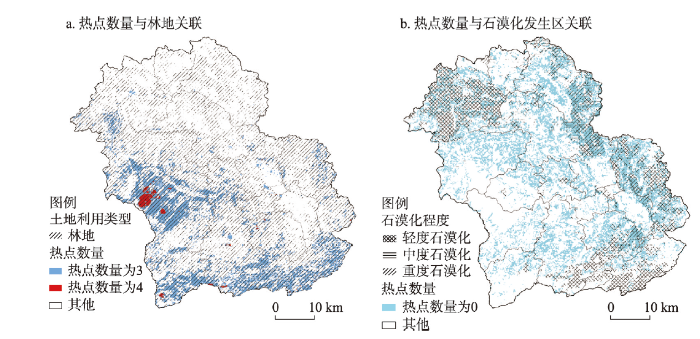
图9
生态系统服务综合热点区数量与文山市土地利用现状、石漠化程度关联图
Fig. 9
The correlation between the number of integrated hotspots of ecosystem services and the status of land use and the degree of rocky desertification in Wenshan city
4.3 喀斯特山区生态系统服务功能分区讨论
21世纪以来,中国经济快速发展,资源开发与生态环境保护之间的矛盾日益加剧,为缓解这些问题,政府部门和学者们开展了一系列的生态功能区划研究工作[77]。传统的生态功能分区多采用定性与定量相结合的方式,重点考虑各地理环境要素及其空间组合的相似性或相异性程度,在此基础上进行特征区划或自然区划,但对区域生态系统的完整性考虑不足。本文中的生态系统服务功能分区则是从生态系统服务功能自身规律出发,综合考虑供给、支持、调节及文化等各项服务功能,采用定量化的方式在栅格单元上形成的功能分区。该分区可多角度揭示生态系统的空间差异性,确定各分区的主导服务功能,明晰不同区域的生态保护区域和方向,对实现区域土地资源精细化管理具有重要意义。并且已有研究表明有效的功能分区能使各项生态系统服务功能效益的最优化[78]。
喀斯特生态系统是全球陆地生态系统的重要组成部分,在人类福祉和生计中发挥着至关重要的作用。但目前基于生态系统服务评估结果,对喀斯特地区进行生态系统服务功能分区的研究却较少[36]。因此,本文以滇东南典型喀斯特山区文山市为例,运用K-means聚类方法识别生态系统服务簇,进行生态系统服务功能分区研究,将研究区划分为生态保护区、生态过渡区、农业主产区和人类生产生活区,并针对各分区提出了空间上差异化、精细化生态管控建议。其研究方法和成果有利于促进喀斯特地区土地资源的合理配置,实现喀斯特区域的生态恢复治理和区域可持续发展,同时为国土空间开发格局优化及“三生空间”的划定等提供基础数据和一定的理论参考。
5 结论
本文以滇东南喀斯特山区典型区域文山市为例,综合运用InVEST、CASA、RUSLE模型和热点分析法定量评估了2000—2017年6项生态系统服务的时空格局特征,运用K-means聚类法识别了生态系统服务簇,明确了各服务簇的主导服务类型,划定了喀斯特山区生态系统服务功能区,提出了差异化的喀斯特生态系统管控建议。主要结论有:
(1)2000—2017年除生境质量服务下降外,文山市其他5项生态系统服务年均值均有提升。
(2)2000—2017年文山市6项生态系统服务高值区集中分布在西部和南部,少量分布于北部和中部,低值区集中分布在北部和中部,少量分布于南部。热点分析表明,食物供给与产水量服务两者的热点区主要分布在北部和中部,其他4项服务的热点区主要分布在西部和南部;食物供给与产水量服务两者的冷点区主要分布在西部、南部和东部,NPP、土壤保持和生境质量服务三者的冷点区则广泛零散分布于北部、中部偏东和东南部,旅游文化服务无冷点分布区域;除旅游文化服务的热点区面积仅占比2.56%,冷点区占比0外,其他5项生态系统服务的冷热点区域面积分布占比较为接近,均在21%~32%区间;能提供3项及以上高值生态系统服务的区域较少,仅占全市总面积14.50%。
(3)将文山市划分为4类生态系统服务功能区。其中,生态保护区以土壤保持、气候调节和维持生物多样性为主导;生态过渡区以维持生态系统服务稳定,提升耕地生产能力为主导;农业主产区以食物供给服务为主导;人类生产生活区以改善人居环境,打造宜人景观为主导。
参考文献
What are ecosystem services? The need for standardized environmental accounting units
DOI:10.1016/j.ecolecon.2007.01.002 URL [本文引用: 1]
Human domination of earth's ecosystems
DOI:10.1126/science.277.5325.494 URL [本文引用: 1]
Conservation and human welfare: Economic analysis of ecosystem services
DOI:10.1007/s10640-010-9415-0 URL [本文引用: 1]
Understanding relationships among multiple ecosystem services
DOI:10.1111/j.1461-0248.2009.01387.x
PMID:19845725
[本文引用: 2]

Ecosystem management that attempts to maximize the production of one ecosystem service often results in substantial declines in the provision of other ecosystem services. For this reason, recent studies have called for increased attention to development of a theoretical understanding behind the relationships among ecosystem services. Here, we review the literature on ecosystem services and propose a typology of relationships between ecosystem services based on the role of drivers and the interactions between services. We use this typology to develop three propositions to help drive ecological science towards a better understanding of the relationships among multiple ecosystem services. Research which aims to understand the relationships among multiple ecosystem services and the mechanisms behind these relationships will improve our ability to sustainably manage landscapes to provide multiple ecosystem services.
An operational framework for integrated mapping and assessment of ecosystems and their services (MAES)
Ecosystem service trade-offs and their influencing factors: A case study in the Loess Plateau of China
DOI:10.1016/j.scitotenv.2017.07.079 URL [本文引用: 1]
Impacts of changes in climate and landscape pattern on ecosystem services
DOI:10.1016/j.scitotenv.2016.11.036 URL [本文引用: 1]
Challenging the land degradation in China's Loess Plateau: Benefits, limitations, sustainability, and adaptive strategies of soil and water conservation
DOI:10.1016/j.ecoleng.2018.11.018 URL [本文引用: 1]
Global drivers and tradeoffs of three urban vegetation ecosystem services
Global estimates of the value of ecosystems and their services in monetary units
DOI:10.1016/j.ecoser.2012.07.005 URL [本文引用: 1]
Emergy and ecosystem complexity
DOI:10.1016/j.cnsns.2007.05.028 URL [本文引用: 1]
Challenges in integrating the concept of ecosystem services and values in landscape planning, management and decision making
DOI:10.1016/j.ecocom.2009.10.006 URL [本文引用: 1]
Research framework of ecosystem services geography from spatial and regional perspectives
DOI:10.11821/dlxb201411004
[本文引用: 1]
The research on ecosystem services has become a hotspot in ecology, geography and other related disciplines at home and abroad. Through reviewing the history of ecosystem service study, it can be found that the research has been gradually transformed from rational paradigm to regional paradigm, and from natural science paradigm to integrated paradigm between natural science and social science. It was characterized by increasing attention to spatiotemporal heterogeneity, spatial flow ability and regional features, and links between ecosystem services and human welfare. Almost all the subdisciplines of geography can find their own research themes in the cascade framework of ecosystem structure and function-service-human benefits and welfare. Due to more participation in the study area of ecosystem services, the geography of ecosystem services which is being constructed as a new branch of geography, not only plays a more important role in the research of ecosystem services, but also can extend the study scope of geography. Based on reviewing the historical process and development trend of the ecosystem service research, the logical necessity, opportunities and challenges of geography in ecosystem services research were analyzed in this paper. To promote the transform of ecosystem service research into geographical context, we proposed that the geography of ecosystem service should be established and well defined as an independent branch of geography. Moreover, a preliminary framework of geography of ecosystem service was described, including the definition, research scope and contents, and the subject position in geography.
基于空间与区域视角的生态系统服务地理学框架
Rock-weathering-related carbon sinks and associated ecosystem service functions in the Karst critical zone in China
DOI:10.11821/dlxb201611005
[本文引用: 1]
The global karst area is about 2.2×10⁷ km2, wherein China reaches up to 3.44×10⁶ km2, occupying more than one third of the global karst area. The previous studies have showed that carbon (C) sequestration rate by chemical weathering in Chinese karst zone range from 5 Tg C yr-1 to 18 Tg C yr-1, which are considered as one of important "residual land sink" in global change research. In order to accurately estimate the C sequestration rate in karst area, we put forward the concept of Earth Critical Zone (CZ) for karst ecological system. In this study, we comprehensively understand the C cycle in karst CZ, introduce the estimation of the methods on karst CZ, and then re-evaluate the C sequestration rate in the karst CZ. At last, we systematically discuss the uncertainty of the C sinks in karst CZ. The results show that the rock-weathering-related C sink rate in Chinese karst CZ is about 4.74 Tg C yr-1. In addition, we elaborate the significance of C sequestration to ecological system service in karst CZ, strive to to strengthen the C monitor at rock-soil-water-biological-atmosphere continuum level in the future, and then use different methods to estimate and evaluate C cycle at multi-scale in karst CZ.
中国喀斯特关键带岩石风化碳汇评估及其生态服务功能
Temporal and spatial changes in ecosystem service values in the northern Sanjiang plain
三江平原北部生态系统服务价值的时空演变
Ecoregions of the United States (map)
Ecological function evaluation and regionalization in Baiyangdian wetland
白洋淀湿地生态功能评价及分区
Regionalization of ecosystem services of Beijing-Tianjin-Hebei area based on SOFM neural network
DOI:10.11820/dlkxjz.2013.09.008
[本文引用: 2]
Studies showed that ecosystem services are closely related to land utilization. Human activities have been relentlessly developing and using the land, causing serious exhaustion of land resources and making ecological environment change from bad to worse, which in turn poses severe threat to the sustainable utilization of ecosystem services. For sustainable land use and human well-being promotion, it is important to integrate ecosystem service into the land use decision-making process. Creating partitions based on different ecosystem services is of great significance for land use and management of ecosystem services. Taking Beijing-Tianjin-Hebei as a case area, the study in this report assessed the ecosystem service value of each unit based on IGBP land use data from 2001 to 2009. Regionalization of ecosystem service was created by SOFM Neural Network. In order to recognize the main ecosystem services of each region, the study calculated the hot spots of ecosystem service by ArcGIS. Combined with national major function oriented zoning, the study put forward proposals for making the policies on the future land development. The results indicated that Beijing-Tianjin-Hebei Area can be divided into four regions based on ecosystem service values: Ⅰ. Bashang Plateau and northwest Hebei mountain region, Ⅱ. Yanshan and Taihang Mountains region, Ⅲ. Central and southern Hebei Plain region, and Ⅳ. Bohai Sea coastal area. The ecosystem service value of Bohai Sea coastal area continued to rise while that of the other areas decreased to different degrees: Ⅱ>Ⅰ>Ⅲ. Wind and spring floods eroded soils in region Ⅰ and the soil are quite fragile. In order to conserve water and soil, proper land-use policies should be made for region Ⅰ. The key restoration measures include improvement of rangeland management, financial incentives to elimination of overstocking, and re-vegetation with appropriate rest periods during which grazing should be banned. Most of the hot spots of biodiversity service are distributed in region Ⅱ, but the value goes down with each passing year. Therefore, policy makers should pay more attention to biodiversity conversation in this region. As part of rapid urbanization efforts, the type of ecosystem service in region Ⅲ is quite simple. Food production is the dominant service while other services are quite low especially for water conservation and soil formation. On the premise of guaranteeing food production, proper policies should be made to adjust the proportion of urban land use to increase other ecosystem service such as carbon sink and pollination services. The resources of beach soils of region Ⅳ are rich, but the utilization ratio is low because of serious soil salinization. It is urgent for decision makers to provide guidance for salinization control, such as promoting water saving agricultural techniques and reducing artificial recharge of groundwater, to limit the increase of salinity. In addition, region Ⅳ should make full use of wetland because wetland can provide many services such as water conservation. The results indicated that SOFM Neural Network has strong advantage in objectivity and clear classification and is of great importance as a supplement to ecosystem service regionalization. The dividing method of GIS and SOFM clustering can identify regional differences and similarities of ecosystem services value and works well on ecosystem services regionalization.
基于SOFM网络的京津冀地区生态系统服务分区
The objectives, tasks and characteristics of China ecological regionalization
中国生态区划的目的、任务及特点
Scheme of ecological regionalization in China
中国生态区划方案
Bundles of ecosystem (dis)services and multifunctionality across European landscapes
DOI:10.1016/j.ecolind.2016.09.026 URL [本文引用: 1]
Mapping watershed-level ecosystem service bundles in the Pearl River Delta, China
DOI:10.1016/j.ecolecon.2018.04.023 URL [本文引用: 1]
Integrating supply, flow and demand to enhance the understanding of interactions among multiple ecosystem services
DOI:10.1016/j.scitotenv.2018.09.235
[本文引用: 1]
A comprehensive understanding of the relationships among ecosystem services (ES) is important for landscape management, decision-making and policy development, but interactions among multiple ES remain under-researched. In particular, earlier studies often did not clearly distinguish between supply, flow and demand. Furthermore, the underlying mechanisms in complex socio-ecological systems remain less examined. In this study, we therefore aimed to assess interactions among eight key ES, adopting a multistep approach. For all ES, we mapped ES supply, flow and demand at the municipality level in the Alpine Space area. We applied correlation analysis and cluster analysis in order to analyse the linkages between ES and to identify bundles of ES. We used random forest analysis to explain the distribution of the ES bundles and to identify important drivers based on socio-ecological variables (e.g. land use/cover, climate, topography and population density). Our results demonstrate that trade-offs and synergies varied greatly for supply, flow and demand. We identified five ES bundles, distinguishing hotspots of ES supply and demand. Twelve socio-ecological variables correctly predicted the membership of 81% of the municipalities to the ES bundles. Our results suggest that a limited number of socio-ecological variables can explain the majority of the distribution of ES bundles in the landscape. Considering the spatial relationships between mountain regions and their surrounding lowlands, regional and transnational governance frameworks need to connect areas of multiple ES supply to areas of ES demand, and should account for the different levels and types of ES relationships. (c) 2018 Elsevier B.V.
Ecological function zoning in Inner Mongolia Autonomous Region based on ecosystem service bundles
基于生态系统服务簇的内蒙古自治区生态功能分区
Assessment of ecosystem service importance in Cheng-Yu economic zone
成渝经济区生态系统服务功能重要性评价
RS/GIS-based integrated evaluation of the ecosystem services of the Three Gorges Reservoir area (Chongqing section)
DOI:10.5846/stxb URL [本文引用: 1]
三峡库区生态系统服务功能重要性评价
An ecological function zoning approach coupling SOFM and SVM: A case study in Ordos
耦合SOFM与SVM的生态功能分区方法: 以鄂尔多斯市为例
Ecosystem service values for 4 periods and ecological function zoning of coastal wetlands on north shore of Jiaozhou Bay
胶州湾北岸滨海地区4个时期生态系统服务价值和生态功能区划分研究
Using ecosystem service bundles to detect trade-offs and synergies across urban-rural complexes
DOI:10.1016/j.landurbplan.2014.12.006 URL [本文引用: 1]
Spatial trade-offs and synergies among ecosystem services within a global biodiversity hotspot
DOI:10.1016/j.ecolind.2017.09.007 URL [本文引用: 1]
Spatial interactions among ecosystem services in an urbanizing agricultural watershed
DOI:10.1073/pnas.1310539110 URL [本文引用: 2]
Rocky desertification in southwest China: Impacts, causes, and restoration
DOI:10.1016/j.earscirev.2014.01.005 URL [本文引用: 1]
Spatio-temporal dynamics and ecological service function assessment of slope farmland in Karst areas of Guizhou province, China
岩溶地区坡耕地时空动态变化及其生态服务功能评估
Trade-offs among ecosystem services in a typical Karst watershed, SW China
DOI:10.1016/j.scitotenv.2016.05.190 URL [本文引用: 1]
Changes in ecosystem service values in Karst areas of China
Management modes of degraded ecosystem in southwest Karst area of China
西南喀斯特地区退化生态系统整治模式
How does smallholder farming practice and environmental awareness vary across village communities in the Karst terrain of southwest China?
Effect of land use transformation process on ecosystem service value in Karst trough valley area
喀斯特槽谷区土地利用转型过程对生态系统服务价值的影响
Features of karst ecosystem and integrating measure for rock desertification in Southwest China
中国西南岩溶生态系统特征与石漠化综合治理对策
Understanding the relationships between ecosystem services and associated social-ecological drivers in a karst region: A case study of Guizhou province, China
DOI:10.1177/0309133320933525 URL [本文引用: 1]
Characteristics of maximum-value composite images from temporal AVHRR data
DOI:10.1080/01431168608948945 URL [本文引用: 1]
Multi-scale representation of trade-offs and synergistic relationship among ecosystem services in Qinling-Daba mountains
基于多尺度秦巴山区生态系统服务权衡协同关系的表达
Bundling ecosystem services in Denmark: Trade-offs and synergies in a cultural landscape
DOI:10.1016/j.landurbplan.2014.02.007 URL [本文引用: 1]
Eco-environmental fragility in Guizhou Karst mountain region and its ecological rehabilitation
贵州喀斯特山区生态环境脆弱性及其生态整治
Spatio-temporal LUCC and driving force in Fuxian lake watershed from 1974 to 2014
1974—2014年抚仙湖流域土地利用/覆盖时空变化与驱动力分析
Multifunctional landscapes identification and associated development zoning in mountainous area
DOI:10.1016/j.scitotenv.2019.01.023 URL [本文引用: 2]
Global net primary production: Combining ecology and remote sensing
DOI:10.1016/0034-4257(94)00066-V URL [本文引用: 1]
Impact of land use change on the water conservation service of ecosystems in the urban agglomeration of the Golden Triangle of southern Fujian, China, in 2030
2030年闽三角城市群土地利用变化对生态系统水源涵养服务的影响
Study on soil erosion in Karst area based on RUSLE model
[D].
基于RUSLE模型的喀斯特地区土壤侵蚀研究
[D].
Temporal and spatial change of ecological services on Loess Plateau of Shaanxi by InVEST model
[D].
基于InVEST模型的陕北黄土高原生态服务功能时空变化研究
[D].
Analysis on trade-offs and synergistic relationships among multiple ecosystem services in the Shiyang river basin
石羊河流域生态系统服务权衡与协同关系研究
Land use change and its impact on habitat quality in Karst nature reserve from 1990 to 2017
1990—2017年喀斯特自然保护区土地利用变化对生境质量的影响
Ecosystem services assessment and its driving forces in the Bailongjiang watershed of Gansu
[D].
甘肃白龙江流域生态系统服务评估及影响因素
[D].
Spatial economic valuation: Benefits transfer using geographical information systems
DOI:10.1006/jema.1996.9990 URL [本文引用: 1]
The analysis of spatial association by use of distance statistics
DOI:10.1111/gean.1992.24.issue-3 URL [本文引用: 2]
The spatial pattern changes of population aging in township in Guiyang city
贵阳市人口老龄化的乡镇空间格局变化研究
Spatiotemporal patterns of the trade-off and synergy relationship among ecosystem services in Poyang lake region, China
DOI:10.13287/j.1001-9332.201903.005
PMID:30912393
[本文引用: 1]
Poyang Lake region is the largest freshwater lake impacted area in China. Quantitative analysis of trade-off and synergy in ecosystem service is of great significance for realizing regional sustainable development. Based on multi-source data of remote sensing, soil, meteorology and DEM, we quantitatively measured food supply service, soil conservation service and water yield service in Poyang Lake region from 2005 to 2015, and analyzed their spatiotemporal patterns and evolution characteristics. The spatial and temporal characteristics of trade-off and synergy between services on the scale of 1 km×1 km were analyzed by using correlation analysis, hot spot analysis and spatial mapping method. The differences of ecosystem services and their relationships in the perspective of land use were studied. The results showed that food supply service increased, soil conservation service decreased, and water yield service increased first and then decreased during the study period. In terms of spatial distribution, food supply service presented "low-high-low-high" in the northwest-southeast direction, soil conservation service was concentrated in high and low values, and water yield service was high in south and low in north. There were trade-off relationships between food supply and soil conservation, and between food supply and water yield. There was synergistic relationship between soil conservation and water yield. Moreover, the relationship between food supply and soil conservation showed a spatial pattern of synergy in northern but trade-off in southern region. There was a clear spatial trade-off between food supply and water yield, and from north to south the relationship between soil conservation and water yield existed synergy-tradeoff-synergy differentiation, like a "sandwich". Among different land use types, there was a significant synergy between cultivated land and food supply, garden land and soil conservation, water area and water yield, but trade-off relationships between construction land and three services. The relationship between food supply and soil conservation and water yield was mainly trade-off in different land use types. The relationship between soil conservation and water yield was synergy in cultivated land, garden land, grassland and construction land, but was trade-off in water and unused land. The hot spots of multiple ecosystem services in the Poyang Lake region were mainly in the eastern and sou-thern plain areas, with a decreasing trend.
鄱阳湖地区生态系统服务权衡与协同关系的时空格局
Incorporating climate change into ecosystem service assessments and decisions: A review
DOI:10.1111/gcb.2017.23.issue-1 URL [本文引用: 1]
Spatial distribution pattern of NPP of Xinjiang grassland and its response to climatic changes
新疆草地净初级生产力(NPP)空间分布格局及其对气候变化的响应
Spatial differences of the supply of multiple ecosystem services and the environmental and land use factors affecting them
DOI:10.1016/j.ecoser.2013.06.002 URL [本文引用: 1]
Spatial-temporal changes and influencing factors of ecosystem services in Shaoguan city based on improved InVEST
基于改进的InVEST模型的韶关市生态系统服务功能时空变化特征及影响因素
Quantifying ecosystem service trade-offs and synergies in northeast China based on ecosystem service bundles
基于服务簇的东北地区生态系统服务权衡与协同
Spatial and temporal variation in terrestrial net primary productivity on Chinese Loess Plateau and its influential factors
黄土高原植被净初级生产力时空变化及其影响因素
Trade-offs and synergies of ecosystem services in Karst area of China driven by Grain-for-Green Program
DOI:10.1007/s11769-020-1098-z URL [本文引用: 2]
Spatial-temporal characteristics of trade-off and synergy of ecosystem services in key vulnerable ecological areas in China
重点脆弱生态区生态系统服务权衡与协同关系时空特征
Effect of ecological engineering projects on ecosystem services in a Karst region: A case study of northwest Guangxi, China
DOI:10.1016/j.jclepro.2018.02.102 URL [本文引用: 1]
Temporal and spatial variation of main ecosystem services in Guizhou and Guangxi Karst mountainous region
黔桂喀斯特山地主要生态系统服务时空变化
Evaluation of ecosystem services in Karst basin based on InVEST model
[D].
基于InVEST模型喀斯特流域生态系统服务功能评估
[D].
Spatial-temporal evolvement of ecosystem service value of Dongting lake area influenced by changes of land use
DOI:10.13287/j.1001-9332.201612.031
PMID:29704335
[本文引用: 1]
With the technology of geographic information system (GIS), the ecosystem service va-lue (ESV) coefficient of different types of land use in Dongting Lake area was estimated in this paper by interpreting the remote-sensing image for years and combining its economic development statistics. Meanwhile, the temporal-spatial evolvement characteristics of the ESV were investigated by employing the methods of spatial statistics analysis such as spatial autocorrelation, highland clustering analysis and hotspot analysis. The results showed that the ESV of Dongting Lake area increased slightly during 2000-2013, from 3868.39 billion yuan to 3886.62 billion yuan due to the increase of wetland in the area. The areas with high ESV and low ESV were infiltrated into each other, while the areas with second high ESV embraced those areas with high and low ESV. The characteristics of ESV and its dynamic evolvement in Dongting Lake area were obviously of spatial autocorrelation and high and low value clustering, but the trend was weakened. The focus of ESV hotspot of Dongting Lake area moved to northwest slightly with a "S" track in a obviously phased manner of "quick-slow-quick".
土地利用变化影响下洞庭湖地区生态系统服务价值的时空演变
Spatial pattern of the ecosystem service function of forests in Jinan city
济南市森林生态系统服务功能空间格局研究
Ecological function zoning of the Capital Eco-sphere
首都生态圈生态功能分区与评价
