

1 引言
气候变化及其影响已经成为当今世界面临的最为严重的环境问题之一,CO2作为重要的温室气体,与全球气候变暖息息相关[1,2]。应对全球气候变化和推动全球碳减排,成为国际共识,截止目前,全球已有超过130个国家和地区提出了“碳中和”目标或愿景。为了实现《巴黎协定》中确定的将全球温度上升限制在2 ℃或可能1.5 ℃的目标,中国承诺CO2排放力争于2030年前实现碳达峰,2060年前实现碳中和。“十四五”时期,中国生态文明建设将进入以降碳为重点战略方向、推动减污降碳协同增效、促进经济社会发展全面绿色转型的关键时期。在“双碳”目标下,不仅要实现中国碳排放的总量控制,同时也要实现区域间碳减排的协同性与公平性。碳收支是全球气候变化研究的焦点之一,也是绿色低碳发展的重要内容[3,4,5]。学者们围绕碳收支核算[6,7]、时空分异[8,9]、碳收支与产业结构[10]、经济增长[11]、土地利用结构[12]的关系及碳收支的影响因素[13,14,15]等进行了大量研究。同时,区域间的差异性导致不同区域碳收支能力不同,碳补偿成为全球气候变化和绿色低碳发展背景下产生的新领域。现有碳补偿的研究主要从理论和实证两方面展开。在理论层面,学者们界定了区域碳补偿的内涵和本质特征,总结了碳补偿模式和碳补偿制度的基本框架[16,17],提出要基于区域间碳源/汇的差异,构建“碳源–碳汇”的平衡账户和“国家碳补偿制度”[18];在实证层面,对森林[19]、湿地[20]、农地[21]、旅游地[22]等领域的碳排放配额分配机制[23]、区域碳补偿分区[7, 9, 24]和碳补偿意愿[25]等进行了大量研究。
城市群作为人口和经济活动高度集聚的地区,在快速工业化和城镇化的驱动下,将不可避免地导致环境污染和碳排放,加剧城市群地区的环境污染,这在京津冀城市群表现尤为明显[26,27]。2018年京津冀地区GDP达到8.5万亿元,占全国的9.44%。同时该地区也是中国主要的重工业基地,2018年碳排放量为10.85亿t,约占全国碳排放总量的1/9左右。以CO2排放为表征的环境污染问题已成为制约京津冀一体化高质量发展的重大阻碍[28,29]。学者们研究发现京津冀城市群CO2排放格局呈现较明显的分层聚集现象,但该地区碳固持服务供需状态呈显著的空间异质性,碳固持服务盈余地区多集中于北部,而赤字区域多集中于北京及以南地区[30,31]。这种空间格局与京津冀不同城市能源利用效率、经济增长、产业结构与能源结构[32,33,34]等密切相关。如何实现区域之间的碳公平,制定区域间科学的协同碳减排方案成为推动京津冀城市群深度协同创新发展的关键。
作为国家空间治理的重要手段,主体功能区划从地域功能理论出发,在区域发展功能差异的基础上,统筹兼顾自然生态系统和社会经济系统,将国土空间划分为优化开发区、重点开发区、限制开发区和禁止开发区四类空间,使特定功能类型区得以因地制宜的发展,构建出合理的地域发展空间格局,是国土空间规划的总蓝图[35,36]。主体功能区战略涵盖了经济发展和生态保护的双重目标,以功能区划分的形式明确区域在国土空间分工中所承担的功能,是区域经济发展和环境保护的新思路,是形成人口、经济和资源环境相协调的国土空间开发格局的重大创新,对构建和谐的人地关系地域系统具有重大意义[37]。继2011年国务院颁布实施《全国主体功能区规划》之后,京津冀分别实施了主体功能区规划,旨在促进京津冀地区资源节约与环境保护,实现京津冀可持续发展。然而,不同主体功能区国土空间开发强度、功能定位和发展方向存在明显差异,一方面可能加剧不同功能区之间社会经济发展与生态环境保护的失衡[38],另一方面造成各功能区碳源、碳汇空间的组合差异,进而影响区域碳收支的空间分异和碳补偿关系[24]。从主体功能区视角解析碳收支的时空分异和划分碳补偿分区,对于实现区域碳公平和协同碳减排具有重要现实意义,这也是地理学思想对实现“双碳”目标和低碳发展的重要贡献。
2 研究方法与数据来源
2.1 理论框架
本文从地域功能的核心思想出发,构建主体功能区视角下碳收支与碳补偿的理论框架(图1)。在分析优化开发区、重点开发区、农产品主产区和重点生态功能区四类不同主体功能区碳收支差异的基础上,从区域综合视角,结合区域的碳排放总量、碳排放经济贡献能力、碳排放生态承载能力和国土空间开发程度划分碳补偿支付区、平衡区和获补区。然后综合考虑主体功能与碳补偿分区,提出碳补偿分区方案。
图1
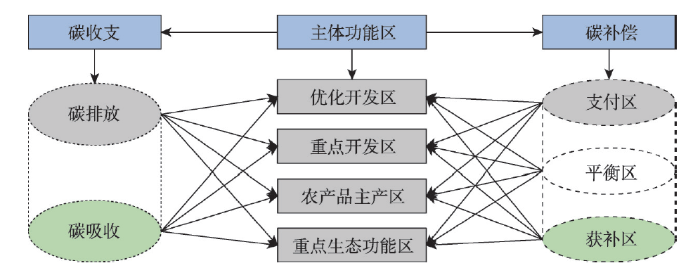
图1
基于主体功能区的碳收支和碳补偿理论框架
Fig. 1
Theoretical framework of carbon budget and carbon compensation based on major function-oriented zones
首先,地域功能的差异性是导致碳收支分异的基础。优化开发区和重点开发区两类城市化地区能够产生较强的经济效益,但其经济发展会产生大量碳排放,对生态环境造成的负外部性影响较大。而限制开发区和禁止开发区对生态环境有着较为显著的正外部性影响,其生态功能的保护必然限制区域发展,造成相关利益群体“暴损”现象。因此,需要从主体功能区的类型出发,把握4类主体功能区的碳收支时空分异,明确不同类型主体功能区在碳收支中的作用与功能。
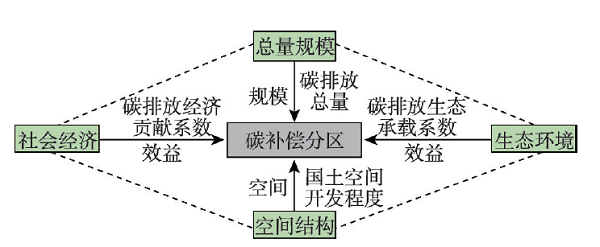
第二,碳补偿分区具有区域综合性的特征,受到区域内自然、社会经济及空间开发程度等众多要素的影响。当前已有分区主要以碳补偿率(碳吸收/碳排放)为依据[7],研究视角较为单一,难以体现分区的综合性。借鉴已有研究[24],本文从总量规模、社会经济、生态环境和空间结构构建碳补偿分区四维框架(图2)。其中,碳排放总量是反映区域碳排放规模的重要指标,一方面不同工业化和城镇化发展阶段都导致碳排放规模的差异,另一方面各碳补偿分区对低碳发展的认知和接受差异,最终均会表现在碳排放规模的变化上。社会经济发展因不同主体功能区的定位、开发方式和发展目标不同,碳排放对经济贡献程度存在较大差异。同时,经济发展过程中碳排放所产生的资源环境的负外部性,是区域间碳责任的重要组成。生态环境主要表现为碳汇功能,碳汇在维持生态平衡方面发挥着重要作用,碳汇资源的保护需要巨大成本或放弃区域发展机会,这势必会影响区域空间发展公平性,在碳补偿分区时要充分考虑生态环境的碳吸收作用。国土空间开发程度是判定区域空间发展潜力的重要指标,不同国土空间利用程度必然导致碳源、碳汇用地组合差异,进而直接影响区域碳收支规模,因此国土空间结构也是碳补偿分区方案的基础性影响因素。
图2
第三,碳补偿分区的核心思想是实现碳排放主体与碳汇主体之间的利益协调,目的在于实现区域之间的碳公平和协同减排。在科学方案划分上,按照碳补偿分区理论框架,将研究区划分为支付区、平衡区和获补区3种类型区[24]。其中支付区是在碳补偿行为中需要通过经济或非经济手段进行补偿支付的区域;平衡区是在碳补偿行为中不需要支付也不获得补偿的区域;获补区是在碳补偿行为中获得经济或非经济补偿的区域。需要注意的是,主体功能区之间由于承载的社会发展功能不同,必然导致一定的碳补偿以达到总体平衡,科学合理的碳补偿机制是实现区域协同碳减排的有力手段。基于主体功能区视角划定碳补偿分区可为确定横向碳补偿关系及其补偿流向提供方向性指导,也有助于提升生态环境保护的积极性。
图3
2.2 碳收支集中化指数
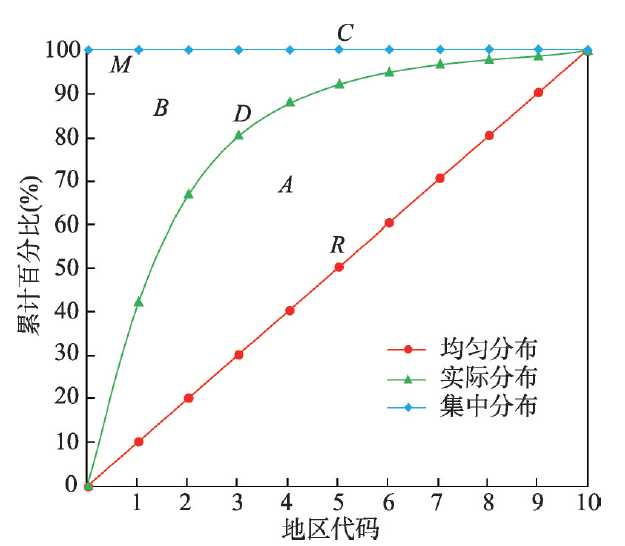
当碳收支均匀分布在各县级单元时,其分布曲线是碳收支累计百分比连接线为45°的对角线R,代表碳收支的绝对均匀;当碳收支集中分布在一个县级单元时,其分布曲线是碳收支累计百分比连接线为位于100%处与X轴平行的一条直线C,代表碳收支分布的绝对集中;碳收支实际分布曲线为D,该曲线上凸程度越大,代表碳收支越是集中于某些县域。假设碳收支实际分布曲线与均匀分布曲线之间的面积为A,碳收支集中分布曲线与均匀分布曲线之间的面积为M,碳收支实际分布曲线与Y轴之间的面积为B,由洛伦兹曲线推算出的碳收支集中化指数表示为:
式中:CEI为碳收支集中化指数,取值范围在0~1之间;CEI越小,碳收支分配越均匀;反之碳收支分配越集中。当CEI = 0时,表示碳收支分配绝对均匀;当CEI = 1时,表示碳收支分配绝对集中。通常以0.4作为碳收支差距的“警戒线”;CEI<0.2表示碳收支分配“高度平均或绝对平均”;0.2 ≤ CEI<0.3表示碳收支分配“相对平均”;0.3 ≤ CEI<0.4表示碳收支分配“比较合理”;0.4 ≤ CEI<0.5表示碳收支分配“差距偏大”;CEI ≥ 0.5表示碳收支分配“高度不平均”。
2.3 分区指标的标准显性比较优势指数
式中:Gi、G分别为各县级单元和全区的GDP;Ci、C分别为各县级单元和全区的碳排放量;CAi、CA分别为各县级单元和全区的固碳量。
式中:
2.4 碳补偿类型区划分
基于碳补偿分区优势属性指数,选择SOM-K-means聚类模型划分京津冀城市群碳补偿类型区。自组织特征映射神经网络(Self-Organization Mapping Net, SOM)是一种能够自组织解决无监督分类问题的神经网络[44];K-means聚类算法是采用误差平方和准则函数作为准则函数,将具有相近特征的数据样本进行分类组织的聚类分析算法。SOM-K-means聚类模型整合了SOM的自组织性、自适应性和容错性等,以及K-means高效率、可解释性好并且收敛速度快等优点对数据样本进行两阶段聚类[45]。第一阶段是采用SOM对数据样本进行初聚类,并得出类别数目和各类的中心点;第二阶段是以第一阶段的聚类结果作为输入值,采用K-means聚类算法而形成最终的聚类结果。SOM-K-means聚类模型的算法见参考文献[45]。
2.5 研究区域与数据来源
本文选取北京、天津和河北3个省市为研究区。考虑到行政区划调整和数据可获得性,结合本文研究的需要,将东城区、西城区、海淀区、朝阳区、丰台区和石景山区6个主体功能定位一致的区合并为北京市城区;将和平区、河西区、河东区、南开区、河北区和红桥区6个主体功能定位一致的区合并为天津市城区;河北省各地级市中心城区也按照主体功能区定位进行相应合并处理,合并处理后得到157个县域单元。
本文碳排放和固碳数据来自Scientific Data发布的数据[46],该数据是基于粒子群优化—反向传播(PSO-BP)算法开发的新模型,统一DMSP/OLS和NPP/VIIRS卫星图像的尺度,得到稳定且连续的夜间灯光数据,然后基于自上向下的加权平均策略得到县级碳排放量和固碳量。围场满族蒙古族自治县碳排放和固碳数据缺失,通过求取相邻县域碳排放和固碳量均值补齐。其他社会经济数据来源于《北京市统计年鉴(2001—2018)》《天津统计年鉴(2001—2018)》《河北经济年鉴(2001—2018)》《中国县域统计年鉴(2001—2018)》《2017年中国城市建设统计年鉴》、《2017年中国县城建设统计年鉴》以及统计机构发布的官方数据和统计公报。优化开发区、重点开发区、农产品主产区和重点生态功能区来源于京津冀三省市的主体功能区规划。需要说明的是:① 本文的碳指的是CO2,研究重点是区域内的碳排放与碳吸收,不涉及区域外的隐含碳收支;② 2017年北京各区建设用地面积缺失,采用2016年数据补齐,数据来源于各区国土空间规划(2017—2035)。
3 京津冀城市群碳收支时空分异
取2000—2017年京津冀城市群碳排放量和碳吸收量均值的50%、100%和150%,将碳排放量和碳吸收量划分为低、较低、较高、高4个等级,然后基于ArcGIS软件对2000年、2010年和2017年碳排放和碳吸收的空间分布进行可视化,并绘制2000—2017年京津冀城市群碳收支集中化指数变化图。同时按照优化开发区、重点开发区、农产品主产区和重点生态功能区,对各类功能区的碳收支进行分解,并测算各类功能区碳收支的集中化指数。
3.1 京津冀城市群碳排放时空特征
2000年以来,京津冀城市群碳排放量从3.387亿t稳步升至2012年的9.204亿t,之后波动下降至2017年的8.940亿t,尤其是2014年以后下降趋势较明显,表明京津冀协同发展对缓解京津冀碳排放作用明显。
县级尺度碳排放整体呈现以京津唐为高值中心,向外逐步降低的“核心—外围”结构(图4)。2000年碳排放高值区包括北京城区、通州区,天津滨海新区,石家庄、唐山、保定、邯郸和秦皇岛市辖区;较高值区包括天津城区,张家口市辖区及武安、武清、西青、东丽、静海和顺义。这两类地区数量共计16个,人口集中、经济发达,既是生产中心,也是消费中心,碳排放量占比为39.99%,其他141个县域为碳排放低值和较低值区,主要分布在广大北部、西部和南部县域,承载了60.01%的碳排放。与2000年相比,2010年除碳排放低值区数量减少外,其他各类型区数量均明显增加。高值区和较高值区数量增加至51个,承载的碳排放比重上升至69.09%。较低值区数量由25个扩散至55个,低值区由116个大幅压缩至51个,这两类区域承载的碳排放比重下降至30.91%。到2017年碳排放高值区上升至39个,分布于东部津唐滨海地区、南部的石家庄、邯郸市辖区、中部的北京、廊坊部分辖区、保定市辖区及西北的张家口市辖区;较高值区主要分布在高值区周边,包括承德、沧州市辖区及昌平、高碑店、宁晋等24个县域单元;其他广大94个偏北、偏西和偏南县域多为较低和低值区,碳排放量占比为25.47%,仅承载了京津冀地区不到3成的碳排放。
图4
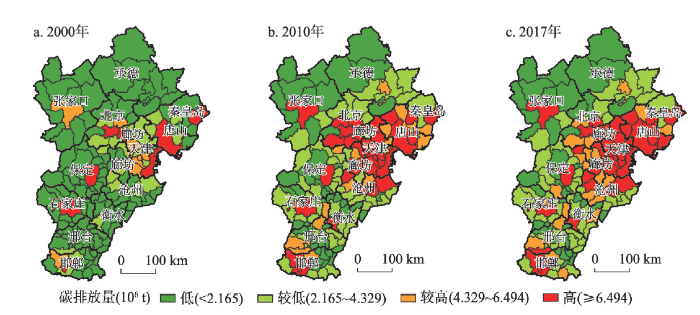
图4
京津冀城市群碳排放空间分布
Fig. 4
Spatial distribution of carbon emissions in Beijing-Tianjin-Hebei Urban Agglomeration
从各主体功能区碳排放情况看,各类功能区碳排放与主体功能区战略定位较为吻合。优化开发区和重点开发区两类城市化地区承担了吸纳人口、经济发展和产业集聚等重任,碳排放显著高于限制开发区域,是京津冀城市群碳排放的主要承压区(图5)。除重点生态功能区2010年和2017年碳排量基本持平外,其他3类功能区的碳排显著增加,尤其以优化开发区上升幅度最为明显。但2010—2017年各功能区碳排放上升的幅度较2000—2010年明显趋于缓和,一定程度上表明京津冀协同发展推动了京津冀生态环境协同治理,降低了京津冀城市群碳排放增速。
图5
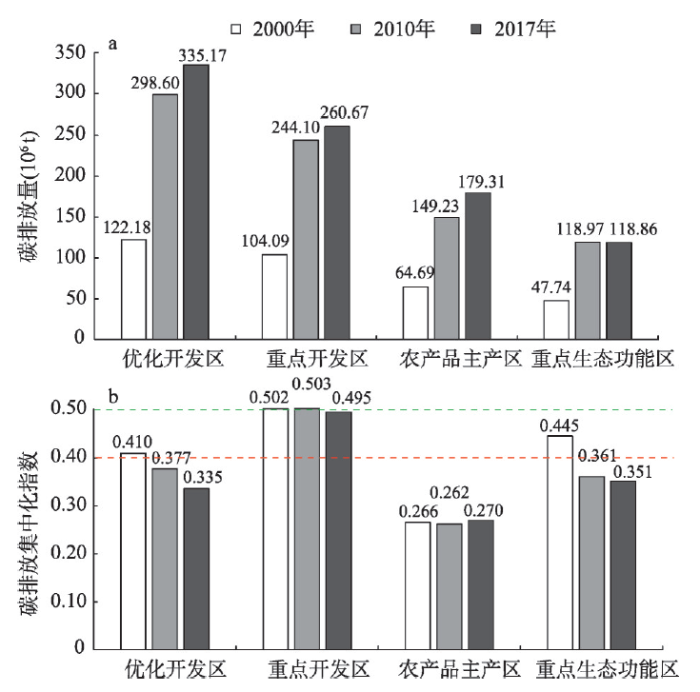
图5
各类主体功能区碳排放量及集中化指数
Fig. 5
Carbon emissions and centralization index of different major function-oriented zones
从集中化指数看,2000—2017年京津冀城市群碳排放集中化指数由0.510波动下降到0.483(图6),均高于0.4的“警戒线”。2000—2006年碳排放集中化指数均高于0.5,处于高度不平均态势,2006年以后介于0.4~0.5之间,表明京津冀城市群碳排放地区差异虽然呈现缩小态势,但整体差异依旧偏大。从各功能区碳排放集中化指数看,各功能区碳排放集中化指数差别较大(图5)。重点开发区的集中化指数最高,3个时间点均在0.5左右徘徊,碳排放始终处于高度不均匀状态;重点生态功能区和优化开发区碳排放集中化指数在2000年超过0.4的“警戒线”,碳排放相对差距较大,但2010和2017年下降至0.4以下,碳排放趋于均衡;农产品主产区的碳排放集中化指数稳定在0.27左右,处于相对均匀态势。
图6
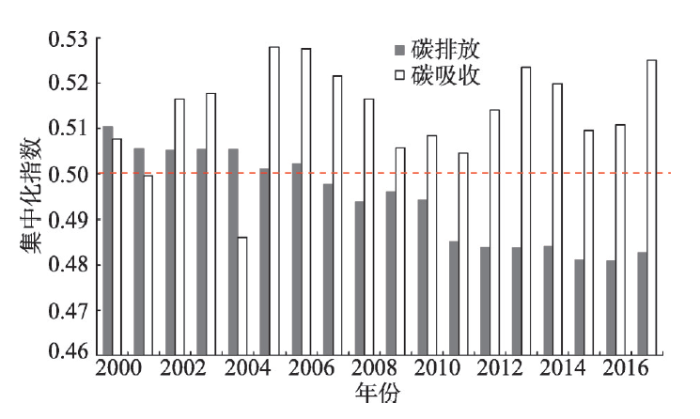
图6
2000—2017年京津冀城市群碳收支集中化指数
Fig. 6
Centralization index of carbon budget in Beijing-Tianjin-Hebei Urban Agglomeration from 2000 to 2017
3.2 城市群碳吸收时空特征
2000—2017年京津冀城市群碳吸收量从1.916亿t波动上升至2.898亿t,较2000年增幅达到51.25%,尤其是2014年京津冀协同发展战略提出后,京津冀生态环境明显改善,碳吸收量上升趋势尤为明显,2016年达到3.128亿t,为研究时段内最高值。
县级尺度碳吸收空间分布格局较稳定,总体呈现出东、北、西部高,而中、南部低的倒“U”型空间格局(图7)。2000年碳吸收高值区包括唐山、秦皇岛、张家口三市市辖区及丰宁、围场、隆化等21个县级单元;较高值区主要沿高值区周边分布,包括石家庄、邢台市区,乐亭、兴隆、滦南、昌黎和邢台等16个县级单元。这两类县域是保障京津冀生态安全的重要区域,生态环境质量好,生态服务功能强,不到25%的县域承载了京津冀城市群61.08%的固碳量,其他120个县域为碳吸收低值和较低值区,主要分布在广大中部和南部县域及北部的承德市辖区、张家口、唐山和秦皇岛部分县域,承载了不到40%的碳吸收。2010年碳吸收高值区数量增加至30个,较高值区数量依旧为16个,这两类区域承载的固碳比重上升至67.58%。较低值区数量由28个扩散至42个,低值区由92个缩至69个,这两类区域承载的碳吸收比重下降至32.42%。2017年碳吸收空间分布格局与2010年相比变化不大,高值区主要分布于东部津唐秦沧滨海地区、北部的承德、张家口绝大多数县域、北京市的延庆、密云、怀柔、房山4区、保定市西北部县域及石家庄平山等35个县域;较高值区主要包括迁西、遵化、阳泉及南部的邢台、涉县等15个县域。其他107个中部偏南县域及北部的承德市辖区、唐山和秦皇岛部分县域多为较低和低值区,碳吸收比重下降为28.28%,承载了京津冀城市群不到3成的碳吸收量。
图7
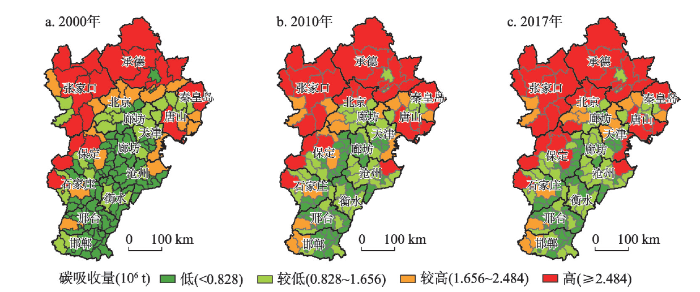
图7
京津冀城市群碳吸收空间分布
Fig. 7
Spatial distribution of carbon absorption in Beijing-Tianjin-Hebei Urban Agglomeration
各类型功能区碳吸收与主体功能区战略定位也较为吻合。4类功能区的碳吸收量均呈现明显上升态势,尤其是以重点生态功能区碳吸收量上升趋势最为明显,各类功能区碳吸收量的顺序为:重点生态功能区>农产品主产区>优化开发区>重点开发区(图8)。重点生态功能区承担了调节区域气候、涵养水源、防风固沙、维护天然“绿心”等重任,是碳吸收量最多的类型区;农产品主产区粮食、蔬菜种植面积广,田间林地保有量较大,森林覆盖率较高,碳吸收量位居第二;而优化开发区和重点开发区国土空间开发程度高,高强度、大规模的城镇化和工业化占用城市绿色生态空间,导致该两类功能区碳吸收量较少。
图8
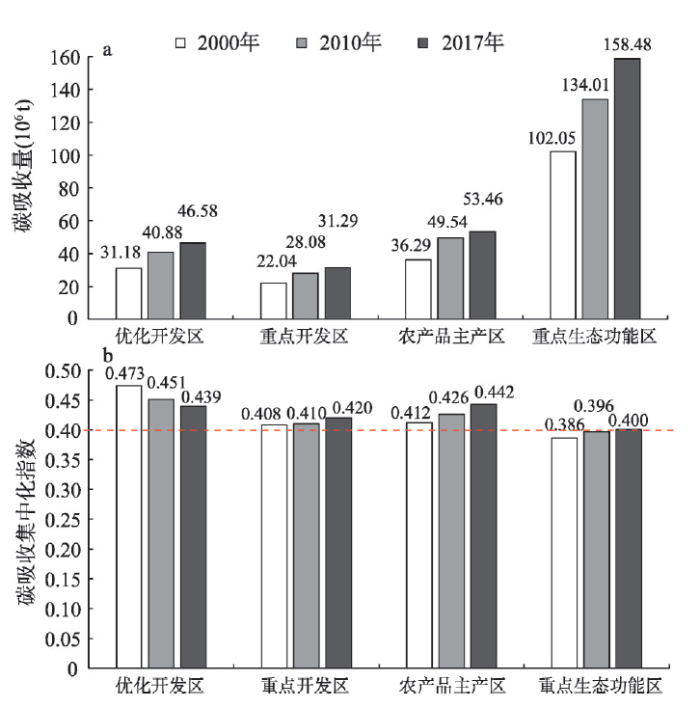
图8
各类主体功能区碳吸收量及集中化指数
Fig. 8
Carbon absorption and centralization index of different major function-oriented zones
从京津冀城市群碳吸收集中化指数看,除2000年、2001年和2004年外,其他年份碳吸收量集中化指数明显高于碳排放集中化指数,表明碳吸收不平均状态明显强于碳排放。2000—2017年京津冀城市群碳吸收量集中化指数波动较大,由0.508波动上升到0.525(图6),表明京津冀城市群碳吸收分配趋于集中,且除2001年和2004年碳吸收量集中化指数介于0.4~0.5之间外,其他年份均超过0.5,处于高度不平均状态。从各功能区碳吸收集中化指数看,各功能区碳吸收集中化指数差别较碳排放集中化指数小(图8)。优化开发区的集中化指数最高,虽由0.473下降至0.439,但碳吸收差距始终偏大;农产品主产区和重点开发区碳吸收集中化指数介于0.4~0.5之间,但上升趋势明显,碳吸收差距偏大趋势明显;重点生态功能区碳吸收集中化指数紧逼0.4“警戒线”,碳吸收相对差距逐渐增大。
4 京津冀城市群碳补偿分区及优化方案
4.1 碳补偿分区各属性比较优势指数
根据碳补偿总量规模、社会经济、生态环境和空间结构4个属性的指标值,运用标准显性比较优势指数测算京津冀城市群碳补偿分区各属性的比较优势指数,并绘制各属性比较优势指数空间分布图(图9)。
图9
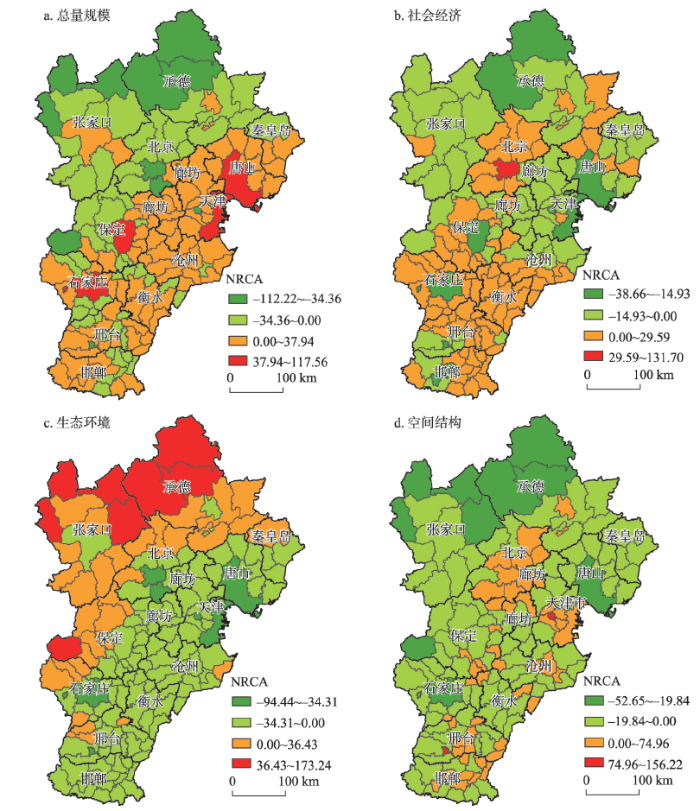
图9
京津冀城市群碳补偿各属性比较优势指数空间分布
Fig. 9
Spatial distribution of NRCA index of carbon compensation factors of Beijing-Tianjin-Hebei Urban Agglomeration
① 碳补偿总量规模属性的优势区大多数位于优化开发区和重点开发区域,表明这两类主体功能区碳排放规模大,亟需通过产业转型升级、避免盲目建设扩张、提高能源利用效率等手段做好节能减排工作。② 碳补偿经济属性优势区主要分布在京津冀城市群东北部、中部和南部地区,多位于以农产品主产区和重点生态功能区为代表的限制开发区。这些地区的碳排放经济贡献度较高,而天津市城区、唐山市区、滨海新区、石家庄市区、秦皇岛市区等部分优化开发区、重点开发区为碳补偿经济属性劣势区,表明这些区域的能源经济产出效率较低,碳排放经济贡献能力较弱,可能存在粗放型经济发展模式等问题。③ 碳补偿生态环境属性的优势区大多分布于京津冀城市群北部坝上高原山地区、冀北燕山山区和冀西太行山山区,这些地区森林资源丰富,是京津冀城市群重要的生态安全屏障,对城市群起着水源涵养、防风固沙、气候调节等重要生态作用,碳补偿生态环境属性优势明显。④ 碳补偿空间结构优势区主要分布在京津地区及东部偏南的少数县域,空间结构属性劣势区主导京津冀城市群的空间结构属性。其中,需要对属于空间结构功能劣势区的唐山市区和石家庄市区进行特别说明,由于该两地区碳补偿总量规模属性具有明显优势性,相比较而言,其他属性优势性被相对弱化。
4.2 碳补偿分区及空间优化方案
图10
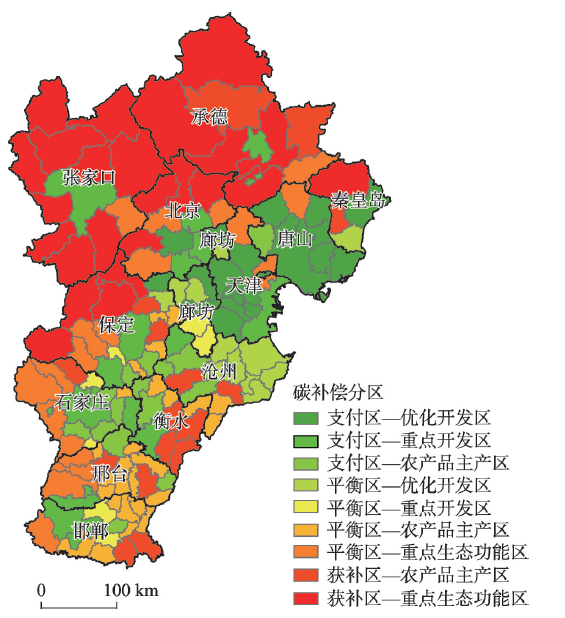
图10
主体功能区划下京津冀城市群碳补偿空间分区
Fig. 10
Carbon compensation zoning based on major function-oriented zones
表1 京津冀城市群碳补偿类型区主要指标
Tab. 1
| 碳补偿空间分区(单元数) | 土地面积 占比(%) | GDP 占比(%) | 碳排放总量占比(%) | 碳排放经济 贡献系数 | 碳排放生态 承载系数 | 国土空间 开发程度(%) |
|---|---|---|---|---|---|---|
| 支付区—优化开发区(21) | 11.030 | 54.631 | 29.755 | 1.836 | 0.386 | 9.358 |
| 支付区—重点开发区(17) | 11.698 | 20.843 | 26.140 | 0.797 | 0.357 | 9.122 |
| 支付区—农产品主产区(15) | 5.291 | 4.168 | 6.839 | 0.609 | 0.539 | 2.189 |
| 平衡区—优化开发区(12) | 4.992 | 3.060 | 7.735 | 0.396 | 0.593 | 3.617 |
| 平衡区—重点开发区(7) | 2.026 | 1.559 | 3.017 | 0.517 | 0.487 | 2.095 |
| 平衡区—农产品主产区(26) | 6.038 | 2.925 | 7.199 | 0.406 | 0.628 | 2.508 |
| 平衡区—重点生态功能区(19) | 12.474 | 6.439 | 8.392 | 0.767 | 1.392 | 3.432 |
| 获补区—农产品主产区(16) | 10.040 | 2.847 | 6.019 | 0.473 | 1.700 | 1.068 |
| 获补区—重点生态功能区(24) | 36.411 | 3.528 | 4.903 | 0.720 | 8.771 | 0.774 |
4.2.1 支付区 支付区主要位于城市群的东、中南部地区,包含优化开发区、重点开发区和农产品主产区。该区国土空间面积占京津冀城市群的28.02%,经济发展水平高,GDP占比接近80%,碳排放占比高达62.73%,碳排放经济贡献能力与碳排放生态承载能力处于严重不匹配状态(碳排放经济贡献系数为1.270,碳排放生态承载系数为0.391)。
(1)支付区—优化开发区主要由北京、天津城区,唐山、秦皇岛、廊坊和沧州市区等21个县级单元组成。属城市化、工业化高强度开发地区,经济发展迅速,碳排放经济效益较高(国土空间开发强度为9.358%,GDP占比高达54.631%,碳排放经济贡献系数为1.836)。但资源环境压力极大,碳排放总量占比为29.755%,碳排放生态承载系数仅为0.386。在今后的发展中,北京城区、天津城区要实行更严格的碳排放标准和产业准入环境标准,严控碳排放总量,完善碳排放权交易制度,建设清洁低碳、安全高效的能源体系,缓解资源矛盾。推动产业结构向高端、高效、高附加值转变,提升碳排放经济贡献能力;同时要严格保护颐和园、西山国家森林公园等禁止开发区,加强城市森林、公园绿地和景观河道建设,提升碳吸收能力。廊坊环首都地区要大力发展绿色低碳经济,构建绿色、低碳、生态的现代化产业体系,以城镇、交通干线绿化为重点,完善城市森林公园、绿色通道和农田防护体系建设,扩大绿色生态空间,构筑环首都绿色经济圈,提升碳排放经济贡献能力和碳排放生态承载能力。唐山和秦皇岛沿海地区要积极探索发展海洋经济新途径,推动海洋产业向纵深化发展以此提高碳排放经济贡献能力,同时要严格保护海岛、滨海湿地、重要河口、沿海基干林带和沿海滩涂等重要生态资源。
(2)支付区—重点开发区包括通州,滨海新区,石家庄、保定、邢台、邯郸、承德和衡水市区等17个县级单元。国土空间开发强度接近于支付区—优化开发区(国土空间开发强度为9.122%),经济发展良好,碳排放经济贡献度略高(占GDP总量的20.843%,碳排放经济贡献系数为0.797),但资源环境压力较大(碳排放总量占比高达26.140%,碳排放生态承载系数仅为0.357)。通州、滨海新区作为京津冀重要经济增长极,在今后发展中应进一步优化国土空间结构,适度控制城市空间规模扩张,充分挖掘各类用地潜力,提高国土空间利用效率、能源利用效率及经济效益产出,降低能耗并促进经济发展方式转型升级。石家庄、保定、邢台、邯郸市区等太行山山前平原地带是国家重要的传统重工业集聚区,应转变经济发展方式,积极培育经济发展新动能,通过产业转型升级来促进低碳发展,同时应调整能源结构,试行燃煤总量控制,提高能源利用效率,推进工业和城市污染防治,进一步扩大绿色生态空间。衡水市区应统筹周边地区建设滨湖旅游城市,发展生态旅游,扩大园林和绿地面积,加强空间污染治理,提高碳排放生态承载能力。
(3)支付区—农产品主产区包括无极、元氏、赵县、晋州、玉田、肥乡、宁晋、清河、蠡县、安国、肃宁、泊头、河间、安平和深州15个县级单元。该区域为重要优质农产品基地,农业发展的条件和基础良好,但受人类活动干扰较强。相较于其他农产品主产区,该区碳排放经济贡献度较高,而碳排放生态承载能力较低(碳排放经济贡献系数为0.609,碳的生态承载系数为0.539)。今后应合理控制城镇规模,避免工业化城镇化过度开发导致的生态退化,限制有损自然生态系统的农业开发,注重保护生态和粮食安全。严格建设用地管理和环境质量控制,提高集约化程度,加强耕地保护,确保基本农田面积不减少、质量有提高。同时要建立现代农业产业体系,落实强农惠农政策以提高农业综合生产能力,推进农业产业化发展,拓展农村就业增收空间,提高农户生产积极性,并通过加强农业科技创新手段,提升农业生产效率和节能减排潜力。
4.2.2 平衡区 平衡区国土空间面积占比为25.53%,包含优化开发区、重点开发区、农产品主产区和重点生态功能区。该区GDP占比相对较低,为13.98%,碳排放占比为26.34%,碳排放经济贡献与碳汇生态功能处于较为匹配稳定状态(碳排放经济贡献系数为0.531,碳排放生态承载系数为0.845)。
(1)平衡区—优化开发区由昌黎、高碑店、沧县、青县、海兴、盐山、孟村、黄骅、固安、永清、香河和大厂12个县级单元组成,主要位于环渤海地区和燕山山前平原。相较支付区—优化开发区,该区域碳排放量和碳排放经济贡献低(碳排放总量占比为7.735%,碳排放经济贡献系数为0.396),经济发展水平一般(占GDP总量的3.060%),碳生态功能较强(碳的生态承载系数为0.593)。这些地区作为京津冀城市功能拓展和产业转移的承载地,一方面要优化城市功能分区,强化城市的综合服务功能,积极构建新型产业集群。同时要全面推进生态城市建设,增加城市园林、公共绿地、人工湿地、防护林等生态空间,构建以燕山山区水源涵养林草带和沿海防护林带等为主的生态网络,着力维护和增强生态系统的碳汇功能。
(2)平衡区—重点开发区包括高邑、新乐、成安、永年、望都、大城和文安7个县级单元,其构成的县级单元最少,主要位于冀中南和张承盆谷地区。相较支付区—重点开发区,该类型区碳排放量较低,碳排放总量占比仅为3.017%,碳排放生态承载系数为0.487,碳汇生态功能相对较强。其GDP仅占总量的1.559%,碳排放经济贡献系数为0.517,经济发展程度和碳排放经济效益均较低。高邑、望都今后可适度加大城镇化推进力度,利用石家庄和保定两个市区的辐射带动作用,构建现代产业体系,发展绿色低碳产业,并加强对已有碳汇资源和空间的保护,建设宜业宜居的绿色生态城市。其他县级单元在未来城镇化工业化过程中,应避免对生态环境的破坏,注重保护区域绿色空间,维持碳汇资源生态功能。
(3)平衡区—农产品主产区包含深泽、临漳、磁县、邱县、鸡泽和广平等26个县级单元,该区碳碳排放总量占比为7.199%,经济发展水平相对滞后,碳排放经济贡献能力较弱(占GDP总量的2.925%,碳排放经济贡献系数为0.406),碳汇生态功能较强(碳排放生态承载系数为0.628)。作为农产品主产区,今后要控制开发强度,优化开发方式,控制对基本农田等农业空间的过度占用,提高耕地集约化程度。积极推进农产品区域化布局、规模化生产,积极发展循环农业和生态农业,提高土地产出率,同时应在保持低碳排放量的基础上,改善农业生态环境,加大对沙荒地、盐碱地、荒草地和其他未利用地的综合开发和治理,有效增加植被郁闭度,提高碳排放的生态承载力。
(4)平衡区—重点生态功能区包括房山、昌平、平谷、宁河、蓟州、井陉、灵寿、赞皇、平山、迁西、涉县、邢台、临城、内丘、唐县、曲阳、顺平、怀来和宽城19个县级单元。该类型区碳排放比重较高(8.392%),位居所有类型区第三,经济发展水平、碳排放经济贡献度和碳排放生态承载能力较其他平衡区强(占GDP总量的6.439%,碳排放经济贡献系数为0.767,碳排放生态承载系数为1.392)。该区域多位于山区与平原区的过渡地带,生态环境比较脆弱,在未来发展中,一方面要严格控制大规模高强度的工业化城镇化开发,着力加强对碳汇资源的修复和保护,提升区域碳的生态承载力;另一方面要通过合理规划,避免煤、铁、石灰岩等资源的粗放式开采对生态环境的破坏。
4.2.3 获补区 获补区主要位于城市群北部坝上高原山地区、冀北燕山山区和冀西太行山山区,包含农产品主产区、重点生态功能区。该区国土面积占城市群面积的46.45%,国土空间开发程度低(0.838%),经济发展滞后(GDP占比6.375%),碳排放量占比和碳排放经济贡献较小(碳排放占比为10.922%,碳排放经济贡献系数为0.584),碳排放生态承载能力强(碳排放生态承载系数为4.874)。
(1)获补区—农产品主产区由行唐、卢龙、大名、魏县、隆尧、威县、定兴、安新、平泉、隆化、南皮、献县、枣强、武邑、故城和景县16个县级单元组成,分别处于太行山东麓浅山丘陵区和冀北山区,水资源丰富、农业生产条件优越,是国家黄淮海平原农产品主产区的重要组成部分。该区国土空间开发程度和碳排放经济贡献系数均较低(分别为1.068%和0.473),碳汇生态功能较强(碳排放生态承载系数为1.700)。今后发展应合理规划农业生产用地布局,严格控制区域城镇化和工业化大规模开发,稳定基本农田总量。以不牺牲碳的生态承载力为前提,优化农产品产业结构,增强农业综合生产能力和经济效益,加强农田林网、林果基地和片林建设,稳步提高森林覆盖率,进一步增强碳排放生态承载能力。
(2)获补区—重点生态功能区包含门头沟、青龙、涞水、阜平、沽源、康保和尚义等24个县级单元,主要位于坝上高原山地区、冀北燕山山区和冀西太行山山区的核心区,该区域国土空间开发程度最低(0.774%),碳排放量比重较小(4.903%),自然生态条件较好,碳汇资源丰富、生态服务和承载功能极强(碳排放生态承载系数为8.771),是京津冀城市群生态环境调节的重要支撑与屏障。坝上高原山地区是重要的风沙治理防治区、特色有机农产品生产基地,今后应积极加强天然草场保护和人工草场建设,加大沿边沿坝护林带、风沙源治理、退化草场治理等生态工程建设力度。同时控制高耗水农业面积和用水总量,大力发展生态农业和节水种植业,严格控制经济建设对生态环境的影响,实现区域经济发展与环境保护并重。燕山山区和太行山山区是重要的水源涵养区和生态旅游区,要大力保护各类自然保护区、风景名胜区和森林公园等,重点建设水源涵养、水土保持、造林绿化、农田水利等工程,积极发展生态旅游、康复保健、休闲度假等新型服务业。同时要积极发展风能、太阳能、地热能、生物质能,充分利用清洁、低碳能源。
5 结论与讨论
5.1 结论
本文构建了主体功能区视角下碳收支与碳补偿的理论框架,以京津冀城市群157个县级单元为研究区,探讨了全区及各功能区碳收支时空分异特征,然后综合考虑区域碳排放总量规模、社会经济、生态环境及空间结构属性构建了碳补偿分区四维框架,借助标准显性比较优势指数、SOM-K-means聚类等方法划分碳补偿分区,并提出基于主体功能区规划的差别化碳补偿空间优化方案。研究结论如下:
(1)2000年以来,京津冀城市群碳收支量均呈现波动上升态势,县级尺度碳收支时空分异明显。其中碳排放呈现以京津唐为高值中心,向外逐步降低的“核心—外围”结构,碳排放高值区、较高值区数量由16个上升到63个,碳排放比重由39.99%上升到74.53%。碳吸收空间分布格局较稳定,总体呈现出东、北、西部高,而中、南部低的倒“U”型空间格局,碳吸收高值区、较高值区数量由37个上升到50个,碳吸收比重由61.08%上升到71.72%。从集中化指数看,2000—2017年京津冀城市群碳收支的集中化指数均高于0.4的“警戒线”,但碳吸收不平均状态明显强于碳排放,处于高度不平均状态。
(2)各类主体功能区碳收支量均呈现上升态势,碳收支与主体功能区战略定位较为吻合。即优化开发区和重点开发区是京津冀城市群碳排放的主要承压区,而重点生态功能区是京津冀城市群碳吸收的优势主导区。从集中化指数看,各功能区碳排放集中化指数差别较大,重点开发区碳排放始终处于高度不均匀状态,重点生态功能区和优化开发区碳排放相对差距较大,但向均衡态势演变,农产品主产区的碳排放始终处于相对均匀态势。各功能区碳吸收集中化指数差别较碳排放集中化指数小,优化开发区碳吸收差距偏大态势逐渐弱化,其他3类功能区碳吸收集中化指数日渐上升,农产品主产区和重点开发区碳吸收差距偏大趋势明显,重点生态功能区碳吸收集中化指数紧逼0.4“警戒线”,碳吸收相对差距逐渐增大。
(3)依据县域各属性比较优势指数值,建立SOM-K-means聚类分区模型将京津冀城市群划分为53个支付区、64个平衡区和40个获补区。将主体功能区划与碳补偿分区相结合,将京津冀城市群县域碳补偿分区重构为9种类型,进一步细化碳补偿分区方案,提出功能区差别化碳补偿空间优化方案。
5.2 讨论
本文尝试探究了主体功能区视角下京津冀城市群碳收支的时空分异特征,并提出了低碳导向的差别化碳补偿空间优化方案,此研究切合“十四五”时期,中国生态文明建设将进入以降碳为重点的战略方向,对于推动京津冀生态环境协同治理,实现协同创新与引领发展具有重要意义。展望未来,以下问题有待进一步研究。
(1)区域碳收支及碳补偿差异对空间尺度变化具有较强敏感性,不同空间尺度碳收支与碳补偿的演变态势和作用机理不尽相同。一般而言,碳收支与碳补偿的空间尺度越大,区域内部的自然和社会经济条件越复杂,碳收支及碳补偿的研究结果可能越失真,从而不利于构建针对性的碳补偿方案[7]。因此更微观尺度的碳收支及横向碳补偿研究的实践价值更高,未来需开展更细尺度的调研,加强乡镇级或村级空间单元的碳收支及补偿研究。
(2)碳补偿实质上是一种以“碳”为纽带的生态补偿,目的是实现区域之间公平发展和协同碳减排。但实际上区域之间的公平和协同碳减排还受到人均碳排放水平、经济发展程度和阶段、产业结构、贫困化程度等众多因素的影响。鉴于数据的可得性,本文仅考虑规模、效益和空间等因素,构建碳补偿的理论框架,未来需综合考虑区域内自然和社会经济条件,不断丰富和完善区域碳补偿的理论框架,这对于构建更科学客观的区域横向碳补偿方案具有重要理论价值。
(3)作为一个探索性研究,本文仅划分了碳补偿类型区,并未核算各类型区碳补偿的价值标准,未来应结合区域资源禀赋、碳排放强度、经济发展、产业状况、碳价格等确定碳补偿基准值,核算碳补偿价值,推动区域低碳协调发展。碳排放权交易作为一种运用市场机制引导碳排放权最优配置,以低成本高效益的方式实现碳减排和经济高质量发展的重要手段,未来亟待将区域碳补偿融入到企业碳交易市场,建立健全跨区域碳补偿体制和碳排放配额制度,探索实现“双碳”目标的多元化路径,实现区域公平发展和协同碳减排。同时,值得注意的是,目前关于碳收支与碳补偿的研究主要是关注区域内终端消费碳排放,而对区域间隐含碳收支和补偿分区的关注不足,未来亟待强化隐含碳补偿收支及补偿分区的研究。
参考文献
The characteristics and mechanisms of carbon emissions from energy consumption in China using DMSP/OLS night light imageries
基于夜间灯光数据的中国能源消费碳排放特征及机理
Examining the effects of income inequality on CO2 emissions: Evidence from non-spatial and spatial perspectives
DOI:10.1016/j.apenergy.2018.11.082 URL [本文引用: 1]
Warming caused by cumulative carbon emissions towards the trillionth tonne
DOI:10.1038/nature08019 URL [本文引用: 1]
Soil warming and carbon-cycle feedbacks to the climate system
In a decade-long soil warming experiment in a mid-latitude hardwood forest, we documented changes in soil carbon and nitrogen cycling in order to investigate the consequences of these changes for the climate system. Here we show that whereas soil warming accelerates soil organic matter decay and carbon dioxide fluxes to the atmosphere, this response is small and short-lived for a mid-latitude forest, because of the limited size of the labile soil carbon pool. We also show that warming increases the availability of mineral nitrogen to plants. Because plant growth in many mid-latitude forests is nitrogen-limited, warming has the potential to indirectly stimulate enough carbon storage in plants to at least compensate for the carbon losses from soils. Our results challenge assumptions made in some climate models that lead to projections of large long-term releases of soil carbon in response to warming of forest ecosystems.
Green development: Functional definition, mechanism analysis and development strategy
绿色发展: 功能界定、机制分析与发展战略
Carbon budget of forest ecosystems and its driving forces
森林生态系统碳收支及其影响机制
County-level carbon compensation of Henan province based on carbon budget estimation
基于碳收支核算的河南省县域空间横向碳补偿研究
Land cover change and spatial difference measurement of carbon budget in Hangzhou city
杭州市土地覆被变化与碳收支空间分异测度
Spatial variation of carbon budget and carbon balance zoning of Central Plains Economic Region at county-level
DOI:10.11821/dlxb201410003
[本文引用: 3]

Regional carbon budget and carbon balance is one of the core fields of the studies on global climate change and carbon emission. Study on carbon budget and carbon balance based on county scale will not only help to establish theoretical framework for the evaluation of carbon efficiency and carbon ecological pressure on county- level, but also has great significance for county- level carbon compensation and the formation of low- carbon development strategies. Using statistical data and land use data of 2009 of each county in Central Plains Economic Region, the carbon budget and its spatial distribution of Central Plains Economic Region was estimated and analyzed, and furthermore the optimization scheme of main functional areas of Central Plains Economic Region based on carbon budget zoning was put forward. The main conclusions are as follows: (1) Total carbon absorption and carbon emission of Central Plains Economic Region in 2009 was 0.13 Gt and 0.21 Gt respectively. There appeared obvious spatial difference among each county. From the spatial level, carbon emission of each county gradually decreased from municipal district to circumjacent counties, while carbon absorption has a characteristic of lower carbon absorption in Northwest and higher carbon absorption in Southeast of Central Plains Economic Region. (2) There was remarkable spatial difference on carbon compensation rate. The higher the per capita GDP, the lower the compensation rate, and vice versa. (3) Economy contribution coefficient of carbon emission was obviously mismatched with carbon ecological capacity because of the different patterns in spatial distribution of carbon sources and sinks. (4) According to the result of carbon balance, the Central Plains Economic Region was divided into five kinds of areas based on the aim of regional low- carbon and harmonious development as follows: carbon emission intensity control area, total carbon emission control area, carbon sink area, carbon budget balance area and low-carbon optimization area. Finally, the optimization scheme for main functional areas of Central Plains Economic Region and the corresponding low- carbon development strategies was put forward based on the carbon balance zoning.
中原经济区县域碳收支空间分异及碳平衡分区
The influence of adjustment in industrial structures on carbon emissions in Shandong Province
产业结构调整对山东省碳排放的影响
Relations between land use carbon budget and economic development at county level in Chengdu city
成都市县域土地利用碳收支与经济发展关系研究
Carbon emission efficiency growth of land use structure and its spatial correlation: A case study of Nanjing city
DOI:10.11821/dlyj201811005
[本文引用: 1]
The increase of carbon emissions has a direct impact on extreme weather disasters and global warming. Therefore, controlling and reducing carbon emissions is one of the important ways to promote ecological balance and regional sustainable development. The difference in urban land use patterns and the different speeds and levels of urban economic development will, of no doubt, lead to the differences in carbon emissions. The amount of carbon emissions from different land use structures and the levels of its efficiency will directly affect the sustainable development of the urban economy, which has aroused the attention of academics. This paper estimated the quantities of carbon emissions of different land types by using the land use structure data from 11 districts in Nanjing from 2005 to 2014, and further introduced the estimated carbon emissions into the DEA model as an undesirable output variable to estimate, compare and analyze the total factor carbon emissions productivity growth of land use structure in Nanjing by using the Hicks-Moorsteen index method. The major results were shown as follows. First, the main sources of carbon emissions for land use structure in Nanjing were the indirect carbon emissions from the construction lands. During the study period, the carbon emissions of land use structure showed a continuous growth trend and certain degree of spatial heterogeneity in the districts of Nanjing city. The severe emission areas were mainly concentrated in the central regions and there was a tendency to shift to the northern regions. Second, the total factor carbon emission productivity growth and its decomposition factors were lower than the traditional total factor productivity (TFP) growth, which means that the traditional TFP growth without considering the constraints of carbon emissions overestimated the actual productivity growth level of land use structure. The total factor carbon emission productivity growth showed a convergence trend with the characteristic of equilibrium development between regions during 2006-2014, due to the fact that the development concept of "low carbon and high efficiency" were deeply rooted in people's mind and the energy consumption per unit of GDP was continuously decreasing. The calculation results of model 2 showed that the total factor carbon emission productivity growth level of Jiangning district was the highest and that of Yuhuatai district was the lowest. Third, the decomposition results of total factor carbon emission productivity growth indicated that the technical efficiencies of all the districts in Nanjing were relatively low, the "technology catch-up" effects were not obvious, and the scale economy effects of land use began to appear, but the scope economy effects were not very significant. Fourth, total factor carbon emission productivity growth presented a positive spatial correlation and the characteristics of spatial agglomeration in all the districts of Nanjing. The districts of high and high (HH) agglomeration were increasing and the districts of low and low (LL) agglomeration were decreasing. Finally, some suggestions were put forward.
南京市土地利用结构碳排放效率增长及其空间相关性
Carbon emission effect of land use in China
[D].
中国土地利用的碳排放效应研究
[D].
Misunderstandings and future trends of researches on land use carbon emissions in China
中国土地利用碳排放的研究误区和未来趋向
The carbon emission intensity of land use conversion in different regions of China
中国区域土地利用类型转变的碳排放强度研究
Overview of regional carbon compensation: Mechanism, pattern and policy suggestions
区域碳补偿研究综述: 机制、模式及政策建议
Study on carbon offsetting in cap- and- trade mechanism
总量控制与交易机制中的碳补偿制度研究
Risks to forest carbon offset projects in a changing climate
Study on ecological forest compensation mechanism of the Chongqing reservoir area in Three Gorges
[D].
三峡水库重庆库区生态公益林补偿机制研究
[D].
Study on agricultural carbon sink function and compensation mechanism
[D].
农业碳汇功能及其补偿机制研究
[D].
Net carbon emissions estimates and carbon offsets in rural tourism destinations from a carbon neutral perspective
[D].
碳中和视角下乡村旅游地净碳排放估算与碳补偿研究
[D].
Regional allocation of carbon emission quotas in China: Evidence from the Shapley value method
DOI:10.1016/j.enpol.2014.08.006 URL [本文引用: 1]
Spatial variation of land use carbon budget and carbon compensation zoning in functional areas: A case study of Wuhan Urban Agglomeration
DOI:10.31497/zrzyxb.20190508 URL [本文引用: 5]
功能区土地利用碳收支空间分异及碳补偿分区: 以武汉城市圈为例
Comparison of factors affecting tourism operators' carbon offset willingness of forest parks
森林公园旅游经营者碳补偿意愿的影响因素比较
Spatial-temporal differences and cluster features of environmental pollution in China
DOI:10.13249/j.cnki.sgs.2016.07.004
[本文引用: 1]
Based on the multi-scale analysis of cities at the prefecture level and major function oriented zones (MFOZ), the process of spatial-temporal changes and spatial cluster of major pollutant emissions during 2005 to 2012 in China are analyzed in this article. The results show that: Firstly, the emission intensities of major pollutants present a decreasing trend in the order of optimized zones, prioritized zones, food stuff-security zone sand ecological safety zones,and the emission intensities in urbanized areas is significantly higher than that in restricted development areas. In 2012, the emission intensities of water pollutant in various types of MFOZ continues to strengthen compared to 2005, the rapid growth of emission intensitiesin food stuff-security zones and ecological safety zone sare more prominent.Secondly, the overall emission intensities of water pollutant is still on the rise at the national level, although the emission intensities decrease gradually in partial areas of prefecture-level cities in China. High COD emission areas distribute in the most areas of the East, Northeast and Central China, and show the pattern of continuous distribution in Chengdu-Chongqing region, Hohhot-Baotou-Ordos region of Western China. The nationwide emission intensities of atmospheric pollutantre main relatively stable, and the emission intensities in partial areas of China has alleviated. High SO2 emission areas is mainly located in Shanxi, Midwest Inner Mongolia,Shaanxi-Gansu-Ningxia-Henan region along the the Changjiang River,Bohai Rim region and the Changjiang River delta.Thirdly, the emissions of major pollutants have significant agglomeration effects which show a trend of increase since 2005, and theNorth China not only has become the high emission agglomeration, but also presented stronger path dependence and effect of spatial locking. Finally, some measures to reduce pollutants emission intensity are put forward,which should include in the transformation of the pattern of economic development, the establishment of control systemof environmental “red line” and the enrichment of environmental comprehensive treatment tools.
中国环境污染的时空差异与集聚特征
Spatiotemporal patterns and driving factors of environmental stress in Beijing-Tianjin-Hebei region: A county-level analysis
京津冀地区县域环境胁迫时空格局及驱动因素
Spatiotemporal patterns and driving forces of water pollutant discharge in the Bohai Rim Region
环渤海地区水污染物排放的时空格局及其驱动因素
Research on carbon dioxide emissions peaking in Beijing-Tianjin-Hebei city agglomeration
京津冀城市群二氧化碳排放达峰研究
County scale characteristics of CO2 emission's spatial-temporal evolution in the Beijing-Tianjin-Hebei metropolitan region
DOI:10.1021/es001204i URL [本文引用: 1]
县域尺度的京津冀都市圈CO2排放时空演变特征
Supply and demand measurement and spatio-temporal evolution of ecosystem services in Beijing-Tianjin-Hebei Region
京津冀地区生态系统服务供需测度及时空演变
Identifying driving forces of CO2 emissions in Beijing-Tianjin-Hebei region from temporal and spatial angles
京津冀CO2排放的时空差异及影响因素研究
Decomposition of carbon emission influence factors in Beijing-Tianjin-Hebei region and its trend in the new normal situation
京津冀地区碳排放因素分解: 兼论“新常态”下的变动趋势
Research on factor decomposition and scenario prediction of Beijing-Tianjin-Hebei regional energy consumption carbon emission
[D].
京津冀能源消费碳排放影响因素分析及情景预测研究
[D].
The scientific foundation of major function oriented zoning in China
我国主体功能区划的科学基础
The strategy of major function oriented zoning and the optimization of territorial development patterns
主体功能区战略与优化国土空间开发格局
Draft of major function oriented zoning of China
DOI:10.11821/dlxb201502002
[本文引用: 1]
Major Function Oriented Zoning (MFOZ) is the blueprint for the future developmnt and protection pattern of China's territory, and has been raised to from major function zones planning to major function zoning strategy and major function zoning institution. From 2004 to 2014, the author organized a series of research projects to compose MFOZ for the country, studied basic theory of regional function and MFOZ technical process, and proposed that space controlling zones of national and provincial scales can be divided into four types: urbanized zones, foodstuff-security zones, ecological safety zones, cultural and natural heritage zones. On this basis, major function zones of county scale should be transferred to optimized, prioritized, restricted, and prohibited zones. In this paper, a regional function identification index system comprising nine quantitative indicators (including water resources, land resources, ecological importance, ecological fragility, environment capacity, disaster risk, economic development level, population concentration and transport superiority) and one qualitative indicator of strategic choice is developed. Based on the single index evaluation, comprehensive evaluation using regional function suitability evaluation index is conducted, aiming at testing several key parameters including lower limit of protection zones and upper limit of development zones at the provincial level. In addition, a planning-oriented zoning method of major function zones is also discussed, which has brought the first MFOZ planning in China. According to the MFOZ caliber, it is forecasted that national spatial development intensity will rise from 3.48% in 2010 to 3.91% in 2020. Furthermore, according to caliber of the provincial integrated MFOZ planning, the area of optimized, prioritized and restricted zones accounts for 1.48%, 13.60% and 84.92%, respectively, and that of urbanized, foodstuff-security and ecological safety zones accounts for 15.08%, 26.11% and 58.81%, respectively. In combination of analyses of development level, resources and environmental carrying status and quality of the people's livelihood, the main characteristics of MFOZ were identified. Through verification, MFOZ draft of national and provincial scales, which is interactively accomplished with "MFOZ Technical Process" put forward by the author, is mostly above 80% identical with what have been forecasted.
中国主体功能区划方案
Progress and trends of land spatial regulation, unbalanced development and spatial externalities
国土空间管制、土地非均衡发展与外部性研究: 回顾与展望
Study on coordinating development of economic, social growth with population, resources and environment at county level
DOI:10.11821/xb199104001
[本文引用: 1]
County level is a basic unit for territorial study on the development of population, re-sources and environment(DPRE).
县域经济和社会同人口、资源、环境协调发展研究
Evolution trend of regional centralization of grain production in China
中国粮食生产区域集中化的演化趋势
Spatio-temporal scale analysis on the equality of energy consumption carbon emission distribution in China
基于时空尺度的中国省级区域能源消费碳排放公平性分析
The normalized revealed comparative advantage index
DOI:10.1007/s00168-008-0213-3 URL [本文引用: 1]
Trade liberalisation and "revealed" comparative advantage
DOI:10.1111/j.1467-9957.1965.tb00050.x URL [本文引用: 1]
Self-organized formation of topologically correct feature maps
DOI:10.1007/BF00337288 URL [本文引用: 1]
SOM+K-means two-phase clustering algorithm and its application
SOM+K-means两阶段聚类算法及其应用
County-level CO2 emissions and sequestration in China during 1997-2017
