

1 引言
新型冠状病毒肺炎(COVID-19)疫情自2019年末暴发,引发了一场全球性公共卫生突发事件,不仅给世界经济带来巨大冲击,而且持续影响各国人民的生活方式。疫情扩散不仅受COVID-19病毒的强传染特性影响,也与人口分布、气候条件、交通条件等地理要素直接关联,因而在不同地理区域表现出不同的时空模式,特别是在中国地域辽阔、地理要素分异显著的背景下,这种时空模式的差异性愈发突出。同时,由于减少人员聚集和流动能够有效阻断COVID-19病毒的传播途径,在疫情暴发期间停业、停产甚至“封城”等成为重要的防疫措施,其结果是在遏制疫情扩散取得成效的同时,也对经济社会的正常运行和人们的正常生活造成严重影响。在疫情防控日趋常态化的背景下,为了权衡防疫与保障经济社会秩序的双重目的,不同区域需要因地制宜、因时而动地采取科学而精准的疫情管控措施。因此从地理学的视角揭示特定区域的自然、经济、社会等属性综合作用下的疫情扩散时空模式,并从中解析地理要素的区域分异加剧或阻碍疫情扩散的作用至关重要。
不同领域的学者针对COVID-19疫情开展了大量研究。其中,生物学、医学等领域侧重病因、诊断、治疗等方面[1,2,3],地理学领域则关注疫情扩散的时空特征及其对社会经济的影响,并且相关研究的重点在疫情发展的不同阶段有所不同。在疫情发展初期,为了给抗击疫情提供有效建议,主要研究聚焦疫情相关数据采集和GIS支持下的空间可视化,并评估疫情发展的时空变化趋势和防疫措施效果。如田怀玉等分析了COVID-19疫情暴发最初50 d内中国采取控制扩散措施的效果[4],发现武汉市的封城措施使疫情扩散到其他城市延迟了2.91 d,其中最有效的干预措施是暂停城市公共交通、关闭娱乐场所和禁止公共聚会;傅伯杰等从系统思维的角度总结了中国抗击疫情的经验,强调在全球范围内联合行动、实施系统的抗疫方案的重要性[5]。还有一些学者通过流行病学建模,预估新增确诊病例和死亡人数[6,7,8,9,10]。如Zhu等利用手机信令数据建立模型,预测3种扩散趋势下的病例数,为政府合理分配医疗资源提供参考[11];顾朝林等通过数据建模和预测,认为疫情拐点已现,疫情不会对中国除湖北省以外的地区经济和社会造成巨大影响[12]。在疫情发展中期,更多研究转向疫情与经济社会等因子间的相互作用,如COVID-19疫情对于经济全球化[13]、中国国际航空网络连通性[14]的影响,以及人口流动对于疫情传播的影响[15,16]。刘张等利用多元时空大数据对离开武汉的人群流向进行推演,为制定防疫决策提供科学依据[17]。还有一些研究侧重COVID-19疫情的风险评估,如夏吉喆等对COVID-19疫情在大湾区的传播风险和各类防疫管控措施的效果进行了评估与模拟[18]。COVID-19疫情在中国得到控制以后,关于疫情扩散时空模式的研究才开始出现,但数量较少。王姣娥等认为中国的疫情扩散主要经历了6个阶段,存在邻近扩散、迁移扩散、等级扩散和廊道扩散等4种地理空间模式,疫情的空间扩散过程和速度受不同因素的影响[19]。
综上所述,现有研究主要是不完备扩散过程数据驱动下的特征分析和建模预测,而在疫情扩散完整过程数据的支持下,深入解析疫情扩散时空模式和特征的研究是缺乏的。在此背景下,本文以2020年1月24日—3月18日期间中国COVID-19疫情发生—扩散—消减的一个完整过程为对象,以每日新增确诊病例数据为基础,选取全国317个地级市为基本单元,基于地理学时空分异思想构建疫情扩散空间模式,并解析其时间变化一致性特征,同时探究不同空间模式下的疫情时空演化影响因素,以期为未来突发公共卫生事件下的城市分层及分区管理提供理论依据。
2 研究对象与基础数据
2.1 研究对象
2020年1月23日—4月8日,武汉市实施了“封城”管控措施。2月28日,全国累计治愈病例数首次超过当时实有确诊病例数37414例,表明疫情得到有效控制。3月18日,全国新增确诊病例34例,且全部为境外输入病例,表明中国的疫情防控重心转为“外防输入”。为反映COVID-19疫情自发生至扩散再到消减的一个完整过程,本文以2020年1月24日—3月18日为研究时间段,以中国30个省市自治区(不包括湖北省和港澳台地区)的317个地级市为研究对象,分析疫情扩散的时空模式。
2.2 基础数据
以中国317个地级市的每日新增确诊病例和累计确诊病例作为基础数据,数据来源于国家卫健委(
交通通达水平不仅是城市对外联系的根本保障,也是区域间人口流动的重要基础,特别是航空运输大大缩短了远距离人口流动的时间成本,对于COVID-19疫情扩散有着不可忽视的影响。因此,从武汉天河机场官方网站(
3 研究方法
3.1 疫情扩散的空间模式定义
疫情扩散是一个时空相互叠加的过程。从时间维度看,随着时间的推移,各地区的确诊病例数呈现从无到有—逐步增加—相对稳定—逐步消减的变化;从空间维度看,当疫情在特定地区暴发后,会因该地区与其他地区之间的人员流动而导致疫情的空间范围不断扩大。
根据地理空间的邻近效应,可以认为越接近疫情暴发地的地区,疫情发展越早且程度越严重;反之,远离疫情暴发地的地区,疫情发展较晚且程度逐步衰减。这种疫情扩散的时空特征类似于伯吉斯城市扩张理论中的同心圆型城市扩张模式[20],即以某一中心为源头向四周扩散,并且扩散能力随距离增加而逐渐减弱,直至扩散边界,本文将这种由地理距离控制的扩散模式定义为蔓延型。另一方面,航空、高铁等交通方式会突破地理距离控制的蔓延模式,使得一些与疫情暴发地不是直接相邻且距离较远的地区出现疫情发生早于暴发地的邻近地区、且疫情更严重的特点。这种扩散特征类似于城市扩张理论中的点—轴模式,受到交通可达性与城市间关联程度的显著影响[21],本文将这种扩散模式定义为蛙跳型,并且按照蔓延边界区分出边界内的近距离蛙跳型及边界外的远距离蛙跳型。更进一步,这些蛙跳型地区又可以作为一个次级疫情暴发地,按照地理空间的邻近效应,以蔓延型模式向其周边地区扩散疫情,本文将这种模式定义为综合型(图1)。
图1
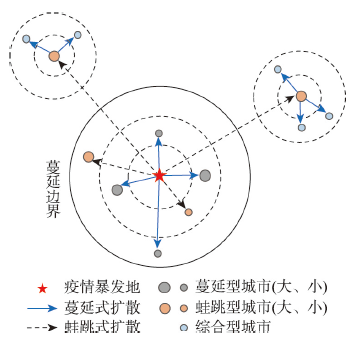
图1
COVID-19疫情扩散的空间模式示意图
Fig. 1
Schematic diagram of the spatial pattern of the spread of the COVID-19 epidemic
3.2 疫情扩散的时空模式判别模型
3.2.1 空间模式判别 假设COVID-19疫情扩散的前提条件是当且仅当某城市的确诊病例数达到一定数量。本文以武汉市封城后各地级市的累计确诊病例数达到一定数量所需天数(
式中:Tj为第j组的平均滞后时间;Dj为第j组距武汉市的平均直线距离;n为各组内的样本数;Tij为地级市i的滞后时间;Dij为地级市i距武汉市的直线距离;j为分组编号;β0、β1为模型的待定系数,通过最小二乘法拟合求得。分组的目的在于去除极端值影响,以准确反映滞后时间随距离而增大的趋势。
首先,根据公式(1)中Tj、Dj的指数型关系,可以认为随着疫情扩散的空间范围逐渐扩大,R2应呈现逐步降低的趋势。依据逐步回归的思想,按照不同城市与武汉市的直线距离由小至大的顺序,在公式(1)中依次加入分组样本,并观察模型决定系数R2的变化。当R2达到拐点时,认为此时的分组样本距武汉的平均直线距离即为蔓延型模式的有效边界。
其次,在蔓延型的有效边界内,进一步根据公式(4)和公式(5),通过对比实际滞后时间与模型预测的滞后时间,判别蔓延型和近距离蛙跳型两种疫情扩散模式。
式中:σj为各组内样本实际滞后时间的标准差。当实际滞后时间
在蔓延型模式的有效边界外,COVID-19疫情扩散的空间模式为远距离蛙跳型或综合型。考虑到省会城市和副省级城市均为各省的重要交通枢纽,交通可达性高,且与武汉市的关联性强,疫情扩散的滞后时间较短,首先将这些城市判别为远距离蛙跳型。对于除此以外的其他城市,进一步对比其实际滞后时间与最邻近蛙跳节点为中心的蔓延预测时间,若实际滞后时间小于蔓延预测时间,则判别为远距离蛙跳型,反之则判别为综合型。
3.2.2 时间过程分类 在空间模式判别的基础上,利用K-means聚类分析方法对疫情扩散空间模式的时间一致性进行探索。K-means聚类分析以簇中心与样本之间的欧式距离来判断样本间的相似程度,通过不断迭代将所有样本划分为k簇,且各簇的中心(聚类中心)为该簇包含所有样本的均值。
在同一时段内,若不同城市的累计确诊病例数变化呈现同增同减且增减幅度相似的特征,则认为这些城市的疫情扩散过程具有时间一致性。对属于同一种空间模式的所有城市,按照公式(6)计算城市i的累计确诊病例数变化曲线在p个时段的斜率sip,用以表征累计确诊病例数的增减和变化幅度,体现时间一致性。
式中:
3.3 疫情扩散的时空模式表征参数
图2
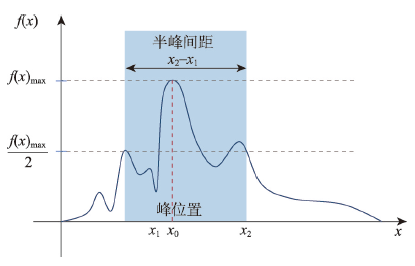
图2
半峰间距与峰位置示意图
Fig. 2
Schematic diagram of full width at half maximum and peak position
峰度和偏度分别表示样本分布相对于正态分布的陡缓程度和对称程度,计算公式分别为:
式中:n为样本xi数量;
若峰度K > 0,表明样本xi的分布比正态分布陡峭,呈现尖顶峰;反之则为平顶峰。尖顶峰代表疫情起伏较大且变化迅速,新增确诊病例数出现了激增的情况。该指标的意义类似于流行病学研究中常用的反香农熵指数(Inverse Shannon Entropy),其值较大时说明新增病例在短时间内集中出现。对于例如COVID-19的新型呼吸道传染病,新增确诊病例的激增可能对公共卫生系统造成压力[23,24]。平顶峰则表征疫情整体变化较为平稳。偏度S > 0为右偏分布,表示相比于正态分布,样本xi分布的峰值向左侧偏移,更多的样本集中分布在左侧;反之则为左偏分布。右偏分布表示新增确诊病例更多集中在疫情完整过程的前段,疫情得到有效控制。
4 疫情扩散的时空模式特征
4.1 时空模式判别结果
首先,从中国317个地级市(不包括湖北省和港澳台地区)中去除研究时段内累计确诊病例数未达到10例的城市,得到204个地级市作为研究样本。对所有样本进行等密度分组,每组包含3个样本,共得到68组样本。以武汉市为参照,将湖北省其余16个地级市的确诊病例数据带入公式(1)构建初始模型。然后,按照距武汉市直线距离由小到大的顺序依次加入分组样本,构建回归方程。当组内平均距离为588 km时,回归模型的R2达到最大值(图3)。根据3.2.1节的判别条件,可以认为COVID-19疫情从武汉市向外蔓延的有效边界为588 km。
图3
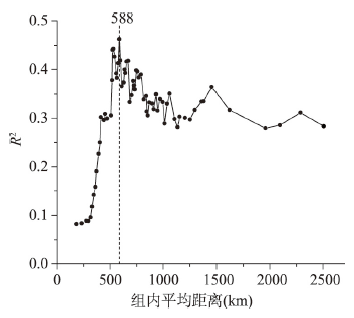
图3
疫情扩散空间模式判别模型的R2变化
Fig. 3
R2 variability in the discriminant model for the spatial pattern of epidemic spread
以蔓延有效边界为基准,对于边界以内的城市,通过对比其实际滞后时间与模型预测的滞后时间,判别蔓延型和近距离蛙跳型2种空间模式;对于边界以外的城市,仍然依据疫情扩散的滞后时间,按照3.2.1节的方法判别远距离蛙跳型和综合型2种空间模式。
其次,采用K-means聚类方法,设置类别数k = 3,基于时间过程一致性原则,将属于同一空间模式的所有城市进一步划分为典型类、普通类和异常类(图4),聚类结果的聚类中心为所有城市每日新增确诊病例数的均值。不同空间模式下的典型类呈现出该空间模式最为典型的疫情时间变化特征,能够反映与其他空间模式的显著差异;普通类呈现的是同一空间模式中多数城市具有的疫情时间变化特征;异常类则是个别城市因特殊原因而呈现出个性化的疫情时间变化特征。
图4
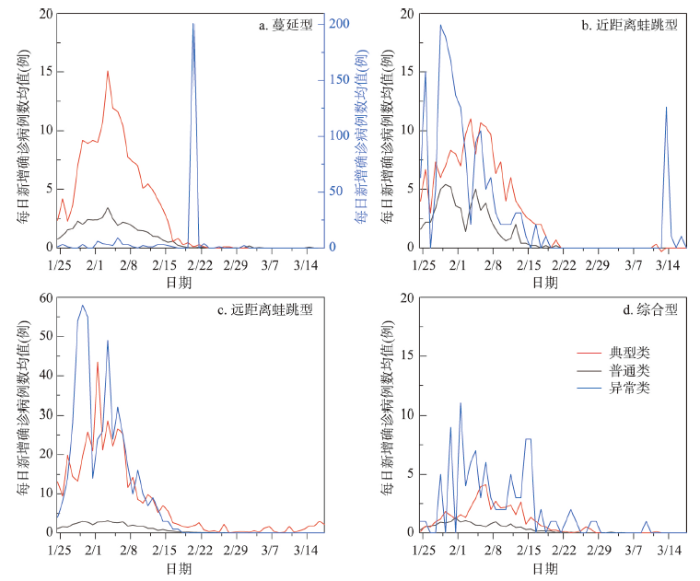
图4
2020年1月24日—3月18日中国COVID-19疫情扩散空间模式的时间过程曲线
Fig. 4
Time-course curve of the spatial pattern of epidemic spread in China
图5
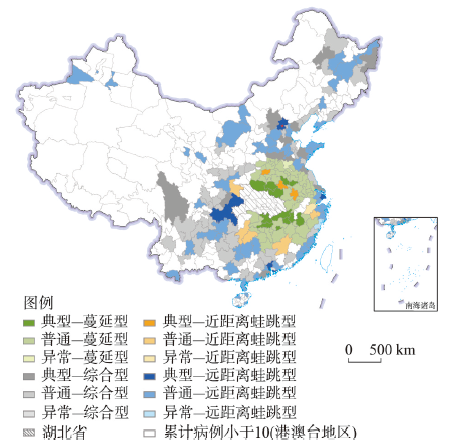
图5
2020年1月24日—3月18日中国COVID-19疫情扩散的时空模式空间分布
注:基于自然资源部标准地图服务网站GS(2019)1827号标准地图绘制,底图边界无修改。
Fig. 5
Spatial distribution of the spatio-temporal patterns of the epidemic spread in China
最后,基于疫情扩散的时空模式结果,为探究累计确诊病例数的空间分异性,以每日累计病例数为因变量,以疫情扩散的时空模式为自变量,利用地理探测器[27]计算q值随时间的变化。q值均显著且随时间推移呈上升趋势的结果表明,确诊病例的空间分异性逐渐明显,疫情扩散的时空模式对各地确诊病例的解释力增强,两者的空间分布具有高度相似性,扩散规律的空间分异性显著。
4.2 时空模式结果分析
(1)63个城市属于蔓延型,主要位于黄河以南且集中连片分布于湖北省外围的东北和东南方向,平均滞后时间为10 d。其中,相较于普通—蔓延型,南阳市、长沙市、南昌市等11个典型—蔓延型城市处于距湖北省更临近的地区,每日新增确诊病例数在初期逐渐递增,2月5日到达峰值15例,其后持续减少。51个普通—蔓延型城市的时间变化过程比典型—蔓延型和异常—蔓延型更平稳,每日新增确诊病例数稳定在5例以内,且最早实现新增确诊病例数清零。山东省济宁市为异常—蔓延型,受任城监狱事件的影响[28],2月20日新增确诊病例数骤增约200例。
(2)郑州市、合肥市等9个城市属于近距离蛙跳型,零散分布在湖北省周边地区。由于这些城市与武汉市或湖北省其它城市有便捷的交通联系和密切的人口流动,疫情扩散时间小于蔓延型扩散所需的时间,平均滞后时间为6 d。其疫情时间变化主要表现为:每日新增确诊病例数在前期显著上升,中期回落且后期保持在较低水平。其中,典型—近距离蛙跳型城市有3个,分布于湖北省的东北方向;普通—近距离蛙跳型城市有5个,位于湖北省的西南方向,这两类城市的每日新增确诊病例数在波动下降后均没有出现反弹,主要区别是绝对数量的差异。浙江省杭州市为异常—近距离蛙跳型,表现为新增确诊病例的绝对数量和波动均较大,并且由于核减病例调整[29],3月14日出现一个峰值。
(3)64个城市属于远距离蛙跳型,分布于全国各地,平均滞后时间为8 d。其中典型—远距离蛙跳型为北京、上海、广州、深圳和重庆5个超大城市,确诊病例数最多,增减波动不断反复,且一直持续至后期;普通—远距离蛙跳型有58个城市,多为各地的重要节点城市,每日新增确诊病例数保持在较低水平,疫情变化较为平稳。温州市为异常—远距离蛙跳型,由于疫情暴发初期从武汉返程的人口基数过大而导致确诊病例数激增[30]。
(4)69个城市属于综合型,主要是分布在大城市周边的中小城市,如北京市和天津市周边的廊坊市、唐山市,哈尔滨市周边的大庆市、齐齐哈尔市,成都市周边的绵阳市、内江市等城市,其疫情源于邻近大城市的二次蔓延,平均滞后时间为16 d。综合型城市的疫情时间变化表现为新增确诊病例数较少,但清零较晚。其中,52个普通—综合型城市每日新增确诊病例数最少且变化平稳,16个典型—综合型城市则更多临近重要的蛙跳节点,确诊病例数相对较多,前期有明显峰值,后期也有小幅起伏波动。东莞市为异常—综合型城市,人口流动较大,导致其疫情持续时间长、起伏多。
进一步采用3.3节的方法计算不同时空模式的峰位置、半峰间距、峰度、偏度4个参数(表1)。对于蔓延型空间模式,除异常—蔓延型城市以外,典型—蔓延型城市与普通—蔓延型城市的峰位置一致,均为2020年2月3日,但普通—蔓延型城市的半峰间距要比典型—蔓延型城市更长,并且呈现平顶峰的曲线形态,表明普通—蔓延型城市的疫情扩散虽然持续时间较长,但变化较为平稳。济宁市由于病例数单日激增而呈现半峰间距最小、峰度值最高为53.51的特征。
表1 中国COVID-19疫情扩散时空模式的时间变化曲线特征指标
Tab. 1
| 疫情扩散的时空模式(城市个数) | 峰位置 | 半峰间距(d) | 峰度 | 偏度 |
|---|---|---|---|---|
| 典型—蔓延型(11) | 2020/2/3 | 10.25 | 0.19 | 1.16 |
| 普通—蔓延型(51) | 2020/2/3 | 12.25 | -0.46 | 0.94 |
| 异常—蔓延型(1) | 2020/2/20 | 1.00 | 53.51 | 7.30 |
| 典型—近距离蛙跳型(3) | 2020/2/3 | 17.69 | -0.74 | 0.86 |
| 普通—近距离蛙跳型(5) | 2020/1/29 | 11.37 | 0.67 | 1.39 |
| 异常—近距离蛙跳型(1) | 2020/1/28 | 48.84 | 1.85 | 1.71 |
| 典型—远距离蛙跳型(5) | 2020/2/1 | 7.93 | 2.18 | 1.56 |
| 普通—远距离蛙跳型(58) | 2020/2/3 | 16.28 | -0.84 | 0.86 |
| 异常—远距离蛙跳型(1) | 2020/1/29 | 9.39 | 3.16 | 1.96 |
| 典型—综合型(16) | 2020/2/6 | 10.44 | 1.20 | 1.35 |
| 普通—综合型(52) | 2020/1/31 | 15.78 | -0.59 | 0.85 |
| 异常—综合型(1) | 2020/2/1 | 16.70 | 2.21 | 1.70 |
对于近距离蛙跳型空间模式,整体峰位置早于蔓延型城市,且半峰间距更短,表明疫情扩散更快且持续时间短。杭州市由于核减病例调整而导致后期出现峰值,进而使其半峰间距最大,约为49 d。对于远距离蛙跳型空间模式,普通—远距离蛙跳型城市的峰位置与普通—蔓延型城市相同,但半峰间距更长,且峰度为负数,表明疫情持续时间更长且发展较平缓。此外,典型—远距离蛙跳型城市的半峰间距显著小于普通—远距离蛙跳型城市,且峰度为正,偏度更大,表现出疫情集中暴发且多出现于前期的特征。
对于综合型空间模式,普通—综合型城市表现出半峰间距较大、峰度和偏度均较小、且峰度值为负的特征,表明这些城市的疫情整体持续时间较长,但变化较为平稳。东莞市前期和中期的疫情在较高水平上波动,致使其半峰间距最大约为17 d,疫情更为严重。
如果不考虑所有异常类城市,综合不同空间模式下的时间过程一致性差异可以看出,各类城市的疫情变化曲线大多在2020年2月3日呈现峰值,其中,普通—近距离蛙跳型和普通—综合型的城市分别在2020年1月29日和1月31日呈现峰值,相对早于其他类城市。所有普通类城市的半峰间距介于11.37~16.28 d,平均值约为14 d,与COVID-19病毒的潜伏期一致。另外,根据各类城市疫情变化曲线的峰度和偏度统计结果可知,除了近距离蛙跳型以外,其余3种空间模式的普通类城市均为负的峰度,而典型类城市均为正的峰度,呈现出不同的时间变化过程。无论哪种空间模式,所有类型城市的偏度均为正值,表现出新增确诊病例总体分布偏向左侧,即小于均值的新增确诊病例居多的特征。
5 疫情扩散时空模式的影响因素
考虑不同城市之间的交通联系与人口流动,进一步针对疫情扩散时空模式的判别结果,本文采用多元Logistic回归模型探讨时空模式的关键影响因素,为不同城市采取有效措施阻断疫情扩散提供依据。
5.1 多元Logistic回归模型
多元Logistic回归(Logistic Regression)模型是一种概率型非线性回归模型,具有探索多分类因变量影响因素的优势,能够分析两类以上分类变量与自变量之间的回归关系。对于两类别以上的因变量y,假设取前j个类别的累积概率pj满足:
进一步对累计概率pj进行logit变化,得到线性表达形式为:
式中:βjk表示第j个类别中第k个解释变量的回归系数,可采用最大似然法(Maximum Likelihood Method)进行估计,即在对数似然函数L最大化的条件下求回归系数。对数似然函数表示为:
多元Logistic回归模型可以理解为多个二元Logistic回归模型,分别描述各类别与参考类别相比时不同因素的贡献程度。与线性回归模型相同,多元Logistic回归模型的回归系数表达的是解释变量对因变量的作用大小,即:在其他变量不变的条件下,解释变量XK每改变一个单位时,因变量y取前j个类别的累积概率对数值log it(pj)对应的变化量。回归系数大于0表示相对于参考类别,解释变量X值的增加与类别j的出现呈现正相关关系,系数越大,该变量的贡献越大;反之,解释变量X值的增加与类别j的出现为负相关,系数越大,该变量的贡献越大。
在模型构建时,以疫情扩散的空间模式作为多元Logistic回归模型的因变量,分别定义蔓延型为1,近距离蛙跳型为2,远距离蛙跳型为3,综合型为4。同时,考虑到对于一种具有“人传人”特点、人群普遍易感的流行病,不同地区之间的人员流动,尤其是来自武汉市的人员输入是影响疫情扩散的重要因素[31,32],因而在选取解释变量时,侧重不同城市与武汉市的关联对于疫情扩散时空模式的影响。交通是人员流动的载体,也是疫情扩散的重要途径;人口迁移量的多少与病例数量密切相关;城市间的关联程度一定程度上能够反映人口流动的偏好性,因此,以是否与武汉市通航、在武汉市封城前一周从武汉市迁出的人口数量、与武汉市的关联度作为解释变量。
通航状况为二分变量,与武汉市之间有直飞航班表示为1,没有则表示为0。迁出人口数量采用2020年1月17日—1月24日期间由武汉市前往各城市的人口流动量均值,考虑到疫情暴发时间临近春节,可能存在春运对人口流动的影响,本文对人口迁移数据进行了Min-Max标准化,以削减人员流动绝对量对于影响因素分析结果的影响。城市间的关联度借鉴常用的引力模型,用2个城市的人口规模以及二者间的直线距离刻画,在反映地理邻近关系的同时也兼顾地理单元的人口规模,具体计算公式如下:
式中:Biw为人口关联度;Pi和Pw分别为i城市与武汉市的人口数;diw为i城市与武汉市之间的直线距离。
根据图5可知,中国地势二级和三级阶梯上大部分城市的累计确诊病例总数未达到10例,没有被包括在疫情扩散时空模式分析中,因而暂不考虑自然地理因素的影响。
5.2 多元Logistic回归结果
本文将4种时空模式分别作为回归模型的因变量,并以其他时空模式作为参考类型,得到不同情景下解释变量的影响方向及强度(表2)。如果标准化系数为正,表示解释变量对因变量的影响相比参考类型是正向的,反之则表示负向影响;标准化系数的绝对值表示影响强度的大小。
表2 中国疫情扩散时空模式的Logistic回归结果
Tab. 2
| 因变量 | 蔓延型 | 蔓延型 | 蔓延型 | 近距离蛙跳型 | 近距离蛙跳型 | 远距离蛙跳型 |
|---|---|---|---|---|---|---|
| 参考类型 | 近距离蛙跳型 | 远距离蛙跳型 | 综合型 | 远距离蛙跳型 | 综合型 | 综合型 |
| 解释变量 | 标准化系数β | |||||
| 是否通航 | -2.593*** | -4.062*** | -2.714*** | -1.468 | -0.121 | 1.348*** |
| 人口关联度 | 0.474 | 40.572*** | 30.385*** | 40.098*** | 29.911*** | -10.187 |
| 迁出人口数量 | 3.742 | -17.544* | 88.387*** | -21.286** | 84.645*** | 105.931*** |
注:***表示在0.01水平上显著,**表示在0.05水平上显著,*表示在0.1水平上显著。
首先,与武汉市的通航状况对近距离蛙跳型和远距离蛙跳型空间模式具有正向影响,特别是对于远距离蛙跳型,相比其余两种空间模式,是否通航均在0.01水平上呈现显著正相关,表明与武汉市之间的便捷交通会突破地理距离的限制而加快疫情扩散,从而导致蛙跳型城市的出现。其次,与武汉市的人口关联度对蔓延型和近距离蛙跳型空间模式起正向作用,说明人口规模大且与武汉市距离近的城市,更容易受邻近作用或人口流动影响而成为疫情的扩散地。迁出人口数量对于蛙跳型空间模式同样存在显著作用,进一步表明武汉市封城前一周内的人口流动是蛙跳型疫情扩散的重要影响因素。对于综合型城市,由于其疫情扩散的时空特征受到初级和次级疫情暴发地的双重影响,空间模式的形成受3种解释变量的作用方向与强度并不具有明确和显著的解释力。
Logistic模型的回归结果为进一步探讨不同疫情扩散时空模式下的城市防疫对策提供了依据。首先,蔓延型城市与武汉市较高的人口关联度是疫情扩散最主要的影响因素,由于空间位置邻近武汉市,两地之间的人员往来可能借助多种交通方式(如公路、铁路等),使得疫情扩散过程更为复杂、更加快速,给疫情防控带来很大难度。因此,第一时间切断与疫情暴发地的各种关联途径是蔓延型城市应对疫情扩散的首要任务。其次,蛙跳型城市与武汉市之间较高的交通可达性突破了地理距离的制约,使得疫情快速扩散至蔓延型有效边界以外;而且从疫情暴发地迁出的人口数量对于蛙跳型城市,特别是远距离蛙跳型城市的影响较为显著。因此,高度强化机场等交通枢纽的疫情监控,严格限制航空交通方式带来的大量且快速的人口流动是蛙跳型城市防止疫情扩散的重点工作。最后,虽然综合型城市与疫情暴发地之间的影响关系尚不明确,但考虑到这些城市距离蛙跳型城市、特别是远距离蛙跳型城市较近的特点,控制与周边蛙跳型城市的人口流动是这类城市防范疫情扩散的有效策略。
6 结论与讨论
针对2020年1月24日—3月18日期间中国COVID-19疫情从快速扩散到逐步控制的完整过程,以每日新增确诊病例数据为基础,以317个地级城市为对象,建立了疫情扩散空间模式判别模型。进一步依据不同空间模式的时间变化曲线解析其时间过程一致性特征,并从交通可达性、城市关联程度和人口流动等方面构建多元Logistic回归模型,揭示影响COVID-19疫情扩散模式的关键因素,主要结论为:
(1)距武汉市直线距离588 km是判别疫情扩散4种空间模式的有效边界,在同一空间模式下进一步区分时间过程的典型类、普通类和异常类,得到13种类型的疫情扩散时空模式。蔓延型城市集中在湖北省外围的东北和东南区域;近距离蛙跳型城市相对较少,零星分布在蔓延型城市之间;远距离蛙跳型以省会城市和大城市为主;综合型为远距离蛙跳型城市周边的中小城市。
(2)COVID-19疫情扩散时空模式的基本特征为:远距离蛙跳型的每日新增确诊病例绝对量最大,其次为近距离蛙跳型。除了数量较少的近距离蛙跳型以外,其余3种空间模式下的疫情扩散具有明显的时间过程差异。各种时空模式下的新增确诊病例峰值大多出现在2020年2月3日,且总体分布呈现偏向左侧的特征,即新增确诊病例多集中在研究时段的前期。所有普通类城市的半峰间距平均值约为14 d,与COVID-19病毒的潜伏期一致。
(3)COVID-19疫情扩散的时空模式与不同的影响因素相关联。与武汉市的通航状况对蛙跳型、特别是远距离蛙跳型空间模式具有正向影响,使得疫情快速扩散至蔓延型有效边界以外;与武汉市的人口关联度对蔓延型和近距离蛙跳型空间模式有正向作用,是疫情扩散最主要的影响因素;迁出人口数量对于近距离和远距离蛙跳型空间模式均有显著作用;综合型空间模式受初级和次级疫情暴发地的双重影响。
根据本文的研究结果可以认为,各城市有必要在疫情扩散的不同阶段,从自身与疫情暴发地以及周边毗邻城市的关联着手,实时研判疫情扩散时空模式,据此制定科学而有效的疫情防范和管控策略。事实上,中国抗击COVID-19疫情取得显著成效就是对于本文研究结论的有力印证,如2020年1月23日采取的武汉市“封城”措施,从根本上阻断了疫情从暴发地继续向外扩散的路径。随着疫情形势出现积极变化,国务院联防联控机制在2020年2月17日印发《关于科学防治精准施策分区分级做好新冠肺炎疫情防控工作的指导意见》,提出突出重点、统筹兼顾、分类指导、分区施策的要求,低、中、高风险地区应采取不同的疫情防范策略;交通运输部2020年3月1日发布《关于分区分级科学做好客运场站和交通运输工具新冠肺炎疫情防控工作的通知》,明确了交通工具对于疫情传播风险的重大影响,要求分区分级差异化施策。在目前全球疫情防控态势多变且趋向持久化的形势下,有必要继续发挥地理学时空分析的优势,深入研究不同地理单元疫情扩散的时空特征与影响因素,为完善常态化疫情防控体制机制、提升疫情监测与预警能力提供依据。
参考文献
Research progress on the infection mechanism of coronavirus SARS-CoV-2
新冠病毒SARS-CoV-2的感染机制研究进展
Isolation, identification of the first SARS-CoV-2 strain from a COVID-19 case infected in Guangzhou
第1株广州本地感染COVID-19病例的新型冠状病毒的分离鉴定
Reflection and exploration on rehabilitation treatment of COVID-19 patients with traditional Chinese medicine
中医药在新冠肺炎康复治疗应用中的思考与探索
An investigation of transmission control measures during the first 50 days of the COVID-19 epidemic in China
DOI:10.1126/science.abb6105 URL [本文引用: 1]
A systematic approach is needed to contain COVID-19 globally
DOI:10.1016/j.scib.2020.03.024 URL [本文引用: 1]
Modified SEIR and AI prediction of the epidemics trend of COVID-19 in China under public health interventions
DOI:10.21037/jtd URL [本文引用: 1]
Analysis of an SEIRS epidemic model with two delays
A disease transmission model of SEIRS type with exponential demographic structure is formulated. All newborns are assumed susceptible, there is a natural death rate constant, and an excess death rate constant for infective individuals. Latent and immune periods are assumed to be constants, and the force of infection is assumed to be of the standard form, namely proportional to I(t)/N(t) where N(t) is the total (variable) population size and I(t) is the size of the infective population. The model consists of a set of integro-differential equations. Stability of the disease free proportion equilibrium, and existence, uniqueness, and stability of an endemic proportion equilibrium, are investigated. The stability results are stated in terms of a key threshold parameter. More detailed analyses are given for two cases, the SEIS model (with no immune period), and the SIRS model (with no latent period). Several threshold parameters quantify the two ways that the disease can be controlled, by forcing the number or the proportion of infectives to zero.
A SEIQR model for pandemic influenza and its parameter identification
Phase-adjusted estimation of the number of Coronavirus Disease 2019 cases in Wuhan, China
Nowcasting and forecasting the potential domestic and international spread of the 2019-nCoV outbreak originating in Wuhan, China: A modelling study
DOI:10.1016/S0140-6736(20)30260-9 URL [本文引用: 1]
Spatially explicit modeling of 2019-nCoV epidemic trend based on mobile phone data in mainland of China
The inflection point about COVID-19 may have passed
DOI:10.1016/j.scib.2020.02.025 URL [本文引用: 1]
The impacts of COVID-19 pandemic on the development of economic globalization
DOI:10.11821/dlyj020200514
[本文引用: 1]

The COVID-19 pandemic is considered the biggest crisis confronted with the world after the Second World War, which has brought huge impacts on people’s health and daily life, economic growth and employment as well as national and international governance. Increasing pessimism is buzzing among scholars, critics, entrepreneurs, the mass and even government officials, and views like the end of economic globalization, large-scale spatial restructuring of global supply chains and fundamental change of the world economic governance structure are becoming prevailing on the media. This paper tries to address the issue of the development trend of economic globalization in the post-pandemic era by developing a framework of globalization’s Triangle Structure to understand its dynamics in addition to a summary of the on-going impacts of the COVID-19 pandemic. We argue that the spatial fix of capital accumulation, time-space compression led by technological advance and openness of nations are the three major drivers of economic globalization, and the changes and interactions of these three drivers decide the development trend of economic globalization. From such a dynamic viewpoint, economic globalization is an ever-changing integration process without an end but constant fluctuations. The cost of decoupling of nations from globalization would be very huge because they have been highly integrated by global production networks and trade networks and no nation can afford a complete decoupling. The so-called de-globalization phenomena are just short-term adjusting strategies of nations to cope with power reconfigurations brought by economic globalization. The pandemic will have little impacts, or probably nothing, on the spatial fix of capital accumulation and time-space compression led by technological advance, but may temporarily influence some nations' openness. If the pandemic does not last long, economic globalization will resume from the shock soon after the world goes back to normal, and develop and restructure according to its own dynamics. Thus, we tend to believe the pandemic at most slams the brake of globalization and would not be able to put it into reverse. Economic globalization will not stop or reverse, but develop towards a more inclusive stage.
新冠肺炎疫情对经济全球化的影响分析
The impacts of COVID-19 on the connectivity of China's international air transport network and the spatial differences
新冠疫情对中国国际航空网络连通性的影响及空间差异
Spatial relationship between epidemic spread and population outflow of the corona virus disease 2019 (COVID-19) that impacted Chinese urban public health classification
新冠肺炎疫情扩散与人口流动的空间关系及对中国城市公共卫生分类治理启示
Population flow drives spatio-temporal distribution of COVID-19 in China
DOI:10.1038/s41586-020-2284-y URL [本文引用: 1]
Multi-level spatial distribution estimation model of the inter-regional migrant population using multi-source spatio-temporal big data: A case study of migrants from Wuhan during the spread of COVID-19
基于多源时空大数据的区际迁徙人群多层次空间分布估算模型: 以COVID-19疫情期间自武汉迁出人群为例
COVID-19 risk assessment driven by urban spatiotemporal big data: A case study of Guangdong-Hong Kong-Macao Greater Bay Area
城市时空大数据驱动的新型冠状病毒传播风险评估: 以粤港澳大湾区为例
The development of COVID-19 in China: Spatial diffusion and geographical pattern
DOI:10.11821/dlyj020200329
[本文引用: 1]
The study of the spatial diffusion and geographical mode of COVID-19 is of great significance for the rational allocation of health resources, the management and response of public health emergencies, and the improvement of public health system in the future. Based on multiple spatio-temporal scale, this paper studied the spatial spreading process of COVID-19 between cities and its evolution characteristics in China, and then explored its influencing factors. The results are shown in the following: the inter-city spreading process of COVID-19 in China mainly experienced six stages, namely, stage I: diffusion in Wuhan, stage II: rapid multi-point diffusion in space, stage III: rapid increase of confirmed cases, stage IV : gradual decrease of new confirmed cases, stage V: the epidemic under control, and stage VI: cases imported from overseas. In the context of globalization and open regional system, the social and economic development of regions are closely related to each other. With the development of fast and convenient high-speed railway network, the spatial characteristic of population migration shows a cross-regional and hierarchical pattern, and forms a certain spatial cascade structure along the transport corridor. Accordingly, the spatial spread of COVID-19 mainly showsthe characteristics of adjacent diffusion, relocation diffusion, hierarchical diffusion, and corridor diffusion. The study found that geographical proximity, population migration and population size, traffic network, epidemic prevention and control measures have significant influence on the spatial diffusion process of COVID-19. Among different modes of transportation, airplanes play agreater role than others in the early stage of the epidemic. In addition, the population flow during the Spring Festival had a certain impact on the spread of the epidemic. In conclusion, to some extent, the spatial spread process and pattern of COVID-19 epidemic reflects the spatial organization pattern of social and economic activities under the "space of flows" network, which is closely related to the geographical proximity, the social and economic linkages between regions, and the spatial an temporal patterns of human activities. From the perspective of geography, this paper analyzed the inter-city spread pattern of COVID-19 epidemic and provided some implications for prevention and control measures against the epidemic in other countries, and also offered some suggestions for China to deal with public health emergency risks in the future.
新冠肺炎疫情的空间扩散过程与模式研究
An analysis of spatial structure and optimal regional development
DOI:10.11821/xb200102001
[本文引用: 1]
This paper is a further analysis of the “Pole Axis Theory” and related “T shaped” spatial structure of the industrial allocation in China, which was developed by the author a decade ago. It starts with an analysis of the relationship between different types of spatial structure and regional development, and of how to achieve optimal regional development through optimal spatial organization as well. Then, based upon existing theories and practices in China, it discusses the formation of the “pole & axis” system by disclosing the evolution of socio economic organization and demonstrates that such a system is the most efficient spatial structure that can lead to optimal regional/national development. Lastly, the paper concludes that the strategy of a “T shaped” spatial structure of industrial allocation, which is an application of the “Pole Axis Theory”, has played a very important role in the spatial economic development in China in the last decade.
论区域的最佳结构与最佳发展: 提出“点—轴系统”和“T”型结构以来的回顾与再分析
A method characterizing urban expansion based on land cover map at 30 m resolution
DOI:10.1360/N072015-00284 URL [本文引用: 1]
基于30m地表覆盖数据的城市扩张测度方法
Crowding and the shape of COVID-19 epidemics
DOI:10.1038/s41591-020-1104-0 URL [本文引用: 1]
Urbanization and humidity shape the intensity of influenza epidemics in US cities
DOI:10.1126/science.aat6030 URL [本文引用: 1]
Epidemiological features of the 2019 novel coronavirus outbreak in China
DOI:10.2174/1568026620999200511094117
PMID:32394842
[本文引用: 1]
The fast-growing outbreak of the 2019 novel coronavirus (2019-nCoV), which originated from Wuhan locating in central China at the end of 2019, spread to multiple cities in merely a month. Although the mortality of this disease was lower than that of SARS, the incredible contagiousness was much higher than SRAS-CoV. Because of the tremendous clout of 2019-nCoV, it is essential to hold more details about it and monitor its future evolution. This mini review consequently summarizes the key elements of epidemiology features, providing updated relevant findings and novel insights related to 2019-nCoV.Copyright© Bentham Science Publishers; For any queries, please email at epub@benthamscience.net.
Geodetector: Principle and prospective
DOI:10.11821/dlxb201701010
[本文引用: 1]
Spatial stratified heterogeneity is the spatial expression of natural and socio-economic process, which is an important approach for human to recognize nature since Aristotle. Geodetector is a new statistical method to detect spatial stratified heterogeneity and reveal the driving factors behind it. This method with no linear hypothesis has elegant form and definite physical meaning. Here is the basic idea behind Geodetector: assuming that the study area is divided into several subareas. The study area is characterized by spatial stratified heterogeneity if the sum of the variance of subareas is less than the regional total variance; and if the spatial distribution of the two variables tends to be consistent, there is statistical correlation between them. Q-statistic in Geodetector has already been applied in many fields of natural and social sciences which can be used to measure spatial stratified heterogeneity, detect explanatory factors and analyze the interactive relationship between variables. In this paper, the authors will illustrate the principle of Geodetector and summarize the characteristics and applications in order to facilitate the using of Geodetector and help readers to recognize, mine and utilize spatial stratified heterogeneity.
地理探测器: 原理与展望
Spatio-temporal analysis of COVID-19 epidemic risk in Guangdong Province based on population migration
DOI:10.11821/dlxb202011018
[本文引用: 1]
Population migration, especially population input from epidemic area, is a key source of the risk related to the COVID-19 epidemic. Taking Guangdong Province as an example, this paper utilizes big data on population migration and the geospatial analysis technique to develop a model to conduct spatiotemporal analysis of COVID-19 risk. The model considers the risk differences among the source cities of population migration as well as the heterogeneity in the socioeconomic characteristics of the destination cities. It further incorporates a time-lag process based on the time distribution of the onset of the imported cases. The model can predict the evolutional trend and spatial distribution of the COVID-19 risk for a certain time period in the future and support the future planning and targeted prevention measures. The research findings indicate that: (1) The COVID-19 epidemic in Guangdong reached a inflection point on January 29, 2020, and then it showed a gradual decline. (2) Based on the time-lag analysis of the onset of the imported cases, there is a time interval between the case importation and the illness onset, and the cases with an interval of 1-14 days account for a high proportion. (3) There are obvious spatial differences in the risk of epidemics, based on their imported risk, susceptibility risk, and risk resisting ability. (4) The connection and the scale of population migration as well as the transportation and location factors of the cities in Guangdong's prefecture-level cities and the source regions of the epidemic, all have significant impacts on the risk classification of the cities in the province. The first-tier cities such as Shenzhen and Guangzhou are the high-risk areas. The cities in the Pearl River Delta that are adjacent to Shenzhen and Guangzhou, including Dongguan, Foshan, Huizhou, Zhuhai and Zhongshan, are the medium-risk cities. The eastern, northern, and western parts of Guangdong, which are outside the metropolitan areas of the Pearl River Delta, are classed into low-risk areas. Therefore, the government should take targeted prevention and control measures in different regions based on local conditions and risk classification so as to ensure people's daily life and wellbeing to the greatest possible extent.
基于人口流动的广东省COVID-19疫情风险时空分析
The short-term impact of COVID-19 epidemic on the migration of Chinese urban population and the evaluation of Chinese urban resilience
COVID-19疫情对中国城市人口迁徙的短期影响及城市恢复力评价
