

1 引言
从不同空间尺度考察国内人口迁移的时空特征及其演变机理,是科学认知国内人口迁移规律的重要视角。过往对中国国内人口迁移时空变化特征的研究侧重在省级尺度开展,而对更细致的城市尺度的研究则相对匮乏。从地(市)级尺度,透视人口迁移的时空变化特征,有助于认知跨省地(市)间和省内地(市)间人口迁移时空规律,将为制定区域均衡发展和新型城镇化政策提供科学依据。
国内外人口流迁时空变化特征的研究工作主要集中在4个方面:① 国内学者利用多期人口普查数据,探讨1978年改革开放以来人口省际迁移流动的规模、方向、模式,发现1978年以来中国人口迁移规模和强度经历了迅速上升、趋于稳定和有所下降等发展阶段[1,2];由中西部内陆地区向东部沿海地区、经济落后地区向经济较发达地区、农村向城镇的人口迁移流宏观区域模式在基本成型的同时,也在发生一定的变动[3]。表现为:人口迁移的重心逐渐北移[4];跨省流迁人口所占比重快速增长后回调,而省内流迁人口的地位明显上升[5,6];迁移模式由早期形成的“六大基本迁移圈和两大迁移副圈”向沿海和西部内陆的“多极化吸引中心”转变,迁移流向沿海发达经济区或中西部省会的大、中城市、尤其是百万人以上城市集聚等[7,8,9]。② 人口迁移模型不断完善。基于重力模型,利用流入地、流出地的人口分布数据,模拟城际或地(市)间人口迁移流动特征,成为相关研究的常用手段[10];利用空间滤波网络自相关模型,模拟了美国人口迁移流[11];Simini等2012年指出重力模型的缺陷,同时提出了对人口迁移流拟合效果更优的“辐射模型”[12],Li等运用“辐射模型”模拟了中国地(市)间人口迁移流[13];Abel等2014年提出了利用国际移民存量变化估测国际人口迁移流的定量方法。该算法的核心是基于估算时点的存量数据来推算该时点的人口迁移流量,其优势是可进行趋势外推,且不同时期的计算结果具有可比性[14]。③ 利用社交媒体、移动定位等“大数据”,刻画短时段、精细化的人口迁移流动时空特征及城镇化格局。这些新型数据源以其本身所蕴含的丰富时空行为信息,有效地弥补了传统普查、抽样数据在精细化、时效性方面的不足[15,16]。④ 微观尺度的流动人口研究不断深化。运用抽样调查获取流迁人口的微观数据,学者深入、细致地剖析了流迁过程中个体和家庭的就业、流动、居住等行为或意愿特征及影响因素,极大丰富了对不同类型流迁人口多样化行为特征与流迁模式的认知[17,18,19]。
虽然近期已有研究开始从不同视角对地(市)间人口迁移进行检视,但利用辐射模型的研究受方法本身的限制,尚无法实现不同时期的对比和趋势外推;新型大数据源则因其样本被“截断”、有偏性等固有缺陷,可能引发结论的不确定性。基于微观尺度的个体研究由于案例地有限,无法达到在全国宏观层面上全面审视和把握人口迁移时空规律的目的。随着中国全面步入城镇化中后期阶段,对地(市)间人口迁移的认识亟待深化,对其系统性研究亟需进一步加强。
本文拟基于1995—2000年5年间迁移的“地—地”起止点(Origin-Destination, O-D)迁移流以及2000—2005年、2005—2010年和2010—2015年“省—地”O-D迁移流数据,利用Abel提出的定量方法估算后3个时段的“地—地”O-D迁移流,并据此刻画1995—2015年中国人口迁移的时空变化特征,进一步探讨中国国内人口迁移的时空演变规律,丰富人口迁移流动理论,为中国实施新型城镇化规划和制定流动人口市民化政策提供科学依据。
2 数据与方法
2.1 数据获取与处理
在第五次和第六次全国人口普查中,迁移项目被设置于长表,相关信息来源于10%的抽样调查数据。国务院人口普查办公室、国家统计局人口和社会科技统计司从该数据中随机抽样1%,生成了1‰数据光盘(以下简称“1‰数据”)[8],本文对普查和小普查年份其5年间迁移人口(即数据汇总中“全国按现住地和五年前常住地分的人口”)的特征、格局和结构等的研究均利用了“1‰数据”,并在处理迁移总量和流量时将“1‰数据”放大了1000倍。根据分析需要,本文从“1‰数据”中获取的1995—2015年研究时段的5年间人口迁移数据包括:1995—2000年地(市)间的“地—地”O-D迁移流,以及2000—2005年、2005—2010年和2010—2015年“省—地”O-D迁移流。
在研究时段内,地(市)的空间范围、行政区划及行政代码经历了较大幅度的调整,为保持一致性,以2015年的地(市)行政区划代码为基准,对前期时段的行政单元进行了合并。在处理过程中,涉及到合并的地(市)分别为:吉林省的“通化市+白山市”,河北省的“石家庄市+保定市”,河南省的“平顶山市+许昌市+漯河市”,山西省的“长治市+晋城市”,甘肃省的“白银市+武威市+定西市”,宁夏回族自治区的“银川市+吴忠市+固原市+中卫市”,安徽省的“合肥市+巢湖市”“蚌埠市+宿州市”“阜阳市+亳州市”,湖北省的“武汉市+鄂州市+黄冈市”“黄石市+咸宁市”,湖南省的“邵阳市+娄底市”,江西省的“南昌市+宜春市”,广东省的“珠海市+佛山市+江门市+中山市”,海南省的“海口市+三亚市+儋州市+省直辖”。因本文不分析这些被合并的地(市)间的迁移流,故最终获得的1995—2015年内4个时期的地(市)间O-D迁移流数据均为320×320的矩阵。该数据剔除了市内跨县和县内跨乡镇街道、以及跨越被合并的地(市)的迁移流,为跨省和省内跨市5年间迁移的地(市)间O-D迁移流。需要指出的是这一迁移流数据暂未包括港澳台地区。
2.2 地(市)间人口迁移流的估算方法
Abel提出的人口迁移流的估算模型在国际人口迁移O-D流的估算中有明显优势[20]。本文选用Abel提出的人口迁移流的估算模型,计算人口普查年和小普查年之中5年间迁移的地(市)间O-D迁移流。该方法的原理是以1995—2000年“地—地”O-D迁移流作为基础数据之一,在分别给定2000—2005年、2005—2010年和2010—2015年“省—地”O-D迁移流等数据的前提下,通过构建一组泊松回归模型,采用迭代比例拟合算法(Iterative Proportional Fitting Procedure, IPFP),在R语言环境的“migest”程序包支持下,估算后3个时段“地—地”O-D迁移流数据[20,21]。具体公式如下:
式中:yij为待估矩阵中任一迁出地城市i与迁入地城市j的O-D迁移流(i ≠ j),基于极大似然估计得到最优解;αi和βj分别代表的是待估矩阵中迁出地i和迁入地j特征的背景信息,本文指代每个待估时期“省—地”O-D迁移流的相关参数,通过IPFP的不断迭代得到最优解;mij代表的是迁移流的辅助数据,用于将自身的交互结构施加于待估迁移流矩阵中。通常情况下,mij可以采用与待估迁移流具有相同行列数的过去时期O-D迁移流数据,或者迁入地与迁出地间的距离或出行成本数据等来表征[22],本文中特指1995—2000年“地—地”O-D迁移流矩阵。
上述原理可用图1示意。假设有两个省份为Province = (M, N),地(市)为Prefecture = (a, b, c, d),并且省份与地(市)满足关系M = (a, b)、N = (c, d)。在t时期a、b、c、d 4个地(市)间的O-D迁移流是已知的,而(t+5)时期则只知道省份M、N与地(市)a、b、c、d各自的O-D迁移流,运用泊松回归模型和迭代比例拟合算法,迭代获取α和β两个参数的最优解,并估算出(t+5)时期a、b、c、d 4个地(市)间的O-D迁移流数据。
图1
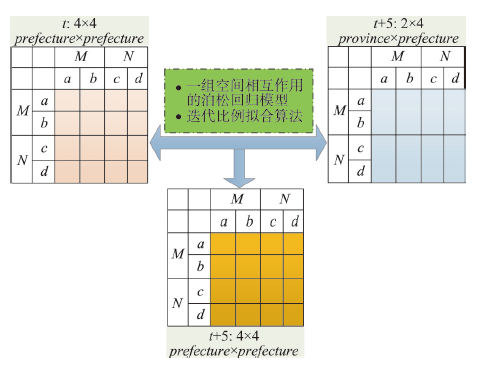
图1
中国地(市)间人口迁移流估算模型示意图
Fig. 1
Schematic illustration of the estimation model of migration among prefecture-level administrative units
2.3 地(市)间人口迁移特征分析指标及人口迁移地域类型的划分方法
表1 人口迁移特征指标
Tab. 1
| 具体指标 | 计算公式 | 含义 | |
|---|---|---|---|
| 全 国 层 面 的 指 标 | 全国总迁移量 | 度量人口在全国的总迁移数量,数值越大表示人口迁移规模越大。 | |
| 全国净迁移量 | 度量人口在全国的净迁移数量,数值越大表示净迁移规模越大。 | ||
| 全国总迁移系数 | 度量人口在全国的总迁移特性,数值越大表示总迁移强度越高。 | ||
| 全国净迁移系数 | 度量人口在全国的净迁移率,数值越大表示净迁移强度越高。 | ||
| 地(市)层 面 的 指 标 | 地(市)总迁移量 | 度量人口在各城市的总迁移数量,数值越大表示总迁移规模越大。 | |
| 地(市)净迁移量 | 度量人口在各城市的净迁移数量,数值越大表示净迁移规模越大。 | ||
| 地(市)总迁移系数 | 表征迁移的活跃程度,值越高迁移越活跃,反之则不活跃。 | ||
| 地(市)净迁移系数 | 表征迁移的源汇特征,正值为净迁入,负值为净迁出;正值越大,净迁入强度越高,反之则净迁出强度越高。 |
注:Oi和Ii分别为城市i的人口迁出和迁入规模;
表2 人口迁移的地域类型的划分方法
Tab. 2
| 地域类型 | 划分标准 |
|---|---|
| 非活跃型 | GRi < 1/10 |
| 平衡活跃型 | GRi ≥ 1/10,且-1/10 < NRi < 1/10 |
| 大规模净迁入活跃型 | GRi ≥ 1/10,且NRi ≥ 1/10,且Ii ≥ 50万 |
| 小规模净迁入活跃型 | GRi ≥ 1/10,且NRi ≥ 1/10,且Ii < 50万 |
| 大规模净迁出活跃型 | GRi ≥ 1/10,且NRi ≤ -1/10,且Oi ≥ 50万 |
| 小规模净迁出活跃型 | GRi ≥ 1/10,且NRi ≤ -1/10,且Oi < 50万 |
2.4 社区发现
式中:Q为模块度;m表示网络中所有边的权重之和;i和j为网络中任意两节点;Aij表示节点i和节点j之间边的权重;Ki或Kj分别表示所有与节点
3 人口迁移的总体特征及地域类型
3.1 人口迁移的总体特征
基于全国层面相关指标的分析结果表明,1995—2015年间全国尺度上地(市)间人口迁移规模和强度均呈现不断上升的态势(表3)。从全国总迁移量和全国净迁移量来看,二者分别从1995—2000年的1.04亿人和0.58亿人增长至2010—2015年的1.58亿人和0.91亿人,各增加了0.53倍和0.56倍,人口迁移规模上升明显。全国总迁移系数和全国净迁移系数均有不同程度提升。总迁移系数由1995—2000年的8.98%升至2010—2015年的12.46%;净迁移系数虽然在2010—2015年比2005—2010年稍微有所下降,但仍高于前两个时段的5.06%和5.66%。
表3 1995—2015年中国地(市)间人口迁移总体特征相关指标的测度结果
Tab. 3
| 指标/时段 | 1995—2000年 | 2000—2005年 | 2005—2010年 | 2010—2015年 |
|---|---|---|---|---|
| 全国层面的人口迁移指标 | ||||
| 全国总迁移量(万人) | 10387.8 | 11167.0 | 15240.4 | 15826.6 |
| 全国净迁移量(万人) | 5853.0 | 6879.8 | 9510.4 | 9136.0 |
| 全国总迁移系数(%) | 8.98 | 9.19 | 12.30 | 12.46 |
| 全国净迁移系数(%) | 5.06 | 5.66 | 7.68 | 7.19 |
| 地(市)层面人口迁移指标的变异系数 | ||||
| 地(市)总迁移量的变异系数 | 1.44 | 1.59 | 1.47 | 1.40 |
| 地(市)净迁移量的变异系数 | 2.19 | 2.15 | 2.02 | 1.95 |
| 地(市)总迁移系数的变异系数 | 3.48 | 1.81 | 1.15 | 0.92 |
| 地(市)净迁移系数的变异系数 | 5.44 | 2.74 | 1.82 | 1.46 |
为进一步刻画人口迁移的区域差异,本文分别测算了地(市)层面的总迁移量(Grossflow)、净迁移量(Netflow)、总迁移系数(GRi)和净迁移系数(NRi)等4个指标的变异系数。由表3可知,除了总迁移量的变异系数在中间时段有所上升外,净迁移量、总迁移系数和净迁移系数的变异系数都表现出随着时间演变数值减小的过程。这显示出虽然全国层面地(市)间人口迁移流的规模和强度在不断上升,但地区间迁入迁出的活跃程度、参与程度等的区域差异却随着时间推移在逐渐缩小。说明在持续推进城镇化进程中,中国地(市)间人口迁移无论是规模还是强度上,都并非只是局部性、少数地区的参与和提升,而是全域性、绝大多数地区参与和提升的时空过程。
3.2 人口迁移地域类型的时空变化特征
表4 1995—2015年中国人口迁移地域类型的统计结果
Tab. 4
| 地域类型 | 净迁入活跃型合计 | 其中:大规模净迁入活跃型 | 其中:小规模净迁入活跃型 | 净迁出活跃型合计 | 其中:大规模净迁出活跃型 | 其中:小规模净迁出活跃型 | 平衡活跃型合计 | 非活跃型合计 | |
|---|---|---|---|---|---|---|---|---|---|
| 数量占比(%) | 1995—2000年 | 5.63 | 3.13 | 2.50 | 0.63 | 0.00 | 0.63 | 17.81 | 75.94 |
| 2000—2005年 | 7.50 | 6.25 | 1.25 | 3.44 | 1.25 | 2.19 | 11.56 | 77.50 | |
| 2005—2010年 | 8.44 | 7.50 | 0.94 | 8.44 | 2.50 | 5.94 | 35.00 | 48.13 | |
| 2010—2015年 | 7.51 | 6.88 | 0.63 | 8.06 | 2.50 | 6.56 | 38.13 | 45.31 | |
| 迁入人口占比(%) | 1995—2000年 | 41.77 | 38.24 | 3.53 | 0.14 | 0.00 | 0.14 | 24.41 | 33.67 |
| 2000—2005年 | 58.57 | 57.78 | 0.79 | 0.56 | 0.33 | 0.23 | 12.25 | 28.62 | |
| 2005—2010年 | 61.05 | 60.42 | 0.63 | 1.55 | 0.56 | 0.99 | 21.47 | 15.94 | |
| 2010—2015年 | 55.11 | 54.86 | 0.25 | 1.39 | 0.56 | 0.83 | 26.27 | 17.23 | |
| 迁出人口占比(%) | 1995—2000年 | 4.05 | 3.33 | 0.72 | 1.20 | 0.00 | 1.20 | 20.61 | 74.14 |
| 2000—2005年 | 7.23 | 7.08 | 0.15 | 8.89 | 4.87 | 4.02 | 14.15 | 69.74 | |
| 2005—2010年 | 7.10 | 6.92 | 0.18 | 14.19 | 8.10 | 6.09 | 32.97 | 45.74 | |
| 2010—2015年 | 7.68 | 7.57 | 0.11 | 14.99 | 8.25 | 6.74 | 32.77 | 44.56 | |
图2
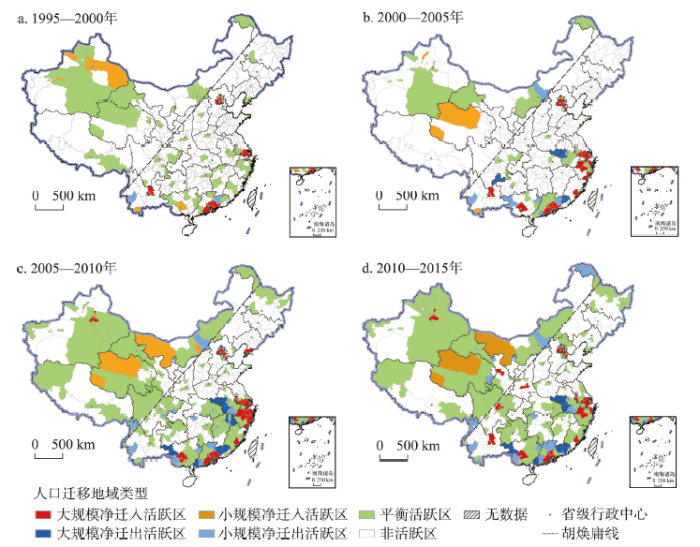
图2
1995—2015年中国人口迁移地域类型的空间格局
Fig. 2
Spatial patterns of regional types of migration in China from 1995 to 2015
3.2.1 人口迁移地域类型核心指标的变化特征 1995—2015年各类活跃型地(市)的核心指标均有不同程度的提升,而非活跃型地(市)在数量、迁出人口和迁入人口占比上均大幅下降(表4),进一步验证了全国层面地(市)间人口迁移活跃性的显著增强。
(1)净迁入活跃型地(市)以占比不到10%的空间单元集聚了全国50%以上的迁入人口,且大规模净迁入活跃型地(市)占绝对优势。在4个时段中,净迁入活跃型地(市)的数量占比先升后降,最高占比出现在2005—2010年间,占比为8.44%。4个时段中,此类地(市)的迁入人口占比依次为41.77%、58.57%、61.05%和55.11%。其中大规模净迁入活跃型地(市)的迁入人口在2000年以后的时段中占净迁入活跃型地(市)的比重更是高达99%以上,说明大规模净迁入活跃型地(市)在吸纳迁入人口中扮演了主导角色。
(2)净迁出活跃型地(市)数量占比和迁出人口占比呈上升趋势。净迁出活跃型地(市)数量占比由1995—2000年的0.63%波动上升至2010—2015年的8.06%,且小规模净迁出活跃型地(市)数量以6.56%的占比高于大规模净迁出活跃型地(市)的2.50%。迁出人口占比由1995—2000年的1.20%一路升至2010—2015年的14.99%,且大规模净迁出活跃型地(市)在后3个时段的迁出人口占比均高于小规模净迁出活跃型地(市)。昭示了人口迁出活跃性的增强。
(3)平衡活跃型地(市)在数量、迁入人口和迁出人口占比3项指标上均呈先降后升的变动特征。其中,3项指标的下降体现为2000—2005年比1995—2000年,各自有6.25个、12.16个和6.46个百分点的降幅。而自2000年以来,该类型地(市)的数量占比和迁出人口占比相较于迁入人口占比其上涨速度更快,分别由2000—2005年的11.56%和14.15%上升至2010—2015年的38.13%和32.77%,迁入人口则在对应时段由12.25%提升至26.27%。对比发现,该类型地(市)核心指标占比的增长更多源于非活跃型地(市)的下降,由此也显示了中国地(市)间人口迁移活跃性的提升。
(4)非活跃型地(市)大幅下降,但数量占比和迁出人口占比仍在45%左右。非活跃型地(市)在1995—2000年的数量占比、迁出人口和迁入人口占比分别达到75.94%、74.14%和33.67%,而到了2010—2015年,三者分别下降至45.31%、44.56%和17.23%,前两者占比仍达到接近全国一半的比例。这一特点或表明虽然中国人口迁移非活跃型地(市)已有大幅缩减,整体迁移规模和强度明显增强,但未来仍有较大提升空间。
3.2.2 人口迁移地域类型空间格局的变化特征 图2展现了中国人口迁移地域类型的时空演变过程,其总体上呈现出各种活跃型地(市)均不断扩散,而非活跃型地(市)则大幅缩减的动态特征。
(1)净迁入活跃型地(市)呈现出东部沿海主要城市群内部的“点块状”扩散与局部收缩,以及西部地区的“点灶状”扩散。东部沿海城市群大规模净迁入活跃型的“点块状”扩散最突出的当属长三角,1995—2000年仅有上海市辖区、苏州和无锡为大规模净迁入活跃型,而到了2005—2010年则已涵盖两翼的苏南沿线以及浙北和浙东沿岸共计12个地(市),到2010—2015年收缩为8个地(市);珠三角在1995—2010年核心区保持相对稳定,而在2010—2015年有小幅收缩;京津冀由以北京为单中心扩散为京—津双中心。福建泉州和厦门在2000年以后进入这一类型,并保持稳定,大连于2005—2010年曾属于该类型。西部地区大规模净迁入活跃型的“点灶状”扩散特征集中体现为:1995—2000年的昆明,2000—2005年的昆明和南宁,2005—2010年的南宁和乌鲁木齐,2010—2015年的昆明、南宁、乌鲁木齐、兰州、西安和成都。说明1995—2015年间净迁入活跃型区域经历了不断扩散的过程,且集聚程度依然明显。
(2)净迁出活跃型地(市)由极少数地(市)转向多个省界边缘区。具体为,1995—2000年并无大规模净迁出活跃型地(市),河源和临沧属于小规模净迁出活跃型。2000—2005年和2005—2010年两时段,大规模和小规模净迁出活跃型地(市)向中西部地区显著扩张。其中,大规模净迁出活跃型以两广地区外围、皖西及皖赣、皖豫的交界地(市)最为典型,而小规模净迁出活跃型地(市)则以“散点状”分布于中西部多个省区。2010—2015年有新变化,处于江西、四川等原属于大规模或小规模净迁出活跃型的地(市)转为平衡活跃型地(市),而粤西和粤西北、桂西、皖西以及皖豫边界等部分地(市)则仍稳定于大规模净迁出活跃型。
(3)平衡活跃型地(市)在“胡焕庸线”以西和“秦岭—淮河”以南区域内大面积扩张,中西部多数省会和部分东部沿海地(市)进入该类型。最明显的增长来源于福建、江西、四川、贵州、广西、湖北、甘肃、青海、新疆等省区的地(市),且有很大部分由非活跃型转变而来。中西部省会呼和浩特、太原、郑州、合肥、武汉、长沙、贵阳等在2005年以后基本均进入平衡活跃型。福州、济南、温州、绍兴、湖州、威海等地(市)则由净迁入活跃型或非活跃型转变而来。
(4)非活跃型地(市)大幅缩减至华北、黄淮和东北平原。1995—2015年此类区域较多转变为平衡活跃型,包括新疆东北部、西藏东部、川西北、湘东和湘西、赣中北、鄂东等地(市)。而“胡焕庸线”以东和“秦岭—淮河”以北有一些地区则一直属于非活跃型地(市),并呈“连片状”分布,包括苏北、皖北、晋—冀(南)—鲁(西北和西南)—豫(东、南),陕(南、北)—甘(东南)—宁、黑(南)—吉—辽—蒙(东北)等。
4 人口迁移网络的时空变化特征
4.1 人口迁移网络格局的时空变化特征
人口迁移网络呈现出以“胡焕庸线”为界,东、西两侧迁移流具有悬殊差异的非均衡格局,人口省内就近迁移和跨省长距离迁移交织并存的基本特点(图3)。
图3
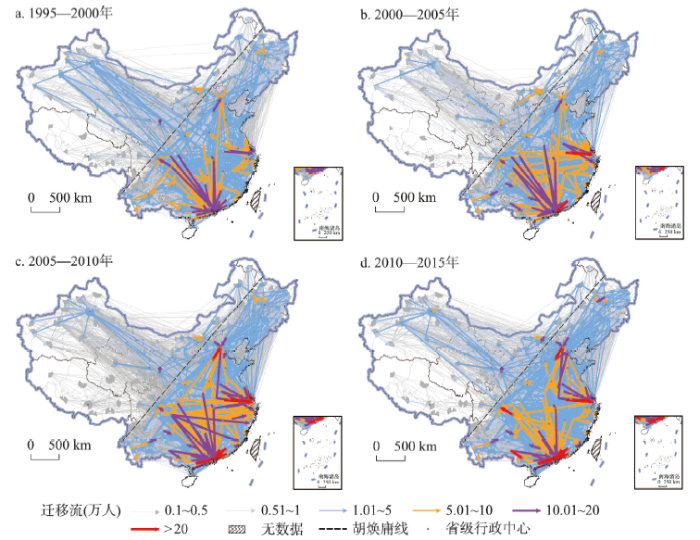
图3
1995—2015年中国人口迁移网络时空格局演化过程
Fig. 3
Spatio-temporal evolution patterns of migration network in China from 1995 to 2015
(1)人口迁移网络以“胡焕庸线”为界呈现“东密西疏”的基本格局,且在整个研究时段未发生显著变动(图3)。1995—2015年“胡焕庸线”东侧人口迁移流的织网密度很高,5万~10万、10万~20万和20万人以上3个等级的迁移流基本也都发生在“胡焕庸线”东侧,且分布稠密;而“胡焕庸线”西侧的迁移流规模、条数和密度等则相对稀疏,仅在呼和浩特、兰州、西宁、乌鲁木齐附近出现几条零星的5万~10万和10万~20万人的迁移流。
“胡焕庸线”两侧迁移流相差悬殊,且比例关系保持相对稳定。以“胡焕庸线”为界,将人口迁移流类型划分为东侧内部迁移、西侧内部迁移以及跨越东西两侧迁移三种类型,人口迁移流在“胡焕庸线”东侧、西侧和跨越东西两侧的比例大致为92∶4∶4,并保持相对稳定(表5)。对跨越东西两侧的迁移流细分发现,从西北往东南方向的人口迁移流占比不断上升,而从东南往西北方向的人口迁移流占比不断下降,两者占比关系约由1995—2000年的40∶60转变为2010—2015年的59∶41(表6)。中国人口迁移流的宏观格局与人口分布格局十分相近[28],具有很强的稳定性和顽健性。以“胡焕庸线”为界的中国人口迁移流的非均衡格局为进一步明晰中国人口再分布机理奠定了基础。
表5 3种迁移流类型在不同时段的人口迁移流比例(%)
Tab. 5
| 时段 | 东侧 | 西侧 | 跨越东西两侧 | 全国 |
|---|---|---|---|---|
| 1995—2000年 | 91.30 | 3.44 | 5.26 | 100 |
| 2000—2005年 | 94.45 | 3.10 | 2.45 | 100 |
| 2005—2010年 | 92.39 | 3.19 | 4.43 | 100 |
| 2010—2015年 | 91.62 | 3.49 | 4.90 | 100 |
表6 不同时段跨越“胡焕庸线”东西两侧的人口迁移流比例(%)
Tab. 6
| 时段 | 西北—东南 | 东南—西北 | 合计 |
|---|---|---|---|
| 1995—2000年 | 39.94 | 60.06 | 100 |
| 2000—2005年 | 49.32 | 50.68 | 100 |
| 2005—2010年 | 53.02 | 46.98 | 100 |
| 2010—2015年 | 59.29 | 40.71 | 100 |
(2)人口就近迁移格局的重要变化来自于沿海地区和中西部少数省份省内迁移强度的持续增强。粤西和粤西北的地(市)向广深莞迁移的5万以上人口迁移流明显增强。1995—2000年仅有深圳与梅州、茂名、河源和揭阳之间出现10万~20万的人口迁移流,而在2000年以后的3个时段,深圳与惠州之间,东莞与梅州、茂名之间陆续出现20万以上的人口迁移流,说明广东省内人口迁移持续增强。此外,2005—2010年和2010—2015年,上海市辖区与郊县之间、厦门与泉州和漳州之间、苏州与盐城之间陆续出现10万~20万的人口迁移流。对于中西部地区,1995—2000年“胡焕庸线”东侧仅有武汉与孝感之间、成都与资阳之间存在10万~20万的人口迁移流,而2000年后,南宁与百色之间、柳州与贺州之间、贵阳与毕节之间、昆明与曲靖之间逐步出现10万~20万和20万以上的人口迁移流;郑州、太原、西安、成都、贵阳、长沙等部分省会与周边少数地(市)之间逐步出现5万~10万的人口迁移流。2010—2015年大庆与绥化之间、呼和浩特与乌兰察布之间、兰州与白银之间出现了10万~20万的人口迁移流。
(3)人口跨省长距离迁移的变化主要体现在沿海三大城市群吸引力的“此消彼长”,和成渝地区内部吸引力的持续提升。总的来看,珠三角的跨省人口迁移流持续减弱,长三角依然强劲,京津不断增强。1995—2010年珠三角与川渝鄂豫4地之间存在众多5万~10万和10万~20万的人口迁移流,然而,2010—2015年珠三角与鄂豫之间的5万~10万的人口迁移流已变稀疏,珠三角与川渝豫之间的10万以上人口迁移流已不复存在,珠三角与湖北之间也仅剩武汉迁往深圳的一条人口迁移流。长三角的沪苏浙皖之间以及沪苏浙与豫赣之间的人口迁移流始终保持在较高规模。5万~10万的人口迁移流集中在上海与苏皖和河南南部、苏锡与安徽和河南、温州金华与上饶之间;10万~20万和20万以上的人口迁移流则体现在上海对六安、南通、合肥、阜阳、亳州和信阳的吸引,以及苏州对六安、盐城、商丘、信阳的吸引中。京津与豫冀之间的人口迁移流不断增强。如石家庄和保定迁往北京的人口迁移流在1995—2000年仅为10万~20万人,而后3个时段则稳定在20万人以上;1995—2000年和2000—2005年河南迁往京津的人口迁移流均少于5万人,但到了2005—2010年,则出现了5万~10万和10万~20万的人口迁移流,2010—2015年变得更为显眼。在成渝地区,广安迁往重庆的人口迁移流在5万~10万人的区间内不断增强至2010—2015年的近10万人(9.8万),重庆迁往成都的人口迁移流由早期的9.6万人跃升至2010—2015年20万人以上。
4.2 人口迁移网络结构的时空变化特征
利用社区发现算法,将4个时段的人口迁移网络依次划分为9个、10个、8个和10个“社区”(图4)。在全国层面上,东中西部地区人口迁移的流场结构变化各异,东部沿海地区主要城市群内部不断分化,影响范围减弱;中部地区只有少数省份演化出以省或类省区为单元的独立社区;西部地区则是西北相对稳定,西南持续变动。
图4
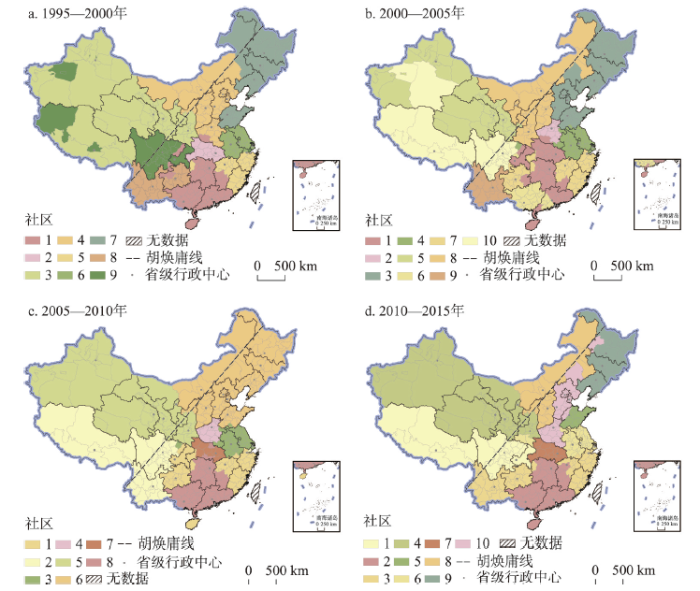
图4
1995—2015年中国人口迁移社区的时空演化过程
Fig. 4
Spatio-temporal evolution of the community of migration in China from 1995 to 2015
(1)东部沿海地区呈现出京津冀与东北、山东分化,长三角沪苏皖与闽浙赣分化,珠三角引力范围缩小等特征。东北、山东与京津冀的人口迁移流经历“对流—汇合—再分化”的过程,预示山东、东北内部就近迁移的现象在逐渐显现,而京津冀对其的影响则相对弱化;长三角的区域一体化程度较高,沪苏浙皖通常被视为是推进区域一体化的核心区,但从人口迁移流来看,沪苏皖与闽浙赣在研究时段中一直分属两个社区,沪苏浙皖的一体化表现得并不显著;珠三角的引力范围由1995—2000年和2000—2005年包括川、渝、贵、豫、粤、赣、桂、湘、琼、鄂等多省区在内的地(市),演变为2005—2010年的粤、赣、桂、湘、鄂和2010—2015年的粤、赣、桂、湘、琼等省份。东部沿海地区人口迁移流场结构的时空演变特征表明,三大城市群因具有政策、区位、产业集聚、历史基础和资源环境承载力等多重优势,在研究时段内一直是省内和跨省人口迁入的重要目的地。因不同时期各城市群处于不同的发展阶段,其势力范围持续变动,如2010年后京津对豫冀人口的吸引作用明显提高,原来人口迁入的首选区域由珠三角让位于长三角,珠三角吸引迁入人口的比例有一定程度的下降[29]。
(2)除了湖北以外,中部地区多数省份未能演化出以省或类省区的独立社区。其中,湖北省域范围内武汉与周边地(市)就近迁移格局渐趋稳定;而安徽、湖南、山西等省区在研究时段内则一直未能演化出独立的社区,3个省份分别被划分至长三角、珠三角和京津冀(蒙)等社区;江西北部与南部迁移人口流向明显分化,北部和南部分别被划入长三角社区和珠三角社区;河南省虽在2000—2005年和2005—2010年曾经单独构成社区,但在1995—2000年隶属于京津冀蒙晋社区,2010—2015年重新隶属京津冀社区。湖北省独立社区形成的可能原因在于:受2008年以来全球金融危机、沿海土地和人力成本上升等的影响,湖北省凭借其中心城市的区位优势吸收了较多从沿海向内地转移的产业,并由此带动了部分跨省迁移人口回流或省内迁移人口就近迁移至本省的中心城市,推动其城镇化进程的快速发展[30,31]。而中部其他省份未能演化出独立社区可能在于,这些省份的中心城市实体型产业还相对薄弱、就业机会和收入相比沿海大城市较少等,使得人口跨省长距离迁移至沿海仍是其生计安排的重要选择[32,33]。
(3)西部地区的西北与西南由相对一体走向二元分化。西北的陕甘宁青新蒙(西)具有高度的一体化,在研究时段内变动幅度很小,形成了相对均一的流场结构。西南地区的云贵川渝藏等省区所属的社区则经历了多次变动。1995—2000年云贵、川渝各成一社区,西藏大部分与西北同属一个社区;2000—2005年云南、川藏各成一社区,而重庆和贵州则分别并入珠三角社区、闽浙赣社区,在后两个时段西南地区虽都是两个社区,但部分空间单元出现“互换”,表现为2005—2010年形成的是闽浙赣渝贵、川藏云这两社区,而到2010—2015年则演变成了闽浙赣云贵、川藏渝两个社区。其中,西北社区相对稳定,究其原因,一方面该区离海较远,人口迁移至沿海地区相比于区内迁移成本更高;另一方面该区迁移存量和人口密度较低,即使有部分人口迁出,但规模并不会很大,无法从宏观上改变已形成的社区结构。西南社区分化的原因则在于,一是随着中国于2001年加入世界贸易组织(WTO),中国进入了以沿海地区为主阵地的经济社会高速发展阶段,珠三角社区和闽浙赣社区在2000年以后辐射至西南地区是对这一时代特征的重要注脚;二是得益于成渝城市群一体化建设,促进了包括人口在内的各要素的双向流动,川渝内部相互吸引力持续增强,并导致2010—2015年产生了川藏渝社区;三是虽然广西内部的南宁—百色之间和柳州—贺州之间的人口迁移流比早期时段有所提升,但未能抵消邻近广东对其人口的强吸引,使得两广大多数时期处于同一社区。
分析可知,在人口跨省长距离迁移和省内就近迁移两者交织的背景下,通过社区发现划分的流场结构显示,跨省地(市)间的长距离迁移正逐渐弱化,而省内地(市)间的就近迁移则不断凸显其作用;并表现出前者变动相对频繁,后者相对稳定的特征。这表明,跨省长距离迁移仍会持续变化,而省内就近迁移将成为重要迁移形式,并将持续发展。如何同时顾及这两类迁移者,更好地维持其家庭生计,在尊从迁移人口自身意愿的同时,实现不同空间选择的安居乐业和家庭团聚,是需予以考虑的重要问题。
5 结论与讨论
本文基于全国人口普查数据和Abel的人口迁移估算方法,估算了在1995—2015年间4个阶段中国地(市)间人口迁移O-D流,刻画了20年间中国人口迁移的时空变化特征,具体结论如下:
(1)中国人口迁移的规模和强度不断上升,但地区间的差异在逐渐缩小,呈现出由相对不活跃的少数、局部地区参与的“低活性时代”,逐步走向活跃、绝大多数地区参与的“高活性时代”。
(2)人口迁移地域类型的时空演化过程呈现出各活跃型地(市)不断扩散,而非活跃型地(市)大幅缩减的基本特征。其中,以大规模净迁入活跃型地(市)占主导的净迁入活跃型地(市)呈现以东部沿海主要城市群内部的“点块状”扩散与局部收缩,以及西部地区省会“点灶状”扩散为主的特征;净迁出活跃型地(市)由极少数地(市)转向多个省区边界,且以两广外围、皖西及皖豫交界地区最为典型;平衡活跃型地(市)在“胡焕庸线”以西和“秦岭—淮河”以南的区域内大面积扩张,中西部多数省会和部分东部沿海地(市)进入该类型;非活跃型地(市)则大幅收缩至华北、黄淮和东北平原,呈“连片状”分布。
(3)人口迁移网络呈现出以“胡焕庸线”为界,东、西两侧迁移流具有悬殊差异的“东密西疏”的非均衡格局。以“胡焕庸线”为界,人口迁移流在“胡焕庸线”东侧、西侧和跨越东西两侧的比例大致为92∶4∶4的大数特征保持相对稳定。在跨越东西两侧的人口流细分的从西北往东南方向和从东南往西北方向的人口迁移流中,两者占比关系约由1995—2000年的40∶60转变为2010—2015年的59∶41。彰显了中国人口迁移流非均衡格局很强的稳定性和顽健性。
(4)人口迁移流模式呈现出省内迁移的持续增强,以及跨省迁移中沿海三大城市群吸引力的“此消彼长”和西南地区的不断增强。省内迁移的持续增强,① 来自沿海地区的粤西和粤西北地(市)迁往广深莞、上海郊县迁往市辖区、泉州和漳州迁往厦门、盐城迁往苏州等人口迁移流的不断提升;② 中西部的南宁、武汉、成都、贵阳、昆明、郑州、太原、西安和长沙等省会与周边地(市)人口迁移流的持续跃升;③ 绥化迁往大庆、乌兰察布迁往呼和浩特、白银迁往兰州的人口迁移流的微增。跨省迁移中三大城市群吸引力的“此消彼长”表现为珠三角的持续减弱、长三角的依然强劲和京津的不断增强;而西南地区的增强则集中体现为成渝内部广安迁往重庆、重庆迁往成都等人口迁移流的跃升。
(5)在跨省迁移和省内迁移交织的背景下,东中西部地区的人口迁移流场结构表现为:沿海地区主要城市群内部分化和影响范围减弱,中部地区(除湖北省)未能演化出以省为单元的独立社区,西部地区则是西北相对稳定而西南持续变动。东部沿海地区呈现出京津冀与东北、山东分化,长三角沪苏皖与闽浙赣分化,珠三角引力范围缩小等特征;中部地区湖北的武汉与周边地(市)就近迁移格局渐趋稳定,安徽和江西北部、湖南和江西南部、山西和河南等则分别被划分至长三角社区、珠三角社区、京津冀社区;西北的陕甘宁青新蒙形成了相对均一的流场结构,而西南的云贵川渝藏等所属的社区则经历多次变动。
最后,需进一步讨论或深化的3个方面为:① 为保持研究期内迁移矩阵中各地域单元的前后连贯一致而将部分地(市)合并,导致其人口迁移规模在一定程度上被低估,这一问题将在有更精细数据的支撑下解决;② 本文集中于对人口迁移时空变化特征的解析,而影响这些变化的机理分析是深入认知人口迁移时空规律的重要环节,限于篇幅,笔者将专门探究;③“胡焕庸线”两侧人口迁移流悬殊差异这一格局的影响因素分析也有待于后续研究的开展。
参考文献
The major changes of inter-provincial migration model in China
我国省际人口迁移模式的重大变化
China's floating population: New evidence from the 2000 census
DOI:10.1111/padr.2004.30.issue-3 URL [本文引用: 1]
The regional model of inter-provincial migration and its changes since China's economic reform
中国经济体制改革以来省际人口迁移区域模式及其变化
Spatial pattern changes of China's internal migration to prefectural and higher level cities: Evidence from the 2000 and 2010 population census data
中国地级以上城市人口流动空间模式变化: 基于2000和2010年人口普查数据的分析
Changes in the form of population migration and mobility in China and corresponding policy responses at the late-intermediate stage of urbanization
DOI:10.18306/dlkxjz.2020.12.008
[本文引用: 1]

The form of population migration and mobility constitutes a key element of the characteristics of migration. Since China has entered the late-intermediate stage of urbanization, it is very important to accurately identify and understand the transformation in the form of population migration and mobility. While a growing body of literature has been generated and significant progress has been made on China's population migration and mobility and its determinants, an important inadequacy of relevant research are often focused on rural to urban population migration and mobility, neglecting the multi-dimensional forms of population migration and mobility. Based on relevant theories and international experience relating to the transformation in the forms of population migration and mobility, and using data from the China Migrants Dynamic Survey (CMDS), Report on Monitoring and Investigation of Migrant Workers in China, and relevant statistics, this study examined the processes of the transformation in the forms of the population migration and mobility in China and their characteristics at the present stage and the issues and challenges arising therefrom. The results show that there have been significant changes in the forms of population migration and mobility in China, and such changes mainly manifest in the following aspects: First, there has been a steady increase in return migration and short-distance migration; Second, inter-urban migration has also significantly increased and become increasingly common; Third, the urbanization process of the floating population based on the rural-urban transfer of their hukou has started to accelerate, and their rural-urban multiple livelihoods has increasingly shifted towards the urban end; Fourth, there has been a developing trend of urbanization driven by housing purchases in both migrants' places of origin and destination. The study also identified issues and challenges in the process of transformation in the forms of population migration and mobility, including: First, there is a lack of sustainability in in situ urbanization promoted by return migration; Second, urban-urban migration are highly concentrated in a few provinces of the eastern region; Third, there are still many obstacles for the urbanization of rural migrants based on their hukou transfer. Finally, the article puts forward some policy recommendations from the perspectives of the construction of multi-level spatial system of urbanization of the floating population, the transformation of urban governance mode, and the promotion of the capacity for sustainable development of small towns in central and western regions.
城镇化中后期中国人口迁移流动形式的转变及政策应对
Migration transition in China
中国人口的迁移转变
China's floating population in the 21st century: Uneven landscape, influencing factors, and effects on urbanization
DOI:10.11821/dlxb201504005
[本文引用: 1]
China has witnessed unprecedented urbanization over the past decades. The rapid expansion of urban population has been dominated by the floating population from rural areas, of which the spatiotemporal patterns, driving forces, and multidimensional effects have been scrutinized and evaluated by voluminous empirical studies. However, the urban and economic development mode has been reshaped by the globalization and marketization processes and the socioeconomic space has been restructured as a consequence. How has the spatial pattern of floating population evolved against these backdrops? How has the evolution been driven by the interaction of state and market forces? What have been the contribution of population mobility to the urbanization of origin and destination regions and the evolution of China's urban system? The latest national censuses conducted in 2000 and 2010 offer the opportunity to systematically answer these questions. Analysis based on the county-level data comes to conclusions as follows. (1) The spatial pattern of floating population remained stable over the first decade of the 21st century. Three coastal mega-city regions, namely the Yangtze River Delta, the Pearl River Delta, and the Beijing-Tianjin-Hebei Region, were major concentration areas. As the emergence and rapid development of other coastal mega-city regions, the coastal concentration area of floating population tended to geographically united as a whole, whereas the spatial distribution within each region variegated significantly. (2) Floating population gradually moved into provincial capitals and other big cities in interior regions and its distribution center of gravity moved northward around 110 km during the study period. (3) Compared with extensively investigated inter-provincial migrants, intra-provincial migrants had higher intention and ability to permanently live in cities they worked in and thus might become the main force of China's urbanization in the coming decades. (4) The spatial pattern of floating population was shaped jointly by the state and market forces in transitional China. While the impacts of state forces have been surpassed by market forces in the country as a whole, they are still important in shaping the development space of central and western China. (5) The massive mobility of population contributed a large proportion to the increase of urbanization levels of both origin and destination regions and reshaped China's urban system in terms of its hierarchical organization and spatial structure.
中国流动人口空间格局演变机制及城镇化效应: 基于2000和2010年人口普查分县数据的分析
Areal differentiation of inter-provincial migration in China and characteristics of the flow field
中国人口迁移的区域差异与流场特征
Interprovincial migration, population redistribution, and regional development in China: 1990 and 2000 census comparisons
DOI:10.1111/j.0033-0124.2005.00479.x URL [本文引用: 1]
Modeling network autocorrelation within migration flows by eigenvector spatial filtering
DOI:10.1007/s10109-008-0068-2 URL [本文引用: 1]
A universal model for mobility and migration patterns
DOI:10.1038/nature10856 URL [本文引用: 1]
Measuring directional urban spatial interaction in China: A migration perspective
Quantifying global international migration flows
DOI:10.1126/science.1248676
PMID:24675962
[本文引用: 1]
Widely available data on the number of people living outside of their country of birth do not adequately capture contemporary intensities and patterns of global migration flows. We present data on bilateral flows between 196 countries from 1990 through 2010 that provide a comprehensive view of international migration flows. Our data suggest a stable intensity of global 5-year migration flows at ~0.6% of world population since 1995. In addition, the results aid the interpretation of trends and patterns of migration flows to and from individual countries by placing them in a regional or global context. We estimate the largest movements to occur between South and West Asia, from Latin to North America, and within Africa.
Spatial-temporal analysis on spring festival travel rush in China based on multisource big data
The geography of cultural ties and human mobility: Big data in urban contexts
DOI:10.1080/00045608.2015.1121804 URL [本文引用: 1]
The settlement intention of China's floating population in the cities: Recent changes and multifaceted individual-level determinants
DOI:10.1002/psp.v16:4 URL [本文引用: 1]
Research on the assimilation of the floating population in China
中国流动人口的社会融入研究
Spatial variation of the determinants of China's urban floating population's settlement intention
DOI:10.11821/dlxb202002003
[本文引用: 1]
It is demonstrated that the determinants of China's urban floating population's settlement intention are different among geographic units, which seems to be ignored by previous researches. Based on the data from the 2015 national migrant population dynamic monitoring survey (CMDS) and related statistics, this article uses the Semiparametric Geographically Weighted Regression (SGWR) model and k-means cluster method to examine the spatial variation of the factors influencing floating population's settlement intention in 282 prefecture- and provincial- level cites of China. Results provide the following conclusions. (1) The settlement intention of urban floating population is mainly influenced by the floating population characteristics instead of the destination characteristics. (2) Social and economic factors are closely related to the floating population's settlement intention. Meanwhile, the demographic, family and mobility factors exert a significant impact on such an intention. To be specific, there exists an inhibitory effect on floating population's settlement intention in factors such as income, marriage, and cross provincial mobility. However, housing expenditure, participation rate, number of children and other factors can effectively contribute to such intention. (3) Zonal spatial differentiation patterns of the influencing factors' coefficients are illustrated by the SGWR model, which can be further divided into four categories ("E-W", "N-S", "NE-SW" and "SE-NW"): The positive influences of ethnic and family factors are decreasing from the northern to southern regions, while the influence of employment ratio in the secondary industry is declining from the northwest to the southeast regions, and the impacts of factors such as the number of children and per capita GDP are diminishing from the northeast to the southwest regions. In eastern developed areas, the settlement intention of floating population with higher income is comparatively lower, while migrants with higher housing expenditure in southern China have a stronger intention to settle down. (4) Four influencing zones are detected by the k-means method: Floating population's settlement intention in North China, Central China and East China is significantly affected by multiple factors; In the northwest region and part of the southwest region, migrants' settlement intention is mainly influenced by demographic and social factors; The northeast region and the eastern part of Inner Mongolia's floating population's willingness to stay is mainly related to economic and family factors; Apart from housing expenditure, coefficients of other factors are relatively small in southern China and part of the central, eastern and southwestern regions. Additionally, this paper puts forward some suggestions on the service and management of the floating population in China.
中国城市流动人口居留意愿影响因素的空间分异特征
Bilateral international migration flow estimates for 200 countries
DOI:10.1038/s41597-019-0089-3
PMID:31209218
[本文引用: 2]
Data on stocks and flows of international migration are necessary to understand migrant patterns and trends and to monitor and evaluate migration-relevant international development agendas. Many countries do not publish data on bilateral migration flows. At least six methods have been proposed recently to estimate bilateral migration flows between all origin-destination country pairs based on migrant stock data published by the World Bank and United Nations. We apply each of these methods to the latest available stock data to provide six estimates of five-year bilateral migration flows between 1990 and 2015. To assess the resulting estimates, we correlate estimates of six migration measures from each method with equivalent reported data where possible. Such systematic efforts at validation have largely been neglected thus far. We show that the correlation between the reported data and the estimates varies widely among different migration measures, over space, and over time. We find that the two methods using a closed demographic accounting approach perform consistently better than the four other estimation approaches.
Migest: Methods for the indirect estimation of bilateral migration
Modeling approaches to the indirect estimation of migration flows: From entropy to EM
Spatial statistics and regional types evolution of China's county-level floating population during 1982-2010
DOI:10.11821/dlxb201712002
[本文引用: 2]
County-level units, which contain both counties and county-level cities, are the key floating population regulating units for China's new urbanization policy. This paper examines the statistical definitions of floating population for the censuses in 1982, 1990, 2000 and 2010. According to the principle of geographic data transformation among different spatial scales, the numbers of both the in-migrants and out-migrants at county level are calculated for each census. And the county-level spatial database of floating population is also built up. Besides, this paper puts forward a modified composite-index method to identify six types of the regional types of floating population, namely, large-scale active net in-migration, small-scale net in-migration, large-scale active net out-migration, large-scale active net out-migration, active balanced migration and inactive migration. Using this method, we analyze the spatial pattern evolution of China's floating population. The main results are listed as follows. (1) The regional types pattern of floating population transferred from inactive domination into active domination and from relative equilibrium into high polarization. Many regions turned into active net out-migration types. Most of the floating population moved into just a few cities which belongs to active net in-migration type. There were only 51 large-scale active net in-migration cities, but they occupied 55.85% of total inter-county in-migrants in China. (2) The spatial pattern of China's floating population regional types also presented a polarized feature. The Yangtze River Delta urban agglomeration and Pearl River Delta urban agglomeration in southeast coastal China are the main in-migrant floating population cluster regions, while Beijing, Tianjin and other provincial capitals are also main migration destinations with a monocentric pattern. The active net out-migration regions are mainly located in regions south of the "Qinling Mountains-Huaihe River" Line to the southeast of "Hu Line", which became the largest population losing area in China. (3) Social-economy was the major factor affecting the distribution of floating population regional types. Administration factor also gradually became a leading factor.
1982—2010年中国县市尺度流动人口核算及地域类型演化
Research on classification methods and spatial patterns of the regional types of China's floating population
DOI:10.11821/xb201010004
[本文引用: 1]
With the rapid increase of the number and influence of floating population in China, it is urgent to understand the regional types of China's floating population and their spatial characteristics. After reviewing the current methods for identifying regional types of floating population, this paper puts forward a new composite-index method and its further modification method consisting of two indexes simultaneously: the net migration rate and gross migration rate. Further, those methods are empirically tested by using China's 2000 Census data at county level. The results show: (1) The composite-indexes method is much better than the traditional single-index method because it can measure the migration direction and scale of floating simultaneously and in particular it can identify the unique regional types of floating population with large-scale immigration and emigration. (2) The modified composite-indexes method, by using the share of a region's certain type of floating population to the total in China as weight, can effectively correct the over- or under-estimated error due to the rather large or small total population of a region. (3) The spatial patterns of different regional types of China's floating population are closely related to regional differentiation of their natural environment, population density and socio-economic development level. The three active regional types of floating population are mainly located in the eastern China with lower elevation, more than 800 mm precipitation, rather than in the region with higher population density and economic development level.
中国流动人口地域类型的划分方法及空间分布特征
The spatial structures and organization patterns of China's city networks based on the highway passenger flows
基于公路客流的中国城市网络结构与空间组织模式
Fast unfolding of communities in large networks
Study on the stability of Hu Line and different spatial patterns of population growth on its both sides
DOI:10.11821/dlxb201504004
[本文引用: 1]
The Hu Line for population distribution in China has been regarded as one of the greatest geographical discoveries in China because it reveals the significant spatial characteristics of China's human-land relationship. Thus, the stability and significance for spatial development of Hu Line have become a major concern after the dramatic economic and social changes since China's reform and opening-up in 1978. With the support of GIS, this paper conducts a statistical analysis and systematic investigation on the stability and spatial patterns of population growth on both sides of Hu Line by constructing the spatial database of China's census data from 1982 to 2010 and initiating a new method for identifying the spatial patterns of population growth. The findings are as follows: (1) The Hu Line has been rather stable, while a new tendency of population change has emerged. On the whole, the ratio of population on both sides of Hu Line has roughly been kept at 94:6 (the southeastern side: the northwestern side) in the last 30 years. However, the proportion of population on the southeastern side of Hu Line has been slightly decreasing, while that on the northwestern side of Hu Line has been slightly increasing, which is benefited from its higher rate of natural population growth. (2) The spatial patterns of population growth on both sides of Hu Line were quite different. The agglomeration degree of population distribution on the southeastern side of Hu Line increased greater. The areas with negative population growth rate have rapidly expanded, mainly located south of the Qinling Mountains - Huaihe River line and the northeastern China, while the areas with the fast population growth rate concentrated in the areas such as the Yangtze River Delta, the Pearl River Delta and Beijing-Tianjin metropolitan region. Thus, the spatial pattern of population growth on the southeastern side of Hu Line presented an aggregating and diffusion mode of Matthew effect. (3) The spatial pattern of population growth on the northwestern side of Hu Line could be referred as the relative balance type. In this region, the positive rate of population growth and the lower agglomeration degree of population have been identified. There were lots of ethnic groups located on the northwestern side of Hu Line, and they generally lived dispersedly but with a higher rate of natural population growth due to preferential population policy. However, there were also some areas with negative rate of population growth on the northwestern side of Hu Line and they were mainly distributed close to the Hu Line and new Eurasia Land Bridge. (4) In the future, the spatial patterns of population growth on both sides of Hu Line will continue to change. On the southeastern side of Hu Line, the capacity of population agglomeration for those small and medium-sized cities and towns should be enhanced. As for the northwestern side of Hu Line, the emphasis should be placed on promoting its urbanization and enhancing the capacity of population agglomeration for major cities.
“胡焕庸线”的稳定性及其两侧人口集疏模式差异
Changing spatial and temporal patterns of China's floating population: Findings from the 2010 and 2000 censuses//Iredale R R, Guo F. Handbook of Chinese migration: Identity and Wellbeing
Return migration and rural revitalization in central China: A case of Maozui, Hubei Province
DOI:10.13249/j.cnki.sgs.2020.01.014
[本文引用: 1]
Urban to rural return migration is a new phenomenon which provides a new perspective to understand the transformation of rural-urban relations in China. In the last decades, the substantial increasing number of urban to rural return migrants has attracted wide concerns among policymakers, society and academia. However, little attention has been given to understand the process of return migration and their influences on local developments, especially from the perspective of origin place. Hanzhengjie, located in the central city of Wuhan, was a famous street with a long history of business and trading. After the Reform Era began in the late 1970s, it attracted a great deal of clothing industry workers and entrepreneurs from Maozui. Since 2011, with the government’s efforts to redevelop Hanzhengjie from ‘low-end’ to ‘high-end’, many small factories have been forced to move out. Maozui, a small town of Xiantao City, Hubei Province, seized the opportunity to receive the industry relocated from Hanzhengjie to achieve its local development. Followed by industrial relocation, many migrants returned to Maozui. In this context, based on a series of fieldwork conducted in Maozui and Hanzhengjie during 2018 and 2019, this article examines the different return process of rural labor force and capitals, and interrogates the important roles of return migration and returning entrepreneurial activities in relation to rural revitalization. The findings include: 1) The return migration is marked by a process of the ‘localization’ of rural labor force and capital. The return of labor force is motivated by multiple factors such as family reunion, local opportunities and both living environment. ‘Localized’ labor force becomes the main driving force of return capital. 2) The return skilled migrants and entrepreneurs who keep moving back and forth between city and rural areas aim to capture the new market opportunities. They act as a ‘bridge’ to transfer knowledge, capital and culture from urban to rural areas. 3) Most of the returnees work in industries related to their previous employment and prefer to buy commodity housing in the central town instead of their original village. It promotes the transformation of rural economy and reconstructs the rural social space. These results indicate that the dynamic role of return migrants in central China as agents of information transfer and entrepreneurship. Geographic research on urban-rural relations and rural revitalization should focus more on the complexity and dynamics of return migration and explore the interactive mechanism of return migration and the transformations or reconstruction of villages and towns.
“人口回流”视角下的中部地区乡村振兴: 对湖北“毛嘴模式”的实证
The returning-migrant-induced urbanization: The new path of urbanization in Middle China
DOI:10.13249/j.cnki.sgs.2020.05.002
[本文引用: 1]
Based on the research on population spatial diffusion and its variation in migration, this study proposes that a new path of urbanization in central area of China is emerging, namely returning-migrant-induced urbanization (RMIU). Through conducting an intensive questionnaire survey and a lot of interviews in several cities in Middle China, as well as comparing with urbanization pathways in the coastal China, we conclude 3 new characteristics of the RMIU. First, the county-level central cities have become the main attractive places for hosting returning migrants, where is the first choice for a large share of returning migrants. This is due to abundant job opportunities, good public service, better education resources, good living condition and lower living expenses. Unlike their elder generation returning from coastal areas who become peasants again, the new returning generation is still working in non-agricultural fields, both in manufacturing industries and tertiary sector. Second, many “pendular populations” are existing in counties and county-level cities, which means people working in cities, but living in countryside. Therefore, this is a centripetal urbanization featured as the strong county proper, which is much different from urbanization process in coastal China, such as exo-urbanization, urbanization from below, peri-urbanization, in situ urbanization. Third, the prefectural cities are also an important option for returning migrants for living and working, especially for those people with better economic condition. RMIU is a new phenomenon recently occurring in middle China, which is totally different from urbanization pathways in eastern China. Regarding the driving forces behind the process of RMIU, the shift of manufacturing industries from developed coastal areas to middle China is a main contributor, which creating a lot of job opportunities for returning people. With such shift, many floating persons who once worked in coastal cities are returning their hometown or nearby cities for living and working. The kinship social network facilities such trend of migrant return, as they must solve their problems of kids’ education and the eldly care. So, economic factors are not the very important force underlying the current wave of returning migrants. In addition, some of them start up business in their hometowns, with market experiences and skills getting from the coastal China. This induces the endogenous development in Middle China. Finally, some policy implementations are highlighted, including rural revitalization, urbanization policy and urban transition.
回流城镇化:中部地区城镇化开启新路径
Re-examination of urbanization paths and mechanism in population outflow areas: A case study of counties in Sichuan Province
人口流出地区城镇化路径机制再认识: 以四川省县域单元为例
