

1 引言
推动绿色发展,促进人与自然和谐共生是以习近平为核心的党中央在大力推进生态文明建设、美丽中国建设上作出的重大战略举措。绿色发展强调“绿色青山就是金山银山”,人与自然和谐共生重在正确处理生态环境保护与经济发展的关系,而实现这两个目标,就需要向创新要动力,即绿色技术创新是推动绿色发展,促进人与自然和谐共生的第一动力[1⇓⇓⇓⇓-6]。实际上,在2016年的“科技三会”上,习近平总书记就指出,生态文明发展面临日益严峻的环境污染,需要依靠更多更好的科技创新建设天蓝、地绿、水清的美丽中国。随后,国家发展与改革委员会和科技部在2019年联合颁布的《关于构建市场导向的绿色技术创新体系的指导意见》(简称《意见》)中就明确提出要加快构建以企业为主体、以市场为导向的绿色技术创新体系。《中华人民共和国国民经济和社会发展第十四个五年规划和2035年远景目标纲要》(简称《纲要》)中第11篇第39章中也明确指出,要构建市场导向的绿色技术创新体系,实施绿色技术创新攻关行动。此外,《意见》和《纲要》皆提出了若干绿色技术创新的重点领域,如节能环保、清洁生产、清洁能源、生态保护与修护等。《意见》中还指出要选择绿色技术创新基础较好的城市,建设绿色技术创新综合示范区,推进绿色生态城市建设。那么,在中国绿色技术创新的实践中是否已经形成以企业为主体的绿色技术创新体系?中国绿色技术创新活动是否集中于上述几个重点技术领域?哪些城市的绿色技术创新基础较好?回答这些问题,我们就必须对中国绿色技术创新展开实证研究。
绿色技术创新是环境经济学、创新经济学、创新管理学等研究领域的核心议题,也是近年来环境经济地理学领域研究的新兴课题之一。追溯绿色技术创新研究文献,可发现绿色技术创新研究起源于20世纪80—90年代,繁荣于21世纪初,尤其是近年来在可持续发展框架下作为应对全球气候变化的核心支撑,绿色技术创新及其国际科技合作相关问题引起了学者们的广泛关注[7-8]。在绿色技术创新研究的进程中,绿色技术创新的概念内涵发生着明显的转向,从“响应导向”(作为政府环境规制的响应)到“治理导向”(减少环境损害)、“目标导向”(寻求技术突破,实现转型升级),再到当前的“内容导向”(包括产品设计、工艺创新、制度创新等),绿色技术创新的内涵愈发广泛,也愈发强调国家制度体系对于绿色技术创新的重要性[9⇓⇓-12]。另外,因评价指标、关注重点、研究区域或案例的不同,学者们在研究过程中也推出了诸多类似的概念,如环境创新、生态创新、可持续创新等。但一致的是,这些概念的内涵一方面皆强调技术层面的发明创造是根本,另一方面也都认可企业的绿色技术创新主体地位,这也是当前绿色技术创新研究集中于企业层面的主要原因[13⇓-15]。学术界就企业绿色技术创新能力评价、企业绿色创新行为的驱动因素、企业绿色技术创新效应、企业绿色技术创新战略设计等内容进行了深入的探讨[9⇓⇓-12]。虽然在环境经济地理研究的带动下,区域层面的绿色技术创新评价、绿色技术创新效率测算等研究在近年也慢慢增多,但整体而言还相对较少,特别是城市尺度的绿色技术创新空间差异研究还很少见[16⇓-18]。
基于此,本文通过借鉴经济合作与发展组织(Organization for Economic Co-operation and Development, OECD)的绿色专利识别方法,从绿色专利申请量的视角分析了2007—2017年中国城市绿色技术创新的时续发展特征、创新主体特征以及空间分布特征,并探讨了其影响因素,一方面试图丰富当前环境经济地理学的研究内容,另一方面试图为建设中国绿色技术创新体系提供案例支撑。
2 理论基础与研究假设
(1)环境经济学理论视角下的环境规制对企业绿色技术创新行为的影响研究。环境经济学其将环境规制视作企业外在成本内部化的一种政策手段,主要关注环境规制对企业的影响[19-20]。早期观点集中阐释“抑制效应”,即环境规制一方面会造成企业生产成本增加,降低企业竞争优势;另一方面还会促使污染物的转移,带来“污染避难所”效应[21-22]。随着“波特假说”的提出,大量实证研究也证明了环境规制的正外部性效应,即环境规制会诱发(迫使)企业选择绿色技术创新路径,从而在绿色产品市场获取有利地位[23-24]。环境经济学对于企业绿色技术创新行为驱动因素中环境规制的关注给予本文研究城市绿色技术创新驱动因素很好的启示。实际上,在环境经济地理学领域,学者们已广泛探讨了环境规制对城市工业绿色发展效率的影响、环境规制对污染物或污染型企业转移的影响、环境规制对城市碳排放的影响、环境规制对城市产业结构转型升级的影响等,普遍发现环境规制的影响效应呈现倒“U”型特征,即短期抑制、长期促进[25⇓⇓⇓-29]。
基于此,本文提出研究假设1,即城市环境规制强度对城市绿色技术创新具有正向的促进作用,城市环境规制强度越强,城市绿色技术创新能力就越强。
(2)创新经济学理论视角下的企业绿色技术创新的驱动因素研究。创新经济学研究已广泛揭示企业层面绿色技术创新行为的影响因素,如在市场驱动因素层面,创新经济学广泛探讨了外商直接投资(Foreign Direct Investment, FDI)与绿色技术创新之间的关系,相关理论包括吸收能力、知识粘性、创新扩散和技术转让。当发达国家的一些跨国公司在落后的发展中国家投资时,先进的生产技术和管理理念将对东道国产生积极的环境影响[30⇓-32]。在技术驱动因素层面,创新经济学也深入研究了企业技术创新能力对于其进行绿色创新转型的影响,普遍发现创新能力较强的企业往往在绿色技术创新领域也会表象抢眼[33]。创新经济学对于企业绿色技术创新行为驱动因素中市场和技术层面的关注也给予本文研究城市绿色技术的创新驱动因素很好的启示。同样,在环境经济地理学领域,学者们也广泛探讨了FDI与城市绿色全要素生产率的关系、FDI与区域环境污染的关系,以及创新投入与城市绿色经济效率的关系、创新水平与城市绿色发展效率的关系等,普遍发现外向型的经济结构能够有效改善区域环境质量,城市创新水平与城市绿色发展之间呈现出显著的正相关关系[34⇓⇓-37]。
基于此,本文提出研究假设2,即城市本身的技术创新能力越强或城市经济发展的外向型程度越高,就越有可能从事绿色技术创新活动。
(3)创新管理学理论视角下的企业绿色技术创新战略研究。实施绿色技术创新战略不仅能够显著提升企业绩效,也有助于企业树立良好的绿色形象[38-39]。创新管理学认为,企业实施绿色技术创新战略需要具备一定的绿色技术创新基础[40-41]。除此之外,外部环境压力和对未来的期望(收益)也是企业积极实施绿色技术创新战略的重要考驱动因素,比如行业竞争对手率先实施绿色技术创新战略带来的竞争压力使得企业不得不跟进实施绿色技术创新战略[42⇓-44]。创新管理学对于企业绿色技术创新行为驱动因素中来自竞争对手压力的关注,使得本文在研究城市绿色技术创新时,不得不考虑来自邻近城市的“压力”,即城市绿色技术创新是否也具有显著的空间关联特征和空间溢出效应。城市创新活动具有显著的空间关联特征和空间溢出效应,这在创新经济地理学研究中已作为一条“基本规律”存在[45-46]。作为创新行为的一类,城市绿色技术创新显然也受此类法则支配。
基于此,本文提出研究假设3,即城市绿色技术创新受邻近城市影响,具有显著的空间关联特征和空间溢出效应。
(4)演化经济学视角下企业绿色技术创新研究。演化经济学理论视角下的企业绿色技术创新研究主要关注企业的异质性。大量研究表明,企业之间的绿色技术创新实践差异很大。大公司,尤其是跨国公司,是绿色技术创新的先驱和领导者,而中小企业在绿色技术创新方面表现出更多的不确定性[47]。企业异质性还表现行业领域差异和企业类型差异上,比如在对中国绿色技术创新的实证研究中普遍发现,市场竞争和人力资本投资较高的行业企业往往具有较强的绿色技术创新能力,民营企业相对于国有企业更有意愿进行绿色技术创新[48]。近年来,随着演化理论、扎根理论研究的深入,学者们发现企业创新意愿、创新态度对企业环境创新行为具有重要的推动作用[49],企业环境创新对其自身发展模式、成长路径以及产业中创新环境有着较高的依赖[50]。演化经济地理学同样高度关注企业异质性和企业发展路径,并延伸至区域异质性和区域发展路径,诸多研究表明区域创新具有一定的路径依赖特征,并呈现出显著的空间异质性。
基于此,本文提出研究假设4,即城市绿色技术创新具有一定的路径依赖,并随城市规模差异呈现出显著的向大城市集聚的特征。
上述4个理论分析视角基本囊括当前绿色技术创新研究的分析框架,这也凸显了绿色技术创新研究主要集中于经济学和管理学领域,分析主体也集中于企业层面。如上文提到的,随着环境问题重要性愈发凸显,经济地理学者对于环境问题的关注,以及将环境问题纳入分析框架中来,使得环境经济地理逐渐成为经济地理学新兴的研究领域[51]。从空间差异的视角将绿色技术创新从企业视角延伸至区域视角是环境经济地理学对绿色技术创新研究的贡献。相关研究主要从两个视角展开:① 侧重不同空间尺度(省域、城市)的区域绿色技术创新能力评价及影响因素分析[52⇓-54];② 侧重绿色技术创新效率的区际差异及影响因素研究[10,55]。但整体而言经济地理学领域对绿色技术创新研究还相对较少,特别是城市尺度的绿色技术创新空间差异研究还很少见。
3 数据和方法
本文旨在研究中国城市绿色技术创新的时空演化特征和影响因素。基于上述理论分析,假设城市绿色技术创新受到城市环境规制强度、城市规模、城市FDI、城市技术创新能力等因素的影响,并呈现出一定的路径依赖和空间关联特征,进而估计了简便模型:
式中:i指城市;t指时间;Patents是绿色专利数量;Environ_Regu是环境规制强度;Size是城市规模;In_FDI表示城市吸收FDI;Tech_Inno是城市技术创新能力;EI-initial表示城市在绿色技术创新领域的初始能力;αi指代城市异质性;γt代表时间效应;εi,t是指代残差。此外,还引入了2年滞后,以最大限度地减少内生性和反向因果关系的可能问题。
3.1 被解释变量:城市绿色技术创新
在绿色技术创新测度方面,不同学科、不同研究领域的学者提出了各种不同的测度方法。测度绿色技术创新不仅有助于评估国家、地区或企业在经济增长与环境退化脱钩方面取得了进展,还有助于分析绿色技术创新的影响因素及其经济和环境效应[56]。
综合现有研究进展,绿色技术创新测度方法可分为4类:① 通过构建涵盖尽可能多指标的评价体系,从而对绿色技术创新进行整体评价[57⇓-59]。如欧盟委员会《生态创新行动计划》(Eco-innovation Action Plan)开展的生态创新记分牌(Eco-Innovation Scoreboard)和生态创新指数(Eco-Innovation Index)就从五个维度(生态创新投入、生态创新活动、生态创新产出、资源效率和社会经济成果)捕捉生态创新的不同方面。② 注重绿色技术创新投入,通常以环境研发投资来表征绿色技术创新水平[60⇓⇓-63]。在OECD生态创新记分牌中,“政府环境和能源研发拨款和支出(占GDP的百分比)”“研发人员和研究人员总数(占总就业人数的百分比)”“绿色早期投资总额(美元)”3个指标用来衡量生态创新投入,其结果表明,21世纪初以来对清洁技术的总体投资一直在增加,投资最多的是能源生产技术、能源效率和运输技术。此外,生态创新记分牌还发现,增加环境和能源主题的研发投资会使得公司和研究机构的创造性表现更好[33]。③ 注重绿色技术创新产出,通常以绿色专利来衡量[63⇓⇓-66]。2015年OECD的Haščič等改进了与环境有关的专利的搜索策略,其根据国际专利分类(International Patent Classification, IPC)(A-H部)和联合专利分类(Cooperative Patent Classification, CPC)(Y部)的分类,绿色专利分为7大类,并提供了除生物多样性保护和生态系统健康技术外的6类绿色专利检索方法[63]。此外,一些国家的专利局也发布了一些与环境有关的专利。例如美国专利商标局技术评估和预测办公室认定的绿色专利包括:危险或有毒废物的销毁或遏制、废物的回收或再利用、酸雨预防、固体废物处理、替代能源、空气污染预防和水污染预防[67-68]。④ 注重绿色技术创新的过程,通常以绿色技术创新效率作为绿色技术创新的替代指标[69-70]。现有研究一般在DEA分析框架下,从投入(研发投入、人员投入、资源投入等)、期望产出(经济增长、环境相关专利、绿色产品等)和非期望产出(污染物排放、环境损失等)3个方面来衡量绿色技术创新效率。遵循这一分析逻辑,现有研究已完成了对部分企业(大型企业、中小企业或特定企业)、部分城市、部分地区和部分国家的绿色技术创新效率测度[71-72]。当然,还有其他衡量绿色技术创新的方法,如根据工业和商品分类确定绿色产品,而确定绿色产品首先需要识别代表环境的行业或商品类[64]。
上述4类绿色技术创新测度方法各有侧重。相比较而言,在城市尺度,绿色专利比环境研发投资、绿色产品和其他指标具有更高的可获得性和更广泛的覆盖范围。这也是诸如OECD这类国际组织在评价国家绿色技术创新能力或绿色经济增长时,也主要采用绿色专利作为核心指标的原因[64⇓-66]。基于此,本文在研究中国城市绿色技术创新实践时,也选取绿色专利数量作为评价指标,并以万方数据知识服务平台为数据源,获取并建构了2007—2017年中国城市绿色专利申请时空数据库。具体建构策略为:① 基于Python数据爬虫从万方数据知识服务平台获取2007—2017年中国发明专利申请详情数据,共计7398626件发明专利;② 由于中国专利分类体系采用的是IPC分类,因而本文借鉴OECD绿色专利的搜索策略[64],首先建构了IPC(Y)部与IPC(A-H)部的对应表,将OECD绿色专利的搜索策略中基于CPC分类体系识别绿色专利的方法转化为基于IPC分类体系识别绿色专利的方法,表1展示了最终基于IPC专利分类的绿色专利搜索策略。在此搜索策略下,2007—2017年中国绿色发明专利共计2006292件;③ 由于每一件专利的专利类别并非唯一性,且OECD绿色专利的搜索策略也非一一对应(存在一个专利类别隶属于不同绿色技术领域,如B01D53既隶属于温室气体处理技术,也隶属于环境治理技术),因而本文在统计各类绿色技术领域的专利申请量时采取全计数法进行统计;④ 根据绿色专利申请人地址,将2007—2017年2006292件绿色专利分配至城市尺度(包括直辖市、地级市、自治州,地区、盟和省直辖县,暂未包含港澳台地区),从而建构2007—2017年中国城市绿色专利申请时空数据库。
表1 基于IPC分类体系的绿色专利识别
Tab. 1
| 环境技术 | 描述 | IPC专利类别 |
|---|---|---|
| 清洁能源技术 | 与能源生产、传输和分配相关的气候变化缓解技术 | F24J2、F03D9、H01L31、F03D11、H02J3、B03B1、F03D7、F03D3、F03B13、H01L51、H02N6、F03G6、F02J7等47个专利类别 |
| 温室气体处理技术 | 温室气体的捕获、储存、封存或处置 | B01D53、B01J20、C01B31 |
| 绿色交通技术 | 与交通有关的减缓气候变化技术 | B60L11、H02J7、B60L8、F02M25、B60L15、F02M21、F01N3、B60W20、F02B29、B60W10、F01N5、F01N11等34个专利类别 |
| 绿色建筑技术 | 与建筑有关的减缓气候变化技术 | E04D13、F24F5、F21S9、F03D9、F24D17、H01L31、F24J2、H02J9、E04H1、H05B37、F21S9、F21S8等64个专利类别 |
| 环境治理技术 | 减少空气污染技术、减少水污染技术、废物管理技术、土壤修复和环境监测技术 | B01D53、F23G7、F23J15、F27B1、C21B7、C21C5、F23B80、F23C9、F23C10、B01D53、F02M3、B01J23、F01M13、F02B47等96个技术类别 |
| 绿色水技术 | 水源保护和利用技术 | F16K21、F16L55、E03C1、E03D3、E03D1、A47K11、E03D13、E03D5、E03B1等21个专利类别 |
本文所涉及的绿色技术包括清洁能源技术(与能源生产、传输和分配相关的气候变化缓解技术)、温室气体处理技术(温室气体的捕获、储存、封存或处置),绿色交通技术(与交通有关的减缓气候变化技术)、绿色建筑技术(与建筑有关的减缓气候变化技术)、环境治理技术(减少空气污染技术、减少水污染技术、废物管理技术、土壤修复和环境监测技术)和绿色水技术(水源保护和利用技术)。
3.2 核心解释变量
本文的解释变量包括城市环境规制强度、城市经济规模、城市FDI、城市技术创新能力以及城市在绿色技术创新上的初始能力。
式中:
其次,考虑到每个城市污染物排放的差异,如果一个城市的某类污染物排放量比其他城市大,却拥有与其他城市相近的污染物处理率,可能意味着这个城市有更严格的环境法规,因此被赋予更大的环境规制权重。最后,将这3种污染物处理率的加权平均值作为城市环境规制强度的替代指标:
式中:
在城市经济规模和对外直接投资方面,本文利用城市GDP和当年实际利用外资额来描述城市经济规模和城市FDI。此外,利用研发投资来衡量城市的技术创新能力,相关数据来自《中国城市统计年鉴》。为探讨城市在绿色技术创新方面是否具有路径依赖性特征,利用1990年该市的绿色专利数量来描述其在绿色技术创新上的初始能力。国家知识产权局于1985年开始收集专利数据。考虑到前几年数据不完整,则采用1990年的数据。
3.3 其他变量
此外,基于现有绿色技术创新研究,本文增加了3个控制变量:城市市场规模、城市空气质量和城市产业结构。
作为创新环境的重要组成部分,空气质量常用于衡量城市的创新环境。经验研究表明,空气质量良好的城市往往在创新方面表现更为突出。同样,这一因素在推动区域绿色技术创新方面也得到了广泛的证明。本文以城市年均PM2.5作为城市空气质量的代理指标,数据来源于华盛顿大学大气成分分析组(Atmospheric Composition Analysis Group of Washington University)对中国PM2.5的区域估计。
表2 变量描述与数据来源
Tab. 2
| 变量 | 描述 | 数据来源 | |
|---|---|---|---|
| 被解释变量 | 绿色技术创新水平 | 绿色专利申请数量 | 万方专利数据库 |
| 核心解释变量 | 环境规制强度 | 3种污染物处理率的加权平均值 | 中国城市统计年鉴 |
| 城市经济规模 | GDP | ||
| 外商直接投资(FDI) | 当年实际利用外资额 | ||
| 技术创新能力 | 研发投资 | ||
| 城市绿色技术创新处事能力 | 1990年绿色专利数量 | 万方专利数据库 | |
| 其他解释变量 | 市场规模 | 消费品零售额 | 中国城市统计年鉴 |
| 产业结构 | 第二产业比重 | ||
| 空气质量 | 年平均PM2.5 | 华盛顿大学大气成分分析组对中国PM2.5区域估算 | |
3.4 空间相关性检验
为验证中国城市绿色技术创新是否存在空间相关性,本文利用全局Moran's I对2007—2017年中国城市绿色技术创新进行空间相关性检验:
式中:Xi和Xj分别代表i城市和j城市的绿色技术创新能力;Wij是空间加权矩阵;n是城市的数量;dij是城市i和城市j之间的距离。全局Moran's I取值范围为[-1, 1]。
4 中国城市绿色技术创新的时空特征
4.1 时序发展特征:绿色建筑技术主导中国绿色技术创新发展
2007—2017年中国绿色专利数量从87691件增长至307929件,年均增长率达到13.4%。其中,除在2010年略低于清洁能源技术外,绿色建筑技术领域的专利申请量一直位列第一,从2007年的35850件增加到2017年的105681件(图1)。2009年绿色建筑技术占整体绿色专利的比例一度达到59.5%。除了在2010年上升到第一,在2017年下降到第三,清洁能源领域的专利申请基本一直位居第二,从2007年的32352件增加到2017年的79562件。环境治理技术领域的专利申请量从2007年的第四位波动增长至2017年的第二位。2007—2017年绿色交通技术的专利申请量波动很大,曾在2009年和2011年降至最后一位,也曾在2007年、2010年和2015年上升到第三位。2017年绿色交通技术的专利申请量为16075件。温室气体处理技术和绿色水技术领域的专利申请数量相对较少且比较稳定。在时序增长上,6类技术领域专利申请量的年均增长率均超过5%。其中,环境治理技术领域最高,达到29.6%,温室气体处理技术领域也达到28.2%,绿色交通技术年均增长率最低,为5.6%。从时续发展上看,中国绿色技术创新,尤其清洁能源技术和绿色建筑技术创新在2008—2009年和2015—2016年间经历了两波急速下降期,而在2009—2010年以及2014—2015年间又迎来了两波快速发展期,究其原因可能与国家在这两类技术创新上的政策实施有关。如2007—2008年住房和城乡建设部先后发布《绿色建筑评价标识管理办法》《绿色建筑评价标准》《绿色建筑评价技术细则》和《绿色建筑评价技术细则补充说明(规划设计部分)》,提高了绿色建筑技术准入标准。2014年科技部、工业和信息化部联合组织制定了《2014—2015年节能减排科技专项行动方案》,该方案确定了6大类(工业、能源、交通、农业、绿色建筑、资源环境)节能减排关键共性技术公关重点,通过增加环境研发投资,直接促进了清洁能源和绿色建筑技术在2014—2015年间快速增长。
图1
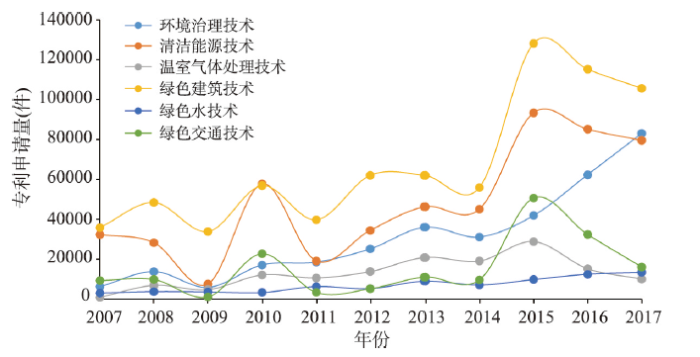
图1
2007—2017年中国城市绿色技术创新发展
Fig. 1
Development of green technology innovation in China from 2007 to 2017
表3展示了中国城市绿色创新的一些统计特征,包括6类绿色技术的变异系数和Moran's I指数。首先,在城市参与方面,中国参与绿色技术创新的城市数量从2007年的330个增加到2017年的338个,其中围绕绿色建筑技术领域创新的城市数量始终最多,而围绕温室气体处理技术进行创新的城市数量始终最少。其次,6类环境技术的变异系数在3个时间点均大于1,特别是2012年和2017年大于2,表现出强烈的离散特征。其中,清洁能源技术和绿色水技术的变化系数持续下降,环境治理技术和温室气体处理技术变异系数呈现先上升后下降的特征,绿色建筑技术与绿色交通变异系数则呈现出先下降后上升的趋势。最后,6类环境技术的Moran's I均呈上升趋势,且至研究期末皆在1%水平上显著,表明中国城市绿色技术创新的空间集聚特征日益显著,即城市绿色技术创新容易受到邻近城市的影响,从而显示出显著的空间相关效应,这一点也部分证明了本文假设4的正确性。
表3 2007年、2012年和2017年6类绿色技术的统计分析
Tab. 3
| 年份 | 指标 | 环境治理技术 | 清洁能源技术 | 温室气体处理技术 | 绿色建筑技术 | 绿色水技术 | 绿色交通技术 |
|---|---|---|---|---|---|---|---|
| 2007 | 专利申请数量(件) | 6210 | 32352 | 843 | 35850 | 3096 | 9340 |
| 参与城市数量(个) | 235 | 279 | 73 | 289 | 209 | 150 | |
| 变异系数 | 2.399 | 5.760 | 1.689 | 2.960 | 2.388 | 2.400 | |
| Moran's I | 0.193*** | 0.107*** | 0.117*** | 0.257*** | 0.111*** | 0.176*** | |
| 2012 | 专利申请数量(件) | 25173 | 34480 | 13809 | 62043 | 5279 | 5221 |
| 参与城市数量(个) | 307 | 295 | 211 | 314 | 229 | 203 | |
| 变异系数 | 2.739 | 4.263 | 2.578 | 2.601 | 2.326 | 2.050 | |
| Moran's I | 0.201*** | 0.185*** | 0.156*** | 0.326*** | 0.178*** | 0.267*** | |
| 2017 | 专利申请数量(件) | 83090 | 79562 | 10081 | 105681 | 13440 | 16075 |
| 参与城市数量(个) | 338 | 333 | 282 | 343 | 314 | 287 | |
| 变异系数 | 2.220 | 3.426 | 2.248 | 2.847 | 2.095 | 2.839 | |
| Moran's I | 0.330*** | 0.202*** | 0.266*** | 0.353*** | 0.267*** | 0.273*** |
注:***表示1%的显著性水平。
4.2 创新主体特征:企业主导中国绿色技术创新发展
根据绿色专利的申请人信息,将绿色技术创新主体识别为4个类别,即大学及科研机构、企业、个人及其他学校(小学、中学等),从而分析了2007—2017年中国城市绿色技术创新的主体特征。虽然存在其他学校作为绿色技术创新的主体,但在研究时段内,其所占比皆低于1%,因而本文不对其进行详细探讨。
2007—2017年中国绿色技术创新行为的主体特征呈现出由个人和企业并重发展为由企业单体主导,凸显了企业作为绿色技术创新主体的本质特征。2007年中国绿色技术创新主体中个人和企业占比分别为42.0%和39.7%,表明此时中国的绿色技术创新多是基于个人的研究或发明兴趣而进行。2007年大学及科研机构所占比例仅有17.7%。2012年中国绿色技术创新主体中企业所占比例快速增至62.6%,个人、大学及科研机构所占比例急剧下降,分别降至20.37%和16.81%。2017年企业所占比例继续增加至70.2%,个人所占比例继续减少至12.7%,而大学和科研机构所占比例增长至17.0%,这表明中国绿色技术创新愈发的成为企业创新行为。
然而,对于不同技术领域而言,进行绿色技术创新的主体呈现出不一样的偏好特征(表4)。虽然2012年和2017年6类技术领域的创新主体都由企业主导,但2007年环境治理技术、绿色建筑技术、绿色水技术这3个技术领域的创新主体却由个人主导,且温室气体处理技术领域的创新主体也由大学及科研机构主导。从时序发展上看,个人在6类技术领域创新主体中的比例皆呈现出逐渐下降态势,企业在6类技术领域创新主体中的比例则呈现持续增长态势,而大学及科研机构在环境治理技术、温室气体处理技术和绿色水技术领域的占比呈现先上升后下降的趋势,但在其与3类技术领域的占比则是持续增长态势。2017年,虽然个人在整个中国绿色技术创新主体中所占比例仅为11%,但在环境治理技术、温室气体处理技术和绿色水技术3个领域,其绿色技术创新的贡献率与大学和科研机构则是旗鼓相当,不相上下。
表4 2007年、2012年和2017年不同技术领域的创新主体占比特征
Tab. 4
| 技术领域 | 主体类型 | 创新主体占比(%) | |||
|---|---|---|---|---|---|
| 2007年 | 2012年 | 2017年 | |||
| 环境治理技术 | 大学及科研机构 | 13.86 | 16.78 | 15.76 | |
| 个人 | 46.55 | 17.81 | 14.63 | ||
| 企业 | 38.49 | 65.22 | 69.50 | ||
| 其他学校 | 1.10 | 0.18 | 0.11 | ||
| 清洁能源技术 | 大学及科研机构 | 13.78 | 16.79 | 18.10 | |
| 个人 | 36.97 | 20.15 | 9.68 | ||
| 企业 | 48.89 | 63.00 | 72.18 | ||
| 其他学校 | 0.36 | 0.07 | 0.04 | ||
| 温室气体处理技术 | 大学及科研机构 | 40.33 | 20.90 | 12.85 | |
| 个人 | 23.49 | 12.63 | 12.30 | ||
| 企业 | 36.18 | 66.47 | 74.46 | ||
| 其他学校 | 0.00 | 0.00 | 0.09 | ||
| 绿色建筑技术 | 大学及科研机构 | 9.06 | 9.18 | 20.84 | |
| 个人 | 46.71 | 28.61 | 7.96 | ||
| 企业 | 43.67 | 62.02 | 71.17 | ||
| 其他学校 | 0.56 | 0.19 | 0.03 | ||
| 绿色水技术 | 大学及科研机构 | 21.22 | 26.43 | 21.82 | |
| 个人 | 57.46 | 21.18 | 19.47 | ||
| 企业 | 19.70 | 51.62 | 58.56 | ||
| 其他学校 | 1.61 | 0.78 | 0.15 | ||
| 绿色交通技术 | 大学及科研机构 | 7.64 | 10.80 | 12.59 | |
| 个人 | 40.61 | 21.85 | 12.19 | ||
| 企业 | 51.01 | 67.25 | 75.13 | ||
| 其他学校 | 0.74 | 0.10 | 0.09 | ||
4.3 空间演化特征:长三角、珠三角和京津地区主导中国绿色技术创新发展
2007—2017年中国城市绿色技术创新格局呈现出强烈的空间非均衡特征,由长三角地区、珠三角地区和京津地区主导的三极格局日益突出(图2)。
图2
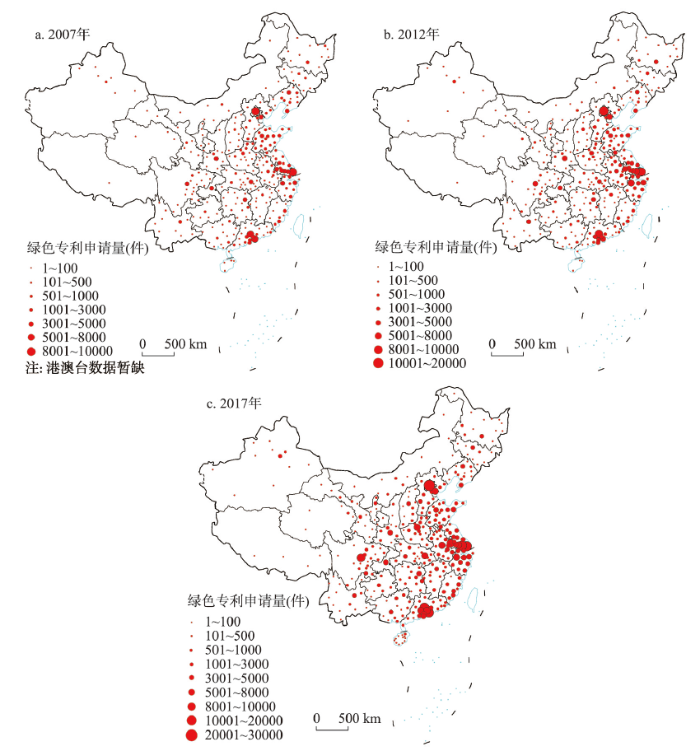
图2
2007年、2012年和2017年中国城市绿色技术创新体系时空演化格局
注:基于自然资源部标准地图服务系统GS(2016)1554号标准地图绘制,底图边界无修改。
Fig. 2
Green technology innovation pattern in China's city system in 2007, 2012 and 2017
2007年中国绿色技术创新行为高度集中在少数几个城市。在参与绿色技术创新的318个城市中,绿色专利申请量超过1000件的城市只有20个,而有70个城市的绿色专利申请量不足10件。绿色技术创新前十强城市占中国绿色专利申请量的48.1%。其中,4个位于长三角地区,3个位于珠三角地区。4个城市的绿色专利申请量超过5000件,即上海(9003件),北京(8073件),广州(6689件)和深圳(6174件)。上海在温室气体处理技术、绿色建筑技术、绿色水技术和绿色交通技术领域的专利申请量也名列第一,而北京在环境治理技术和清洁能源技术领域排名第一。此外,天津和济南分别以2488件和1908件绿色专利申请量位列第五和第八位。在不同的技术领域,表现突出城市大多都位于东部地区,中西部地区城市在绿色技术创新方面普遍落后。在环境治理技术领域,前10名城市中只有重庆和武汉来自中西部地区,分别以177件和155件绿色专利申请量排名第六和第七。在清洁能源技术领域,中西部地区只有武汉和西安位居前十强,分别以658件和615件绿色专利申请量排名第九和第十。在温室气体处理技术领域前十强中,虽然中西部地区由5个城市(重庆、沈阳、成都、太原、长沙)进入榜单,但只有重庆进入前五强。绿色建筑技术领域前十名的城市全部位于东部地区,绿色水技术和绿色交通技术领域,中西部地区只有重庆和成都进入前十名。
2012年在参与绿色技术创新的325个城市中,虽然只有34个城市的绿色专利申请量超过1000件,但绿色专利申请量少于10件的城市数量也下降至29个。绿色技术创新前10强城市占中国绿色专利申请量的比重也下降至43.3%。其中,5个位于长三角地区,2个来自京津地区,1个位于珠三角地区。北京不仅在绿色专利申请总量上超过了上海,而且在所有6个技术领域都名列第一。中西部地区的成都和西安分别以3852件和3822件绿色专利申请量位列第六和第七。同样,在不同的技术领域,表现突出的城市也大多位于东部地区。中西部地区城市绿色技术创新总体上还处于落后地位。在环境治理技术领域,前十名城市中只有成都和重庆来自中西部地区,分别以653件和562件绿色专利申请量排名第九和第十。在清洁能源技术领域,成都和西安分别以824件和777件绿色专利申请量名列第八和第九。在温室气体处理技术方面,中西部地区只有成都以402件绿色专利申请位列第九。在绿色建筑技术方面,西安和成都分别以2127件和1718件绿色专利申请量位列第五和第八位。在绿色水技术方面,中西部地区只有武汉以161件绿色专利申请量位列第七。在绿色交通技术方面,重庆、成都和武汉分别以190件、148件和134件绿色专利申请量位列第四、第八和第九位。
到2017年,在参与绿色技术创新的349个城市中,绿色专利申请量超过1000件的城市增至57个,而低于10件的城市也下降至20个。北京以26224件绿色专利申请量继续名列第一,深圳以18997件绿色专利申请量位居第二。上海、广州和苏州分别以14801件、11800件和10659件绿色专利申请量位列第三、第四和第五位。在绿色专利申请排名前10的城市中,4个位于长三角地区,3个位于珠三角地区,2个来自京津地区。中西部地区仅有成都一个城市,以9371件绿色专利申请量居全国第六位。在绿色技术的6大类中,北京在环境治理、清洁能源、温室气体处理和绿色交通技术方面仍居首位,深圳在绿色建筑和绿色水技术方面位列第一。
5 中国城市绿色技术创新的影响因素
空间自相关分析已表明中国城市绿色技术创新具有显著的空间相关性,因而本文采用空间面板回归模型来验证中国城市绿色技术创新的影响因素。基于STATA 12.0分析的空间滞后模型(SLM)、空间误差模型(SEM)和空间Durbin模型(SDM)的比较,发现3种模型中SDM的拟合优度和可信度最高,Hausman检验结果也表明固定效应的SDM是最优的。因此,本文选取具有固定效应的SDM模型来分析中国城市绿色技术创新的影响因素,模型如下:
式中:Mar_Size代表城市市场规模,以城市社会消费品零售额来衡量;Ind_Str代表城市产业结构,以城市第二产业比重来衡量;Air_Qua代表城市空气质量,按城市年均PM2.5来衡量。
由于SDM包含解释变量和解释变量的空间滞后项,采用偏微分法将SDM的溢出效应分解为直接效应、间接效应和总效应。其中,直接效应体现为对城市绿色技术创新的影响,即局部效应。间接效应反映了对周边城市绿色技术创新的影响,即溢出效应。总效应等于直接效应和间接效应之和。表5呈现了SDM模型的分析结果,R2为0.852,spatial rho在1%置信水平上显著,系数为0.213,表明中国城市绿色技术创新具有显著的正向空间溢出效应,进而证明了本文假设3的正确性。另外,为了验证结果的稳健性,将城市按区域归属划分为3个子样本(东部地区、中部地区和西部地区),并进行相同的回归分析,结果如表6所示,表明整体样本的回归结果并没有因区域差异而产生明显变异,反而呈现强劲的稳健性。
表5 中国城市绿色技术创新影响因素的SDM估计结果
Tab. 5
| 变量 | 因素 | 效应分解 | ||||
|---|---|---|---|---|---|---|
| 局部 | 溢出 | 直接 | 间接 | 总效应 | ||
| lnEnviron_Regu | 0.040** | -0.004 | 0.040* | 0.008 | 0.048** | |
| lnSize | 0.464*** | 0.196 | 0.470*** | 0.352* | 0.822*** | |
| lnIn_FDI | 0.025*** | -0.066*** | 0.036*** | -0.083* | -0.047*** | |
| lnTech_Inno | 0.082** | -0.264*** | 0.082** | -0.304*** | -0.222*** | |
| lnPatents1990 | 0.331*** | -0.218*** | 0.331*** | -0.182*** | 0.149** | |
| lnMar_Size | 0.028*** | 0.001** | 0.024*** | 0.003 | 0.027*** | |
| lnInd_Str | -0.024** | 0.012** | -0.032** | -0.018** | -0.050** | |
| lnAir_Qua | -0.013** | 0.001*** | -0.025*** | -0.013*** | -0.038*** | |
| 常数项 | -12.145*** | |||||
| spatial rho | 0.213*** | |||||
| R2 | 0.852 | |||||
| Log-likelihood | -3361.321 | |||||
注:*、**、***分别表示10%、5%和1%的显著性水平。
表6 中国城市绿色技术创新影响因素分地区SDM估计结果
Tab. 6
| 变量 | 东部地区 | 中部地区 | 西部地区 | |||||||||||||||||
|---|---|---|---|---|---|---|---|---|---|---|---|---|---|---|---|---|---|---|---|---|
| 因素 | 效应分解 | 因素 | 效应分解 | 因素 | 效应分解 | |||||||||||||||
| 局部 | 溢出 | 直接 | 间接 | 总效应 | 局部 | 溢出 | 直接 | 间接 | 总效应 | 局部 | 溢出 | 直接 | 间接 | 总效应 | ||||||
| lnEnviron_Regu | 0.120** | -0.012 | 0.118* | 0.014 | 0.132** | 0.101** | -0.084 | 0.096* | 0.012 | 0.108** | 0.061** | -0.042 | 0.071* | 0.009 | 0.080** | |||||
| lnSize | 0.556*** | 0.301 | 0.561*** | 0.421* | 0.982*** | 0.501*** | 0.305 | 0.475*** | 0.384* | 0.859*** | 0.356*** | 0.212 | 0.253*** | 0.114* | 0.367*** | |||||
| lnIn_FDI | 0.124*** | -0.101** | 0.134*** | -0.218* | -0.084** | 0.113*** | -0.097** | 0.112*** | -0.179* | -0.067** | 0.012** | -0.003** | 0.103*** | -0.184* | -0.081** | |||||
| lnTech_Inno | 0.113** | -0.125*** | 0.098** | -0.202*** | -0.104** | 0.089** | -0.101** | 0.074** | -0.152** | -0.078** | 0.054** | -0.075** | 0.064** | -0.102** | -0.038** | |||||
| lnPatents1990 | 0.421*** | -0.125*** | 0.405*** | -0.101*** | 0.304** | 0.301*** | -0.134** | 0.374*** | -0.124** | 0.250** | 0.184*** | -0.084** | 0.191*** | -0.118** | 0.073** | |||||
| lnMar_Size | 0.101*** | 0.009** | 0.111*** | 0.045 | 0.156*** | 0.076*** | 0.011** | 0.086*** | 0.018 | 0.104*** | 0.043*** | 0.007** | 0.051*** | 0.009 | 0.060*** | |||||
| lnInd_Str | -0.085** | 0.026** | -0.078** | -0.035** | -0.113** | -0.124** | 0.041** | -0.121** | -0.038** | -0.159** | -0.256** | 0.081** | -0.351** | -0.042** | -0.393** | |||||
| lnAir_Qua | -0.026** | 0.004*** | -0.031** | -0.017** | -0.048** | -0.018** | 0.003*** | -0.017** | -0.009** | -0.026** | -0.002** | 0.001*** | -0.001** | -0.001** | -0.002** | |||||
| 常数项 | -18.311*** | -15.412*** | -19.536*** | |||||||||||||||||
| spatial rho | 0.401*** | 0.315*** | 0.241*** | |||||||||||||||||
| R2 | 0.912 | 0.898 | 0.817 | |||||||||||||||||
| Log-likelihood | -4538.511 | -3484.977 | -2984.153 | |||||||||||||||||
注:*、**、***分别表示10%、5%和1%的显著性水平。
(1)环境规制和市场规模具有显著的正局部效应,这证明了本文研究假设1的正确性。环境规制的直接效应为0.040,市场规模的直接效应为0.024,显著性水平为1%。这意味着,城市环境规制强度提高1%时,城市绿色技术创新能力提高0.040%,城市市场规模扩大1%时,城市绿色技术创新能力提高0.024%。另外,虽然环境规制和市场规模的间接效应都是正向的,但都没有通过显著性检验,说明环境规制和市场规模对城市绿色技术创新的影响不存在明显的溢出效应。环境规制对中国城市绿色技术创新显著的促进作用证明了企业层面的“波特假说”在城市层面同样存在,同时其不显著的邻近效应也呼应了当前环境规制与城市绿色发展效率关系研究的结论,即环境规制对城市绿色发展效率的空间溢出效应有限。
(2)城市规模和空气质量有利于促进城市本身及其周边城市的绿色技术创新,这证明了本文假设4的正确性。城市规模和城市空气质量的直接影响分别为0.470和-0.025,两者在1%的重要水平上都具有重要意义。也就是说,城市规模每增加1%,城市空气质量每增加1%(城市PM2.5每减少1%),城市绿色技术创新能力就会增加0.470%或0.025%。城市规模和城市空气质量的间接影响分别为0.352和-0.013,均通过了显著性检验,即城市规模每增加1%,城市空气质量每增加1%(城市PM2.5每下降1%),周边城市的绿色技术创新能力将提高0.352%或0.013%。城市规模对于城市绿色技术创新的正向影响验证结果,与当前关于企业绿色技术创新与企业规模关系,以及区域绿色技术创新与区域规模的关系的研究发现是一致的[47,75]。经济规模较大的城市往往能够投入更多资本进行技术创新,也往往具备更加完善的技术创新基础设施。面对环境问题,经济实力强劲的城市也率先承担环境治理、污染减排、产业结构转型升级的重任,在绿色发展和绿色技术创新上也是走在最前列。如北京,上海为落实国家发展改革委、科技部《关于构建市场导向的绿色技术创新体系的指导意见》,在2020年相继制定了《北京市构建市场导向的绿色技术创新体系实施方案》和《上海市构建市场导向的绿色技术创新体系实施方案》。另外,上文关于中国绿色技术创新的空间分布特征也显示出东部经济发达的城市往往申请更多的绿色专利。
(3)FDI、研发投资和城市初始绿色技术创新能力都显示出积极的局部效应和负面的溢出效应,这与已有的研究成果一致[31,76],也证明了本文假设2和假设4的正确性。其中,FDI的直接效应为0.036,在1%的显著水平上具有显著意义,即城市吸收的FDI每增长1%,城市绿色技术创新能力就会提高0.036%。但是,FDI的间接效应为-0.083,在10%的意义水平上具有显著意义,即城市吸收的FDI每增长1%,周边城市的绿色技术创新能力就会下降0.083%。研发投资的直接影响为0.082,表明本市研发投资每增长1%,绿色技术创新能力就会提高0.082%,研发投资的间接效应是-0.304,即本市研发投资每增长1%,周边城市的绿色技术创新能力就会下降0.304%。城市吸收的外来资本越多,代表其经济结构的外向程度越高。创新扩散、技术转移等创新经济学理论广泛揭示出FDI与区域创新能力间存在正相关关系。同时,环境经济学也揭示出跨国公司比本土企业更倾向于从事绿色技术创新活动。城市研发投资规模代表城市的技术创新能力,创新能力强的城市在区域创新经济发展中能够形成强劲的资源集聚效应,使周边城市的人才、资本等创新要素向该城转移,从而抑制周边城市的绿色技术创新,进而形成竞争机制。城市初始绿色技术创新能力的直接效应为0.331,间接效应为-0.182,两者在1%的意义水平上都具有重要意义,表明城市绿色技术创新具有较强的路径依赖性特征,也反映出前期绿色技术创新表现良好的城市也会形成虹吸效应,从而制约周边城市的绿色技术创新。
6 结论与讨论
6.1 结论
绿色技术创新不仅可持续发展的基石,也是中国创新发展和绿色发展相结合的纽带。本文以绿色专利申请数量作为城市绿色技术创新能力的替代指标,探讨了2007—2017年中国城市绿色技术创新活动的时空分布特征及其影响因素,得出以下结论:
(1)2007—2017年无论是在绿色专利申请量上还是城市参与度上,绿色建筑技术一直主导中国绿色技术创新发展,而围绕温室气体处理技术和绿色水技术领域的绿色技术创新较少。此外,中国城市绿色技术创新的两极分化显著,并呈现强劲的空间相关性。
(2)2007—2017年中国绿色技术创新行为的主体特征呈现出由个人和企业并重,发展为由企业单体主导,凸显了企业作为绿色技术创新主体的本质特征。然而,对于不同技术领域而言,进行绿色技术创新的主体呈现出不一样的偏好特征。至2017年,6类技术领域的创新主体都由企业主导,而在在环境治理技术、温室气体处理技术和绿色水技术3个领域,大学和科研机构和个人的绿色技术创新贡献率则是旗鼓相当,不相上下。
(3)2007—2017年中国城市绿色技术创新空间差异显著,表现突出的城市大多位于东部地区,中西部地区城市绿色技术创新能力普遍落后。另外,在以长三角、珠三角、京津地区为主导的三极格局日益凸显的进程中,北京和深圳超越上海成为中国环境绿色技术的代表城市,其中北京在环境治理、清洁能源、温室气体处理和绿色交通技术方面较为突出,深圳在绿色建筑和绿色水技术方面较为突出。
(4)空间SDM模型回归结果表明了中国城市绿色技术创新具有显著的空间溢出效应和路径依赖性特征。其中,环境规制和市场规模对城市绿色技术创新具有显著的正局部效应,但溢出效应不明显;城市规模和城市空气质量不仅有利于促进城市绿色技术创新自身,还有利于其周边城市的环境创新;城市FDI、城市研发投入和城市初始绿色技术创新能力均表现出正的局部效应和负的溢出效应,凸显出城市资本投入对城市绿色技术创新的“虹吸效应”;而以第二产业为主的产业结构对城市绿色技术创新具有明显的抑制作用。
6.2 讨论
本文通过借鉴OECD的绿色专利搜索策略,以绿色专利申请量从城市尺度对中国绿色技术创新的时空演化特征进行了初步研究,将当前集中于企业层面的绿色技术创新研究拓展至空间尺度,丰富了环境经济地理的研究内容。但无论是研究视角、数据基础还是分析框架,依然存在诸多尚待改进的地方:
(1)本文以绿色专利衡量城市绿色技术创新实践,仅仅涉及绿色技术创新产出这一个维度,且也仅仅是绿色技术创新产出这一维度中的一个方面。城市绿色技术创新不仅仅是绿色专利发明,还包含绿色技术创新投入、绿色技术创新管理、绿色技术创新服务等。除此之外,本文以绿色专利申请量作为具体评价指标虽注重了绿色技术创新的前期投入,但忽视了绿色技术创新后期的实际产出,即绿色专利授权量。因此在今后的研究中,一方面需综合考虑绿色专利申请量、绿色专利授权量、绿色专利申请/授权比等指标,另一方面也需要充分借鉴环境经济学、创新经济学等领域的研究,拓宽城市绿色技术创新的评价维度和评价体系。
(2)本文虽然通过专利申请人地址将绿色专利分配至中国城市尺度,但忽视了企业或科研机构本身的空间区位,以及这些机构在申请专利时的策略行为。比如中国绿色技术创新活动的空间分布特征实则与中国绿色企业的空间分布特征,或从事污染减排、环境保护研究的科研机构的空间分布特征高度相关;再比如一些大型企业的子公司申请专利时,时常以总公司作为专利申请人,这就可能造成绿色专利申请的空间特征与实际绿色技术创新活动的空间特征不符。
(3)本文虽然应用空间杜宾模型发现城市绿色技术创新存在一定的空间溢出效应,但并未能揭示其空间溢出路径和空间溢出距离。首先,知识溢出的空间邻近特征在创新经济地理研究领域被广泛揭示,那么绿色技术创新的空间溢出半径(距离)如何还有待深入阐释。其次,一般技术创新的空间溢出路径,如产学研合作、技术转移、创新扩散、人员流动等也在诸多研究中得到一一阐释,那么绿色技术创新空间溢出的路径或通道是否与一般技术创新一致还有待更多的实证研究进行验证。
同时,相较于经济学、管理学等学科领域的研究,环境经济地理学的绿色技术创新研究还有诸多有待加强、或者值得进一步探讨的方向:
(1)如何凸显绿色技术创新的企业主体特征。企业是绿色技术创新的主体特征不仅在经济学、管理学的研究中被广泛证明,在环境经济地理研究中也被再三验证。本文研究结果中显示,绿色建筑技术始终主导中国绿色技术创新发展,同时中国城市绿色技术创新呈现显著的空间差异,这是否与中国绿色技术创新企业行业分布特征以及空间分布特征有关还有待更多深入的研究。因而在今后的环境经济地理研究中,企业绿色技术创新的空间差异及其影响因素研究应当成为研究重点。同时也应将企业异质性纳入分析框架,探讨企业异质性与企业绿色技术创新的空间差异、空间关联、空间溢出等问题。
(2)如何凸显绿色技术创新体系的市场导向特征。《关于构建市场导向的绿色技术创新体系的指导意见》和《中华人民共和国国民经济和社会发展第十四个五年规划和2035年远景目标纲要》相继提出要构建市场导向的绿色技术创新体系研究。在创新经济学研究中已经发现市场驱动因素对企业绿色技术创新有明显的促进作用,本文也揭示了FDI与城市绿色技术创新间的正相关关系,但这相对于建构市场导向的绿色技术创新体系这一政策实践而言,基础研究还相对缺乏,如市场导向的绿色技术创新体系内涵、特征及其包含内容还有待阐释,绿色技术的市场交易行为和交易机制也有待揭示,绿色技术创新中机构合作、跨区域合作行为也有待发现等。
参考文献
A comparative research of the spatial-temporal evolution track and influence mechanism of green development in China
DOI:10.11821/dlyj020190057
[本文引用: 1]

The green development strategy is not only an important part of realizing the coupling and coordination of regional economy-society and resource environment, but also an important path to promote regional man-earth coordination. British economist David Pierce's book "Green Economy Blueprint" first introduced the concept of "green economy" in 1989. Since the financial crisis, green development has become an important consensus for improving economic competitiveness, coping with financial crisis and solving resource and environmental problems. Many developed countries and regions such as the European Union, the United States and Japan have begun to formulate a series of strategic plans centered on green energy technologies and green manufacturing industries. These plans actively promote the green new policy and open a new era of the green industrial revolution, with a view to achieving a green economy. The economy is recovering and is in a dominant position in the new round of global fierce competition. China faces more severe resource and environmental pressures than other countries. The special national conditions determine that China must implement sustainable development strategy. The “13th Five-Year Plan” (2016-2020) also clearly stated that “green is a necessary precondition for sustainable development and an important manifestation of the people’s pursuit of a better life”. After more than half a century of theoretical and practical evolution, green development is moving from one-dimensional to multi-dimensional, from simple to complex, and is a useful exploration of the sustainable development model. The study uses the projection pursuit evaluation model (PPM) and Gini coefficient, coefficient of variation, spatial autocorrelation and spatial measurement to analyze the temporal and spatial evolution trajectories and impact mechanisms of green development in 30 provincial areas of China, and draws the following conclusions: (1) Green development includes the three dimensions of “green growth-green welfare -green wealth”. Synergistic and balanced development of the three dimensions is the essential feature and inherent requirement of green development; (2) China's green development index is on the rise year by year, but the growth rate is low. Although the green development has achieved remarkable results, problems and pressures still exist. Both the green growth and the green welfare index showed an increasing trend, with an average annual growth rate of 5.77% and 11.74% respectively. The overall green wealth index is relatively low and slowly grows. To a certain extent, it reflects that the growth of the green wealth index is an arduous and long-term task; (3) The regional differences in green development and its composition index are gradually shrinking, but regional differences are still large, featured by eastern region > northeast region > western region > central region. The spatial distribution of green wealth and green development and other branch index is misplaced, and the characteristics of high-high and low-low spatial agglomeration are obvious; (4) Urbanizational level, industrial structure, population density, technological innovation, marketization, and international trade are the main factors affecting China's green development. The research proposes countermeasures from the aspects of ecological culture value, ecological economic construction, ecological environmental protection, resource and environmental carrying capacity and space governance system. It has certain reference value for China's ecological civilization construction and green development.
中国绿色发展时空演变轨迹与影响机理研究
DOI:10.11821/dlyj020190057
[本文引用: 1]
绿色发展战略既是实现区域经济社会与资源环境耦合协调的重要内容,也是推进区域人地协调的重要路径。研究运用投影寻踪评价模型(PPM)以及基尼系数、变异系数、空间自相关和空间计量等方法分析中国30个省市区绿色发展时空演变轨迹与影响机理,得出以下结论:① 构建涵盖“绿色增长-绿色福利-绿色财富”三个维度的绿色发展系统,三个维度的协同一致和均衡发展是绿色发展的本质特征和内在要求;② 中国绿色发展指数呈逐年上升趋势,但增长速度较低,绿色发展虽然取得了显著成效,但问题与压力依然严峻。绿色增长和绿色福利指数均呈现增长趋势,年均增长率分别为5.77%、11.74%,绿色财富指数整体相对较低且增长缓慢,一定程度上反映了绿色财富指数增长的艰巨性和长期性;③ 绿色发展及其构成指数的区域差异呈逐渐缩小趋势,但差异程度依然较大,总体呈东部地区>东北地区>西部地区>中部地区的特征,绿色财富与绿色发展及其他构成指数空间分布错位,高高、低低空间集聚特征明显;④ 城镇化水平、产业结构、人口密度、科技创新、市场化、国际贸易是影响中国绿色发展的主要因素。研究从塑造生态文化理念、发展生态高效产业、提升资源环境承载能力和优化空间治理体系等方面提出对策建议,对中国生态文明建设和绿色发展推进具有一定的借鉴参考价值。
Spatio-temporal evolution and influencing factors of urban green development efficiency in China
DOI:10.11821/dlxb201910006
[本文引用: 1]
Green development is pivotal to resolving natural environmental constraints, solving national economic transition, and supporting and realizing the United Nations sustainable development goals. It is gradually growing into a crucial guideline for China's ecological civilization construction, "Beautiful China" development, and global economic transition and restructure. Based on a thorough review of the concept of green development, this paper accurately depicts a full picture of China's spatio-temporal patterns of urban green development efficiency (UGDE) in 2005-2015 by using SBM-Undesirable, the Theil index and the Spatial Markov Chain methods. Moreover, the influencing mechanism has been further discussed based on a quantitative analysis of both natural and human factors. Our results demonstrate that: (1) UGDE increased steadily by 10% from 0.475 in 2005 to 0.523 in 2015. And temporally, it shows a pattern of "W"-shaped fluctuated growth. (2) Spatially, UGDE decreased from eastern to central China, and further to western China. Besides, there is an inverted pyramid pattern of "national level > regional level > local level" urban agglomeration in UDGE growth. Moreover, there is a steady urban scale structure from super city to small city in UDGE. (3) There is an evident concentration of cities with high-level and low-level UDGE, indicating a significant influence of path dependence. (4) Quantitatively speaking, compared to natural factors, human factors such as economy size, industry structure, and openness level play a more important role in influencing the UDGE.
中国城市绿色发展效率时空演变特征及影响因素
DOI:10.11821/dlxb201910006
[本文引用: 1]
绿色发展作为化解自然环境约束、破解经济转型难题、支撑和实现全球可持续发展目标(SDGs)关键。正逐渐成为中国生态文明建设、美丽中国建设和全球经济转型与重构的重要指导理念。在梳理绿色发展概念与内涵基础上,采用SBM-Undesirable模型、泰尔指数和空间马尔科夫链等方法,对2005-2015年中国城市绿色发展效率时空分异特征及其演变过程进行了测度与刻画,并进一步耦合自然与人文因素定量探讨了人地关系地域系统下的影响机制。研究表明:① 2005-2015年中国城市绿色发展效率稳步提升,由0.475增加到0.523,总体提高了10%,时序上呈现“W”型波动增加的阶段性演变特征。② 中国城市绿色发展效率呈现出“东中西”阶梯状递减的区域差异规律,不同类型城市群具有“国家级>区域性>地方性”倒金字塔式集群增长特征,形成了“超大城市>特大城市>大城市>中等城市>小城市”稳定等级规模结构。③ 中国城市绿色发展效率空间集聚特征显著,高效率城市存在正向溢出效应,低效率城市则负向溢出影响,“高高集聚、高带动低”的空间俱乐部趋同现象较为凸显,不同类型城市演化存在显著的路径依赖与时空惯性。④ 人地关系地域系统视角下,人文社会因素对城市绿色发展效率影响程度大于自然本底要素,其中经济实力、产业结构、开放程度和城市气温呈现积极促进作用。
Environmental innovation for sustainable development: The role of China
DOI:10.1002/sd.1587 URL [本文引用: 1]
Energy innovation and renewable energy consumption in the correction of air pollution levels
DOI:10.1016/j.enpol.2017.03.009 URL [本文引用: 1]
Consumption-based carbon emissions and international trade in G 7 countries: The role of environmental innovation and renewable energy
Spatial pattern and spillover effects of green development efficiency in China
DOI:10.13249/j.cnki.sgs.2018.11.006
[本文引用: 1]
:The concepts of innovation, coordination, green, open and sharing are the keys to the development of China and even the future. Green development is the main tone of the 13th Five-Year Plan of China, and it emphasizes on the mutual unity and coordinated development between economic growth and environmental protection. It is a kind of human-oriented way of sustainable development. Improving the efficiency of green development is an important way to achieve the ecological civilization construction and transformation of economic development the important way. This study used the spatial analysis methods, such as the Super-SBM model, spatial autocorrelation, spatial variation functions and spatial durbin model to measure the green development efficiency from 2005 to 2015 in China (Tibet, Hong Kong, Macao and Taiwan are excluded), by building an input and output index system of green development efficiency. In addition, from the perspective of geography space, it revealed the spatial pattern and spillover effects of green development efficiency in China. The results showed that: 1) From 2005 to 2015, the efficiency of China’s green development is characterized by the stage characteristics of ‘stable at beginning, then fast and last stable again’. It shows an overall upward trend with large differences among regions. The regional differentiation of the ‘East-Central-West’ stepwise decreasing and the ‘South-Central-North’ symmetrical distribution, and ‘T’ shaped shaft development pattern is particularly evident. 2) There is a positive correlation between green development efficiency, the degree of spatial agglomeration gradually decreases, the hot spots increase, the eastern coastal areas form stable hot spots, and the central and western parts form stable cold spots. 3) The spatial self-organization of green development efficiency is more and more strong, the space difference is gradually increased, the structural differentiation caused by spatial autocorrelation is more obvious, the spatial heterogeneity caused by random components is gradually weakened, and the space between northwest and southeast Significant difference. 4) There is a significant spillover effect of green development efficiency, a significant positive effect on the level of economic development, and a significant negative effect on industrial structure, urbanization and technological innovation. Trying hard to explore the law of spatial evolution of green development and provide a reference for the coordinated green development of the three systems of regional economy, society and environment.
中国绿色发展效率的空间特征及溢出分析
DOI:10.13249/j.cnki.sgs.2018.11.006
[本文引用: 1]
提高绿色发展效率是建设生态文明、促进经济转型发展的重要途径。基于Super-SBM模型对中国(除港、澳、台、西藏地区)2005~2015年绿色发展效率进行测度,从空间异质、空间关联与空间机理3个方面分析绿色发展效率的空间特征,运用空间杜宾模型验证绿色发展效率的溢出效应并探讨各要素的空间传导机制。结果表明:① 2005~2015年,中国绿色发展效率表现为“先平稳再快速再稳定”的阶段性变化规律,地区间差异较大,形成了“东-中-西”阶梯式递减和“南-中-北”对称式分布的空间分异特征,“T”字型发展格局逐渐凸显。② 绿色发展效率存在显著的空间正相关,空间集聚程度逐步降低,热点区域增加,东部沿海地区形成稳定的热点区,中西部形成稳定的冷点区。③ 绿色发展效率的空间自组织性逐渐增强,空间差异不断扩大,由空间自相关导致的结构化分异更加明显,随机成分引起的空间异质性正逐渐减弱,西北-东南是空间差异的主要方向。④ 绿色发展效率存在较强的空间溢出效应,经济水平、技术创新和能源强度产生明显正向效应,产业结构则具有显著负向效应。
Analysis and outlook of the related researches on green innovation
绿色创新相关研究的梳理与展望
Some comments on research of environmental innovation
对环境创新研究的一些评论
A survey of the literature on environmental innovation based on main path analysis
DOI:10.1111/joes.12149 URL [本文引用: 2]
Green technology innovation efficiency and factor decomposition of China's industrial enterprises
中国区域工业企业绿色技术创新效率及因素分解
Research on policy effect of industrial enterprises environmental technology innovation in China
中国工业企业环境技术创新的政策效应
Exploring the driving orientations and driving mechanisms of environmental innovation: The case study of the China Gezhouba
Diffusion of eco-innovations: A review
DOI:10.1016/j.rser.2014.01.083 URL [本文引用: 1]
Green innovation in technology and innovation management: An exploratory literature review
On the interaction between imperfect compliance and technology adoption: Taxes versus tradable emissions permits
DOI:10.1007/s11149-010-9125-0 URL [本文引用: 1]
Regional eco-innovation in China: An analysis of eco-innovation levels and influencing factors
Green innovation efficiency across China's 30 provinces: Estimate, comparison, and convergence
DOI:10.1007/s11027-019-09903-3 URL [本文引用: 1]
Evolution pattern and impact factors of environmental innovation in the Yangtze River Economic Belt
DOI:10.13249/j.cnki.sgs.2021.07.006
[本文引用: 1]
The “T” structures in China’s territorial development and economic layout remain to be the two areas with the greatest potential for economic growth in China, among which the Yangtze River Economic Belt is the only first-class development axis across the three plates of East, Central and West. Over the years, in the excessive pursuit of rapid economic growth, the Yangtze River and its two sides of the great lakes and major tributaries have suffered serious environmental pollution, ecosystem imbalance, and frequent water security problems. To pay attention to the great protection together and not to engage in the great development is the guideline for the construction of the green Yangtze River Economic Belt, and the environmental innovation is the core support of the green development of the economic belt of the Yangtze River. In this paper, the spatial and temporal characteristics of environmental innovation in the Yangtze River Economic Belt are explored by taking the number of green patent applications as the evaluation index, and the influencing factors are also revealed. The results are as follows. First, from 2007 to 2017, the number of green patent applications in the Yangtze River Economic Belt increased from 35422 to 47563, among which the number of patent applications in the field of green building technology always ranked first. In addition, the environmental innovation of Yangtze River Economic Belt has significant spatial correlation effect. Second, in terms of spatial pattern, the environmental innovation of the Yangtze River Economic Belt was dominated by the eastern region, and shows the characteristics of development from the East to the West. Third, environmental innovation in the Yangtze River Economic Belt has significant spatial spillover effects. The intensity of environmental regulations, technological innovation level, city scale, the proportion of tertiary industry, and urban air quality all have a significant positive role in promoting the urban environmental innovation capacity of the Yangtze River Economic Belt. The intensity of environmental regulation does not have obvious spatial spillover effects, and the level of urban technological innovation has significant negative spillover effects.
长江经济带环境创新的时空特征及其影响因素
DOI:10.13249/j.cnki.sgs.2021.07.006
[本文引用: 1]
以绿色专利申请量为评价指标对长江经济带环境创新的时空特征进行了多维度挖掘,并揭示了其影响因素,研究发现:① 时序发展上,长江经济带环境创新空间集聚特征显著,绿色建筑技术始终主导长江经济带环境创新演化发展;② 空间演化上,长江经济带环境创新格局整体表现为由东部地区主导,并呈现出由东向西的阶梯推进的发展特征,且呈现出显著的空间关联性;③ 长江经济带环境创新具有显著的空间溢出效应,环境规制强度、技术创新水平、城市规模、第三产业比重和环境质量皆对长江经济带城市环境创新能力有着显著的正向促进作用,但环境规制强度不具有明显的空间溢出效应,且技术创新水平具有显著的负向溢出效应。
Technological pervasiveness and variety of innovators in Green ICT: A patent-based analysis
DOI:10.1016/j.respol.2014.06.004 URL [本文引用: 1]
Key success factors of green innovation for transforming traditional industries
// Matsumoto M, Masui K, Fukushige S, et al.
Towards sustainable competitiveness: comparison of the successful and unsuccessful eco-innovators
Corporate culture, environmental innovation and financial performance
DOI:10.1002/bse.2186 URL [本文引用: 1]
Studies on spatial heterogeneity effects of environmental regulation instruments: Spatial empirical analysis from the perspective of transformation of government functions
环境规制工具的空间异质效应研究: 基于政府职能转变视角的空间计量分析
Does command-and-control regulation promote green innovation performance? Evidence from China's industrial enterprises
Spatial differentiation and driving factor of green development efficiency of chemical industry in Yangtze River Economic Belt
DOI:10.2307/142594 URL [本文引用: 1]
长江经济带化工产业绿色发展效率的空间分异及驱动因素
Impact of environmental regulations on the cities' efficiency of industrial green development in Yangtze River Economic Belt
环境规制对长江经济带城市工业绿色发展效率的影响研究
Spatial differentiation and mechanism of technological innovation affecting environmental pollution in major Chinese cities
DOI:10.13249/j.cnki.sgs.2021.01.014
[本文引用: 1]
Technological innovation and environmental protection are two major themes of urban development at present. However, it is still controversial question that whether technological innovation can reduce environmental pollution and improve the ecological environment. This article holds that this debate is meaningless without considering spatial scale and factors. Therefore, it is necessary to study the spatial differentiation and mechanism of the impact of urban technological innovation on environmental pollution. In this study, based on the data of 285 cities (excluding those in autonomous prefectures, Hong Kong, Macau and Taiwan) at prefecture level and above in China, the spatial autocorrelation model is used to analyze the spatial correlation between technological innovation and environmental pollution at global and local scales, geographically weighted regression model is used to analyze the regional differences of the impact of technological innovation on environmental pollution, and Geodetector is used to analyze its influence mechanism. The results show that: 1) Both technological innovation and environmental pollution have significant spatial agglomeration, they have positive spatial correlation on the global scale, while positive and negative correlation coexist on the local scale. And there are 4 agglomeration types: high innovation-high pollution, low innovation-low pollution, high innovation-low pollution, low innovation-high pollution. 2) Technological innovation of all cities in the study area has a negative impact on environmental pollution, and the impact degree presents a spatial differentiation pattern with increasing impact degree from east to west. The calculation results of the existing samples conditionally verify the EKC curve, that is, technological innovation can promote the healthy development of economy and environment, and technological innovation in the eastern region can accelerate the arrival of EKC inflection point. 3) Environmental pollution is the result of many factors. Economic development, industrial structure, human capital, foreign direct investment and environmental regulation can all strengthen the effect of technological innovation on improving environmental pollution. The impact of technological innovation on environmental pollution is more to optimize industrial structure through technological progress, thereby reducing environmental pollution.
中国主要城市技术创新影响环境污染的空间分异与机理
DOI:10.13249/j.cnki.sgs.2021.01.014
[本文引用: 1]
基于中国285个地级及以上城市的数据,利用空间自相关模型,在全域和局域尺度分析技术创新与环境污染的空间关联,在此基础上,使用地理加权回归模型分析技术创新对环境污染影响程度的地区差异,并借助地理探测器分析其影响机理。研究结果表明:① 技术创新与环境污染均存在显著的空间集聚性,二者在全域尺度上存在正向的空间关联,在局域尺度上正向和负向关联并存,具有高创新-高污染、低创新-低污染、高创新-低污染、低创新-高污染4种集聚类型。② 所有城市的技术创新对环境污染均存在负向影响,影响程度呈现出由东向西渐次递增的空间分异格局,现有样本计算结果有条件地支持EKC曲线,技术创新能够促进经济与环境的良性发展。③ 环境污染是多种因素共同作用的结果,经济发展、产业结构、人力资本、外商直接投资、环境规制均能强化技术创新对环境污染的改善作用,技术创新对环境污染的影响更多的是通过技术进步优化产业结构,从而减少环境污染。
Transfer characteristics, patterns and mechanisms of polluting enterprises and industries
DOI:10.11821/dlyj020190637
[本文引用: 1]
The transfer of polluting enterprises/industries has reshaped regional development pattern and changed the distribution of environmental pollution, which has a significant impact on regional sustainable development. The research on this transfer is of great significance for pollution control and regional coordinated development. Based on literature review, the article generalizes systematically the concepts and categories of polluting enterprises/industries and summarizes their transfer characteristics, laws, patterns and dynamic mechanisms. The review of the literature showed that: (1) official documents, pollution emission intensity, pollution emission scale are the main basis of polluting enterprises/industries definition and classification. (2) Polluting enterprises/industries form different transfer patterns on different geographical scales, and they transfer in municipal, provincial, and national scales. Three modes (decentralized peripheral areas transfer, centralized functional areas transfer, and moving away from sensitive areas) are formed within the city. The polluting enterprises/industries transfer both from developed cities to less developed cities and from areas with strong environmental regulations to marginal areas with weak environmental regulations among the cities in the province. Neighboring province has the transfer mode that is centered on developed provinces with stronger environmental regulations and spread to neighboring provinces. This transfer pattern has three paths that tend to move to the boundary of multiple provinces, move from the upstream provinces of the river to downstream provinces and move to secondary cities along the traffic line. Inter-provincial transfer of the polluting enterprises/industries forms three modes of cost-oriented, market-expanding and policy-driven factors. ③ The transfer direction of the polluting enterprises/industries presents certain characteristics and laws. We conclude fifteen kinds of transfer directions based on regional, geographic, economic, functional areas, and policy perspectives. (4) The transfer modes of polluting enterprises includes overall transfer and partial transfer. The partial transfer includes migration of production base, process outsourcing, green mergers and acquisitions, establishment of subsidiaries or branches, etc. (5) Economic, social, geographical and policy factors not only affect the transfer of polluting enterprises/industries separately, but also comprehensively form the complex transfer mechanism. In the multi-dimensional complex influence mechanism, the government plays an important role and enterprise heterogeneity, spatial agglomeration effect and system have a significant impact. Finally, the shortcomings of relevant domestic research are discussed, and some thoughts and policy recommendations for polluting enterprise/industry transfer are proposed.
污染企业/产业转移的特征、模式与动力机制
DOI:10.11821/dlyj020190637
[本文引用: 1]
污染企业/产业的转移不仅重塑了区域发展格局,也改变了环境污染的分布,对区域可持续发展产生了显著影响。探讨污染企业/产业转移对于污染治理和区域协调发展具有重要意义。基于对相关文献的梳理,系统归纳了污染企业/产业的概念和类别,总结了污染企业/产业的转移特征、模式和动力机制。研究表明:① 官方文件、污染排放强度、污染排放规模是污染产业界定和分类的主要依据。② 污染企业/产业在不同的地理尺度上形成不同的转移模式:在城市内部形成分散式外围区转移、集中式功能区转移、远离敏感区转移三种模式;在省内城市间呈现出由发达城市向欠发达城市、由环境规制强的核心区向环境规制弱的边缘区的转移特征。邻省转移模式以经济较发达和环境规制较强的省份为中心,向邻近省份扩散,并形成向多省交界处、由河流上游省份向下游省份、沿交通线向次级城市的三种转移路径。跨省转移形成成本导向型、市场扩张型和政策推动型三种模式。③ 污染企业/产业的转移方向呈现出一定的特征和模式,包括区域、地理、经济、功能区、政策5种研究视角和15种转移方向。④ 污染企业的迁移方式包括整体迁移和部分迁移两种模式,后者包括迁移生产基地、工序外包、绿色并购与对外收购、建立子公司或分厂等。⑤ 影响污染企业/产业转移的因素既包括经济、社会、地理、政策等单因素,也包括多种因素的交互作用。在多维的复杂影响机制中,政府扮演了重要角色,企业的异质性、空间集聚效应、制度等都产生了重要的影响。最后讨论了国内相关研究的不足,并在此基础上提出一些思考和建议。
Environmental regulation, local protection and the spatial distribution of pollution-intensive industries in China
DOI:10.11821/dlxb201810010
[本文引用: 1]
Pollution-intensive industries can promote regional economic growth. They also pose a great threat to regional environmental system. Polluting industries may be protected by regional policies due to their contribution to economic growth, but the local governments may also impose some restrictions and controls on them by means of the environmental regulations. From 1980 to 2014, the development period of pollution-intensive industries in China can be divided into three stages: slow growth, rapid expansion, and structural transition. The spatial distribution of pollution industries changed from dispersal to concentration and then to decentralization. The central provinces such as Henan, Hubei, Hunan and Jiangxi have become the major areas of pollution-intensive industries transfer. By establishing the regional attribute model and the regional-industrial interaction model, this paper quantitatively analyzes the influence of environmental regulation and local protection on the spatial distribution of the pollution-intensive industries in China during 2001-2014, and tests whether there exist the pollution haven hypothesis and the Porter hypothesis. Environmental regulation and local protection are important factors that influence the spatial distribution of polluting industries, but there exists obvious industrial and regional heterogeneity. Industries with a high degree of pollution are more likely to be affected by environmental regulations, and industries with high share of state ownership are more likely to be protected by local governments. Environmental regulation and local protection are two opposite forces, which have the effect of mutual inhibition and weakening. The roles of environmental regulation and local protection in coastal and inland areas have significant differences. The effect of environmental regulation is more prominent in eastern China, while that of local protection in central and western China is more significant. In order to prevent the central and western regions from being the "pollution haven" and to realize the win-win between economic growth and environmental protection, a differentiated policy should be formulated according to local conditions and the development stage.
环境规制、地方保护与中国污染密集型产业布局
DOI:10.11821/dlxb201810010
[本文引用: 1]
污染密集型产业在促进区域经济增长的同时会对区域生态环境带来巨大威胁,其发展布局会受到地方保护和环境规制的双重影响。1980-2014年中国污染密集型产业的发展经历了缓慢增长、快速扩张和结构转型3个阶段,总体呈现“分散—集中—分散”的空间特征,中部省份是现阶段承接污染密集型产业转移的主要地区。通过建立区域属性模型、区域—产业交互项模型,定量分析环境规制、地方保护对污染密集型产业布局空间变化的影响,检验“污染避难所假说”和“波特假说”,发现环境规制和地方保护已成为污染密集型产业布局的重要影响因素,但存在显著的产业异质性和区域差异性;污染程度高的产业易受到环境规制的影响;相比高税收产业,高国有比重的产业更易受到地方的保护;环境规制和地方保护作为两种相反的力量,彼此之间相互抑制;环境规制的作用在东部地区比较突出,而中、西部地区地方保护的作用更为明显。为防止中西部地区成为污染密集型产业的“避难所”,应因地因时制宜制定差异化政策,促进经济与环境保护的协调发展。
Green innovation and firm performance: Evidence from listed companies in China
DOI:10.1016/j.resconrec.2019.01.023 URL [本文引用: 1]
Mutual influence of energy consumption and foreign direct investment on haze pollution in China: a spatial econometric approach
DOI:10.15244/pjoes/78046 URL [本文引用: 2]
How do FDI and technical innovation affect environmental quality? Evidence from China
DOI:10.1007/s11356-019-07411-0
[本文引用: 1]
Foreign direct investment (FDI) is an important driving force for economic growth and technological innovation, but it also brings environmental pollution problems along with economic development. From the perspective of technological innovation, the impact of FDI on China's environmental pollution deserves further study. With the spatial econometric tools employed to account for the potential spatial dependence of environmental pollution, this study uses the panel data of 30 province-level units in China from 1998 to 2016 to investigate the impact of FDI and technological innovation on environmental pollution. The results show that increased FDI can reduce environmental pollution, confirming the existence of the "pollution halo hypothesis"; technological innovation can reduce the emissions of sulfur dioxide and smoke dust but increase the chemical oxygen demand. Therefore, vigorous introduction of foreign capital is good for sustainable development for government, but it is also necessary to pay attention to screening and identifying environment-friendly enterprises with advanced production technology and management experience and to reject high-pollution and high-energy-consuming enterprises eliminated by developed countries.
Circular economy indicators in relation to eco-innovation in European regions
DOI:10.1007/s10098-016-1323-8 URL [本文引用: 2]
The spatial effect analysis of OFDI on green total factor productivity
对外直接投资对绿色全要素生产率的空间效应影响
Foreign direct investment, environmental regulation and urban green total factor productivity of the Yellow River Basin
FDI、环境规制与黄河流域城市绿色全要素生产率
Spatial heterogeneity analysis of impacts of foreign direct investment on air pollution: Empirical evidence from 150 cities in China based on AQI
DOI:10.13249/j.cnki.sgs.2018.03.004
[本文引用: 1]
The issue of air pollution in China has already surged in recent years, attracting public concerns, even great anxiety. This paper employs a unique cross-sectional data set of 150 Chinese cities in 2014 and adopts air quality index (AQI), an indicator newly-developed by the ministry of environmental protection of China, to measure air quality. Then, from a spatial heterogeneity perspective it applies ordinary least square (OLS) technique and geographically weighted regression (GWR) model to analyze the impact of foreign direct investment (FDI) on air pollution controlling for other five explanatory variables, namely, per capita GDP, population density, sulfur dioxide emissions, PM2.5 concentration, and the number of vehicles. Meanwhile, it also investigates if there is an inverted U-shaped curve between per capita GDP and air quality index, specifically environmental Kuznets curve (EKC). The findings are the following. Firstly, there is no evidence of EKC, but an increasing linear relationship between income and air pollution. Secondly, the variable of FDI is found to be significant and negative, indicating that an increase of foreign capital may reduce air quality index, in other words, improve air quality. This is because foreign capital brings advanced technologies, improving air quality effectively. Besides, sulfur dioxide emissions and PM2.5 concentration are found to have significant and positive impacts on AQI while population density, as an indicator of environmental awareness, is found to have a negative impact on AQI. However, from the results of the OLS model, the variable of private cars is not statistically significant, even found to be positive. It hence was deleted from the model. Thirdly, the GWR model results suggest that the impacts of FDI of 150 cities on air pollution greatly vary from city to city. Specifically speaking, foreign capitals of the northeastern cities, Guangzhong plain urban cities and cities of the middle reaches of the Yangtze River play a more important role in reducing air pollution than those of other cities. On the contrary, the contribution of foreign capitals of Shandong peninsula cities and Sichuan-Chongqing urban cluster is found to be insignificant. Finally, from the above analysis, a series of policy handles and suggestions are given.
外商直接投资对空气污染影响的空间异质性分析: 以中国150个城市空气质量指数(AQI)为例
DOI:10.13249/j.cnki.sgs.2018.03.004
[本文引用: 1]
空气污染问题引起了人们极大的关注。以中国2014年150个地级市作为样本数据,采用空气质量指数(AQI)作为全面衡量空气污染的指标,运用地理加权回归模型从空间异质性视角出发,分析了不同城市外商直接投资与空气污染之间的关系。研究结果表明:总体上,外商直接投资由于带来了先进的技术,有利于空气质量的改善。此外,人均地区生产总值的增加、二氧化硫和PM<sub>2.5</sub>浓度的提高均是导致空气污染加剧的重要因素;而环保意识的提升则有利于空气质量的改善。民用汽车保有量变量在统计上不显著。从地理加权回归模型估计结果来看,不同城市的外商直接投资对环境的改善作用存在显著的空间异质性。其中,东北城市群、关中城市群和长江中游城市群外商直接投资对空气质量的改善作用最大,山东半岛城市群和川渝城市群外商直接投资对空气质量的改善作用不明显。
The spatial technology spillovers effect of Chinese manufacturing industries' agglomeration: The difference of institutional environment
中国制造业集聚的空间技术溢出效应: 引入制度环境差异的研究
DOI:10.11821/dlyj201605009
[本文引用: 1]
基于Fujita和Thisse提出的理论框架,引入制度环境变量,研究地区制造业集聚和制度环境通过地区技术创新影响空间技术溢出的机制。在此基础上,采用2003-2012年中国内地30个省、自治区和直辖市的面板数据,运用面板工具变量两阶段最小二乘法(IV-TSLS)对其机制进行实证检验。研究表明:一方面,从全国总体样本来看,加入制度环境变量后,制造业集聚与法律制度的交互项对地区技术创新和空间技术溢出有显著的正向促进作用;另一方面,从分地区的样本来看,东部地区与全国样本检验结果一致,而中西部地区的制造业集聚并未产生显著的空间技术溢出效应。进而,提出通过优化制造业集聚提高空间技术溢出效应的政策建议。
Green innovation strategy and corporate performance: An empirical research with employee participation as a mediating variable
绿色创新战略与企业绩效的关系: 以员工参与为中介变量
How the green innovation strategy improves corporate performance: The mediating role of green image and core competence
绿色创新战略如何提升企业绩效: 绿色形象和核心能力的中介作用
Stakeholders' influences on corporate green innovation strategy: A case study of manufacturing firms in China
Effect of green innovation strategy on firm‐idiosyncratic risk: A competitive action perspective
DOI:10.1002/bse.2405 URL [本文引用: 1]
Stakeholders management in green innovation strategy: A case study of Jiangsu Redbud Technology Co. Ltd
绿色创新战略中的利益相关者管理: 基于江苏紫荆花公司的案例研究
The driving effect of internal and external environment on green innovation strategy: The moderating role of top management's environmental awareness
内外环境对企业绿色创新战略的驱动效应: 高管环保意识的调节作用
The value of corporate green innovation strategy
企业绿色创新战略的价值研究
Spatial-temporal evolution mode of urban innovation spatial structure: A case study of Shanghai and Beijing
DOI:10.11821/dlxb201512005
[本文引用: 1]
In today's world, the innovation of science and technology has become the key support for improving comprehensive national strength, also the strong lead for changing the mode of social production and lifestyle. Which country has world-class scientific and technological innovation cities maximizes the attraction to global innovation factors. Which country maximizes the attraction to global innovation factors wins strategic initiative in international competition. Based on urban ZIP code spatial database, the evaluation system of urban innovation was established in the perspective of innovation output, and the spatial evolutionary mode, which is concerning the structure of innovation space of Shanghai and Beijing from 1991 to 2014, was discussed. The results of the research indicated that ZIP districts provided a fresh perspective to study the growth of spatial structure of urban innovation. And the result, which is of the evaluation of spacial structure of urban innovation using urban ZIP code spatial database established by connecting random edge points and Voronoi, was relatively ideal. So the promotional value exists. During the 25 years, the growth of spatial structure of innovation of Shanghai and Beijing demonstrated a lot of common features: with the increase of urban space units participated in innovation year by year, although the overall gap of regional innovation output has narrowed, the trend of spatial agglomeration has strengthened. The growth of spatial structure of innovation of Shanghai and Beijing demonstrated the differences among common features during the 25 years as well: in the trend of the suburbanization of innovation resources, the spatial structure of innovation of Shanghai indicated that the driver has evolved from the single-core driver to the multi-core resonance evolution. Radiation effect using traffic arteries as spatial diffusion corridors was prominent. Accordingly, the spatial correlation effect of its innovation output also indicated the city center hollowness; the spatial structure of innovation of Beijing was single-core (the city center) oriented structure all the way. In the trend that innovation resources were agglomerated in the center, the spatial correlation effect of innovation output indicated the characteristics of the evolutionary feature where "rural area encircles cities". The spatial structure of innovation of Shanghai and Beijing has intrinsic consistency with the spatial structure of their respective regions (Yangtze River Delta urban agglomeration and Beijing-Tianjin-Hebei urban agglomeration), which suggested that the principle of proportional and disproportional distribution of city-scale pattern of technological and innovational activities is closely related to its regional innovation pattern.
上海和北京城市创新空间结构的时空演化模式
DOI:10.11821/dlxb201512005
[本文引用: 1]
基于城市邮编区划空间数据库,从创新产出的视角建构城市创新评价指标体系,对1991-2014年上海市和北京市的创新空间结构的空间演化模式进行了探讨。研究发现:① 邮政区划为研究城市创新空间结构的生长提供了全新的视角,基于随机边缘点连线以及泰森多边形法构建的城市邮编空间数据库评价城市创新空间结构的结果较为理想,因此具有推广价值;② 25年间,上海市和北京市的创新空间结构生长体现出了诸多的共性特征:随着参与创新的城市空间单元逐年增加,区域创新产出虽总体差距在缩小,但空间集聚趋势在加剧;③ 25年间,上海市和北京市的创新空间结构生长也体现出了共性上的差异性,其中上海市创新空间结构在创新资源郊区化转移的趋势下,呈现出由单核驱动向多核共振演进,以交通干道为空间扩散廊道的辐射效应凸显,相应的,其创新产出空间关联效应也显现出了市中心空心化现象;而北京市创新空间结构始终为市中心单核主导型,并在创新资源不断向中心集聚趋势下,其创新产出空间关联效应呈现出“农村包围城市”的演化特征;④ 上海市和北京市创新空间结构与其所在的区域创新空间结构(长三角城市群和京津冀城市群)具有内在的一致性,表明城内尺度科技创新活动空间分布的均衡与非均衡规律与其所处的区域创新格局密切相关。
Technology transfer in China's city system: Process, pattern and influencing factors
DOI:10.11821/dlxb201804011
[本文引用: 1]
<p>Based on the records of patent transfer from the patent retrieval and analysis platform in the State Intellectual Property Office of China, this research built an assessment index and model for technology transfer in China's city system in terms of agglomeration and dispersion, using big data mining technology, geo-coding technology, spatial autocorrelation model and multiple linear regression model. Then we studied the spatial-temporal pattern, agglomeration model and influencing factors of technology transfer in China's city system from 2001 to 2015, and obtained the following results. Firstly, with the increasing capability of city's technology transfer and the growing number of cities involved in transferring technology, the polarization and strong agglomeration of technology transfer in China's city system have been intensified. Secondly, technology transfer in China's city system has experienced a process of constant spatial polarization, the three-pole pattern led by the Beijing-Tianjin-Hebei region, the Yangtze River Delta region and the Pearl River Delta region has been gradually prominent. Thirdly, technology transfer system from global to local scale in China's city system has initially taken shape. Beijing, Shanghai and Shenzhen have become the three global centers of China in technology transfer. Fourthly, technology transfer in China's city system has produced an obvious spatial correlation and agglomeration effect. The four types are mainly in the cluster, and the geographical proximity of technology transfer in China's city system is significant. Last but not least, the influencing factors of technology transfer in China's city system were also verified by multiple linear regression model. We found that the demand and supply capacity respectively represented by the scale of tertiary industry and the number of patent applications has a great influence on the growth of technology transfer capability. In addition, the number of R & D employees is an important factor, but its correlation is low. The findings further confirm that the scale of primary industry has a significant impedance effect on city's technology transfer capability.</p>
中国城市创新技术转移格局与影响因素
DOI:10.11821/dlxb201804011
[本文引用: 1]
以国家知识产权局专利检索及分析平台中历年专利转让记录为数据源,采用大数据挖掘技术、地理信息编码技术、空间自相关模型和多元线性回归模型,并从集聚和扩散两个方面构建城市创新技术转移能力评价指标体系及评估模型,对2001-2015年中国城市技术转移的时空格局、集聚模式及影响因素进行了研究。结果发现:① 2001-2015年,随着城市创新技术转移能力的不断上升,且在参与创新技术转移的城市数量不断增加情境下,中国城市创新技术转移能力的两极分化及强集聚特征持续发育;② 中国城市创新技术转移格局经历着空间不断极化的历程,由京津冀、长三角和珠三角主导的三极格局逐渐凸显;③ 中国城市创新技术集散体系不断完善,从全球至地方的中国创新技术集散体系已初步形成;④ 中国城市创新技术转移呈现出显著的空间关联与集聚效应,4种类型基本呈“抱团”分布,城市创新技术转移的地理邻近性显著;⑤ 多元线性回归模型发现,城市创新技术的需求能力和供给能力决定其转移能力,第三产业产值规模和专利申请量对城市创新技术转移能力影响较大。另外,研发人员数量也是影响城市技术转移能力的重要因素,但是相关性较低,而城市第一产值规模对城市创新技术转移能力具有显著的阻抗作用。(注:①考虑到专利技术从申请至授权以及转移的期限较长,因此本文城市吸收、转出的专利速度主要基于1年转移量、2年转移量和5年转移量来综合评定。)
Does host market regulation induce cross‐border environmental innovation?
DOI:10.1111/twec.12784 URL [本文引用: 2]
How does environmental regulation promote technological innovations in the industrial sector? Evidence from Chinese provincial panel data
Study on driving factors of environmental technology innovation behavior of equipment manufacturing enterprises based on grounded theory
基于扎根理论的装备制造企业环境技术创新行为驱动因素的质化研究
The path dependency of green technology innovation and environmental regulation analysis
绿色技术创新中路径依赖及环境规制影响分析
Spatial discrepancy in patent-based innovation of environmental technologies
基于专利的区域环境技术创新水平空间分异研究
Evaluation on provincial green innovation capability: Based on index screening model of collinearity-coefficient of variation
我国省级绿色创新能力评价及实证
Research on the spatial-temporal differences and convergence of green innovation capacity in China
中国绿色创新能力的时空分异与收敛性研究
China regional environmental innovation performance evaluation and research
中国区域环境创新绩效评价与研究
Final report MEI project about measuring eco-innovation
The influence of green innovation performance on corporate advantage in Taiwan
DOI:10.1007/s10551-006-9025-5 URL [本文引用: 1]
Green innovation ability evaluation of manufacturing enterprises based on AHP-OVP model
DOI:10.1007/s10479-018-3094-6 URL [本文引用: 1]
An environmental perspective extends market orientation: Green innovation sustainability
DOI:10.1002/bse.2561 URL [本文引用: 1]
Inter-firm R&D collaborations and green innovation value: The role of family firms' involvement and the moderating effects of proximity dimensions
DOI:10.1002/bse.2248 URL [本文引用: 1]
Cooperation in R&D and eco-innovations: The role in companies' socioeconomic performance
DOI:10.1016/j.jclepro.2018.09.146
[本文引用: 1]
In this study, the principles of sustainable development motivated the validation of an original model, in which cooperation in R & D and the green route of eco-innovations satisfactorily explain companies' socioeconomic performance. Data were collected from 221 electrical and electronic manufacturers operating in Brazil and processed via SmartPLS (R) 3 using the Structural Equation Modeling technique. We originally demonstrated that the knowledge synergies released from cooperation in R & D with heterogeneous agents are advantageous to the introduction of multidimensional types of eco-innovations, including both technological (product and process) and organizational. We also succeeded in covering a gap in the literature that stems from the fragmented investigation of the well-known Triple Bottom Line paradigm. We filled this gap by showing that eco-innovations, which could be considered the environmental line, are able to positively influence both the social and economic performances of companies. These findings reverse the logic that companies must first have leftover profits to invest in environmental sustainability. Further, our novel contributions allow us to suggest that cooperation in R & D does not have the ability to influence companies' socioeconomic performance, which confirms our departure model premises in that, although the relation between cooperation in R & D and socioeconomic performance does not directly exist, it is mediated by the introduction of eco-innovations. Future studies may investigate how biomimicry could inspire radical eco-innovations and how digital transformations, such as Industry 4.0 and IoT could boost the efficiency of eco-innovations. (C) 2018 Elsevier Ltd.
Review on investment direction of green technology R&D in Korea
DOI:10.1016/j.rser.2015.04.158 URL [本文引用: 1]
Invention and international diffusion of water conservation and availability technologies: Evidence from Patent Data
Measuring environmental innovation using patent data
Climate mitigation and adaptation in Africa: Evidence from patent data
The use of patent statistics for international comparisons and analysis of narrow technological fields
Environmental innovation and environmental performance
DOI:10.1016/j.jeem.2009.05.003 URL [本文引用: 1]
Environmental innovations and policy network styles: The influence of pluralism and corporativism
DOI:10.1016/j.jclepro.2019.06.034
[本文引用: 1]
The increasing awareness of sustainability issues in industrialized countries has resulted in an unprecedented rise in the number of environmental innovations produced worldwide. However, while this is a general tendency, the amount and importance of environmental innovations is far from consistent across industrialized countries. The influence of countries' policy network styles referring to which and how interest groups participate in making public policy choices is a dimension that has been subject to growing interest and controversy. We propose that companies from pluralistic countries will generate more environmental innovations, but the importance of environmental innovations will be higher in neo-corporatist countries. Our analysis, based on a longitudinal analysis of 84,274 environmental patents from the United States, Japan, Germany, and the UK during the period 1976-2003, indicates support for our prediction that neo-corporatist countries tend to generate more important environmental innovations than pluralistic countries. Yet, our findings do not support our hypothesis suggesting that pluralistic countries are more likely to generate a higher number of environmental innovations. (C) 2019 Elsevier Ltd.
The impact of environmental regulations on urban Green innovation efficiency: The case of Xi'an
Research on regional differences and influencing factors of green technology innovation efficiency of China's high-tech industry
Analysis on China's eco-innovations: Regulation context, intertemporal change and regional differences
DOI:10.1016/j.ejor.2015.07.029 URL [本文引用: 1]
Benchmarking urban eco-efficiency and urbanites' perception
DOI:10.1016/j.cities.2017.11.009 URL [本文引用: 1]
Environmental regulation, geographic location and growth of firms' productivity in China
DOI:10.11821/dlxb201510004
[本文引用: 1]
The impact of environmental regulations on firms' productivities is a hot topic at present, but little attention has been paid to the geographic location aspect. As the literature show two kinds of theories named "Cost hypothesis" and "Porter hypothesis" according to the impact of environmental regulations on firms' productivities, this paper empirically analyzes the influences of spatial difference and interdependence of environmental regulations on firms' productivity based geographic data and micro-firm-level data for the period of 2004-2007. Our results show that spatial difference of environmental regulations has a significant impact on firms' total factor productivity with an inverted U-shaped relationship. That is to say, appropriate intensity of environmental regulations could promote firms' productivities, but if the environmental regulations are too intensive, firms' productivity might decrease. The effect of spatial correlation of environmental regulation is significant. The environmental regulation of neighborhoods can promote the productivity of firms in native city. Environmental regulation has a significant impact on the firms with high efficiency, but no significant influence on firms with low efficiency. Besides, the impact of environmental regulation on productivity of pollution-intensive firms is variant according to geographic location. The promotion of environmental regulation on firms' productivity is stronger in the eastern region than in the central and western regions. Our research suggests different mechanisms for the Cost hypothesis and Porter hypothesis in the context of geographic location. The governments shall make different regulations in different parts of the country instead of one policy.
中国环境规制、地理区位与企业生产率增长
DOI:10.11821/dlxb201510004
[本文引用: 1]
环境规制对企业生产率的影响是当前学术界的研究热点,但基于地理区位视角的研究较少。应用中国环境规制地理空间数据和微观企业数据,实证分析了环境规制空间差异与环境规制空间相关性对企业生产率的影响。结果表明,环境规制空间差异与企业生产率之间存在显著的倒U型关系;环境规制空间相关性作用显著,邻近城市环境规制提升有利于本城市企业生产率增长;环境规制对生产效率高的企业具有显著促进作用,但对生产效率低的企业影响不明显;不同的地理区位,环境规制对企业生产率的影响不同,相对于中西部地区,东部地区环境规制促进企业生产率增长的作用更为显著。本文揭示了在地理区位视角下,针对环境规制对企业生产率的影响,“成本假说”和“波特假说”具有各自的解释空间。
Strategic interaction of environmental regulation and green productivity growth in China: Green innovation or pollution refuge?
Leaders and laggards in environmental innovation: An empirical analysis of SMEs in Europe
DOI:10.1002/bse.1854 URL [本文引用: 1]
Loaning scale and government subsidy for promoting green innovation
DOI:10.1016/j.techfore.2019.04.023
[本文引用: 1]
Green innovation has attracted worldwide attention in the past decades. In this paper, we develop series of game models to address the effects of green loans and government subsidies on green innovation activities of enterprises. We derive a threshold value for loaning interest rate. If the interest rate of the green loan is lower than this threshold value, then the enterprises are willing to accept the loan from the bank and implement green innovation. By defining a measure for environmental effect of productive activities, we obtain a threshold value for the loaning scale. If the loaning scale is larger than this threshold value, then it meets the purpose of green loan to improve the environmental quality. We prove the effectiveness of government subsidies as an intervention way in supporting green innovation and environmental protection.
