

1 引言
2020年中国60岁及以上人口为2.6亿,占总人口比重为18.70%。未来中国人口老龄化程度将持续快速加深,预计2033年老年人口将达到4亿,2070年前中国将一直是世界上老年人口最多的国家[1⇓-3]。调查显示,八成左右老年人将健康列为众多愿望之首[4]。《健康中国2030规划纲要》、党的“十九大”报告提出将健康老龄化作为中国应对人口老龄化的一项重要战略,党的“二十大”报告进一步提出要实施积极应对人口老龄化战略和推进健康中国建设。第七次全国人口普查数据显示,2020年平均预期寿命为77.93岁,相比2010年增加了3.1岁,人口健康水平显著提高。然而中国地域辽阔,区域间发展条件存在显著差异,“城乡二元结构”依然典型,老年人口健康水平存在显著空间差异。
近年来空间视角下的人口健康问题已成为全球公共健康领域的重要研究方向之一[5-6],国际上逐渐有研究指出死亡率[7-8]、预期寿命[9]及癌症[10]等疾病存在城乡不平等加剧[11⇓-13]与空间差异扩大的趋势[14⇓-16],但国内从空间视角对健康的认识仍然不够,尤其较少关注老年这一弱势群体在城乡间及不同区域间的健康差异。仅有的几项研究主要考察2015年以前的老年人口健康空间特征,认为在自然地理、经济社会发展条件的综合影响下[17⇓⇓⇓-21],中国老年人口健康水平呈现由东向西递减、城镇高于农村的空间格局[22⇓⇓-25],老年人口健康水平的区域差异在2002—2008年间不断缩小[22-23],在2010—2015年间趋于扩大[25],这与中国区域发展不均衡、老年健康服务与养老资源供需不平衡有关[26-27]。
2010年以来,中国城乡居民收入持续增长[28],区域发展格局由东西差异向南北差异转变[29-30],人口分布的区域分化继续增强[31],国家对环境污染问题日益重视,这些新发展变化都进一步对老年人口健康的空间格局产生影响。在上述背景下,中国老年人口健康水平的空间格局出现了哪些新特征和新趋势?城乡差异是扩大还是缩小?健康水平由东向西递减的特征是否发生变化?社会经济发展、人口流动等因素对其产生何种影响?环境保护力度增加对改善老年人口健康水平产生了何种效果?系统回答上述问题,有助于动态把握老年人口健康水平的空间变动趋势,研判老年人口健康的城乡不平等特征,理解中国老年人口健康水平与社会经济、人口流动、环境本底、环境污染与治理等因素之间的逻辑关系,对因地制宜完善人口老龄化政策具有重要意义。
本文基于第六、七次全国人口普查资料老年人口自评健康数据,以省域为研究单元,分析2010—2020年中国老年人口健康水平的格局演变特征及影响因素变迁,阐释老年人口健康水平格局演变的形成机制,以期为老龄化背景下的公共服务资源区域配置、老年人力资本开发、区域协调发展等提供参考依据。
2 数据来源、变量选取与研究方法
2.1 数据来源
以中国省域为基本空间单元(暂未含台湾省、香港和澳门特别行政区),研究使用的老年人口健康数据主要来自第六次全国人口普查资料、第七次全国人口普查资料。老年健康水平影响因素数据主要来源于《中国统计年鉴》《中国卫生健康统计年鉴》、2020年第七次全国人口普查数据、《中国城市统计年鉴》、中国1∶100万地理数字高程模拟数据与中国气象数据网地面气候资料。
2.2 变量选取
2.2.1 老年人口健康水平测度
在生物医学模式下,健康指没有疾病。伴随生物医学模式向生理—心理—社会医学模式转变,健康内涵由生理向心理、社会等方面拓展,但测度老年人健康的传统指标(如死亡率、平均预期寿命等)存在“只反映躯体健康、无法反映心理、社会健康,无法反映疾病导致的躯体功能影响与生活质量”等不足[32],对此国外建立了多种老年综合健康评估量表,中国学者逐步引入国外的日常生活活动(Activities of Daily Living, ADL)、社区日常生活活动(Instrumental Activities of Daily Living, IADL)、衰弱指数列等量表[33],测量中国老年人健康水平,但量表和构建综合评价指标存在复杂度高、大规模测量难度大等不足。自评健康相对简单易得,适合群体分析与宏观区域研究。2005年以来,老年人口自评健康已成为全国人口普查的主要健康指标。
自评健康是指个体对自身健康状况的主观自我评价,是对自身健康状况所做的主观感受与客观症状的综合健康状况评估,尤其能反映一些客观健康指标不能反映的问题,在一定程度上受个体身份、生命历程及近期患病情况及周围环境等影响。大量研究表明,自评健康指标可以揭示老年人生理、心理、社会适应及生活满意度等之间的关系[34-35],能对癌症、心血管等疾病死亡率和功能衰退(尤其是心力衰竭)具有很稳健的预测效力[36],因此,作为一项多维结构的健康指标,自评健康不仅揭示目前实际健康状况,还可对未来健康产生预测作用。全国人口普查资料中针对60岁及以上受访者设置了自评健康状态问题,受访者可选择包括“健康”“基本健康”“不健康但生活能自理”“生活不能自理”4个反映身体健康状况的选项,本文将主要采用自评健康占比作为测度省域老年人口健康水平的指标。
为验证健康自评这一主观性数据的代表性,本文将2010年和2020年各省60岁及以上自评健康占比与2011年和2018年各省60岁及以上人口患慢性疾病占比、有抑郁症状占比,以及2010年和2020年平均预期寿命进行相关性分析,结果如表1所示。可以看出,2010年、2020年老年人口自评健康占比与2011年、2018年老年人口患慢性疾病占比和有抑郁症状占比均呈显著负相关关系,与平均预期寿命呈显著正相关关系,2011年患慢性疾病占比与2018年患慢性疾病占比呈显著正相关关系,但两者与历年有抑郁症状占比、平均预期寿命相关关系不显著,2011年有抑郁症状占比与2018年有抑郁症状占比呈显著正相关关系,有抑郁症状占比则与平均预期寿命呈显著负相关关系。由此可知,自评健康数据不仅能够反映老年人口生理健康水平,还能反映心理健康水平,同时对平均预期寿命有者较好的预测性,而其他健康指标均无法同时涵盖生理、心理、预期寿命等多维度的健康特征信息。
表1 老年人口自评健康与其他健康指标相关关系
Tab. 1
| 2020各省老年人口自评健康占比 | 各省老年人口患慢性疾病占比 | 各省老年人口有抑郁症状占比 | 各省平均预期寿命 | ||||||||
|---|---|---|---|---|---|---|---|---|---|---|---|
| 2011年 | 2018年 | 2011年 | 2018年 | 2010年 | 2020年 | ||||||
| 各省老年人口自评健康占比 | 2010年 | 0.7662*** | -0.4912*** | -0.4826*** | -0.5210*** | -0.3906** | 0.5175*** | 0.5289*** | |||
| 2020年 | - | -0.4153** | -0.5620*** | -0.5720*** | -0.5064*** | 0.5733*** | 0.6145*** | ||||
| 各省老年人口患慢性疾病占比 | 2011年 | - | - | 0.3895** | 0.0332 | -0.2007 | 0.2045 | 0.1884 | |||
| 2018年 | - | - | - | -0.0017 | -0.1117 | -0.0235 | -0.0427 | ||||
| 各省老年人口有抑郁症状占比 | 2011年 | - | - | - | - | 0.8920*** | -0.7773*** | -0.7927*** | |||
| 2018年 | - | - | - | - | - | -0.8086*** | -0.8209*** | ||||
| 2010年各省平均预期寿命 | - | - | - | - | - | - | 0.9947*** | ||||
注:*、**、***分别表示在10%、5%、1%水平上显著;老年人口自评健康占比来自第六、七次全国人口普查资料,老年人口患慢性疾病占比和老年人口有抑郁症状占比来自2011年中国健康与养老基线调查数据、2018年中国健康与养老追踪调查数据,平均预期寿命来自2021年《中国人口和就业统计年鉴》。
2.2.2 老年人口健康水平影响因素的理论分析及变量选取
从理论上而言,影响人口健康水平的因素主要包括:生物学遗传基因、生活方式、环境条件、社会经济发展水平等四类[37]。后两者作为宏观因素,空间差异性较强,且对前者存在一定的塑造作用,故本文主要探究环境条件和社会经济发展水平对中国老年人口健康水平空间格局及其城乡差异的影响。
环境条件因素主要包括环境本底因素、环境污染和治理因素。一方面,环境本底对健康的影响从长期来看较为稳定,已有研究发现,疾病发病率在特定的温度范围内较低,在温度阈值以下和以上则会增加[38],极端气温会显著损害老年健康并增加死亡风险,极端温差过大会增加老年群体患重度感冒等疾病的健康风险[39],城镇人口对极端温度的敏感性及应对能力均强于农村人口,这也导致农村人口因极端气温的死亡风险更高[40],同时,空气湿度也会对老年人口健康产生生理和心理影响,同样存在湿度阈值[41],如空气相对湿度与中国老年群体常见慢性疾病中的风湿病发病率存在较强关联,因此空气相对湿度过高则会显著降低老年群体健康水平[42]。另一方面,工业化与城镇化所带来的环境污染对人口健康产生负向影响[43],这将会减弱经济增长对人口健康的正向效应[44],而工业化与城镇化后期具有针对性的环境治理、产业转移以及出台政策法规等措施将减少污染物排放[45],从而进一步推动经济增长所带来的健康发展红利,但相比之下经济发展落后地区的环境治理相对滞后,所承担的污染健康成本更高,这将在某一阶段加剧城乡间发展不平等,扩大城乡人口健康差异[46]。
区域间发展水平差异所导致的大规模人口流动可能进一步加剧人口健康水平的区域及城乡差异。一方面,人口流动可能会导致流入地的就医资源紧张而不利于老年人口健康,但人口流入又可能促进流入地经济增长、增加财政收入以及交叉补贴当地医疗支出费用[50⇓-52],同时会增加流入地老年人口的养老服务资源和社会支持能力[53],且以劳动力为主的流动人口对公共医疗资源的使用率偏低[54],这将更明显有利于人口流入地的健康水平。另一方面,虽然人口流出地可能通过财政转移支付来推动基本公共服务均等化发展[55],但人口流出也将削弱流出地传统的家庭养老模式基础,传统家庭代际关系遭到破坏[56],使老年人口在心理健康层面产生恶化。
据此,本文主要选取的影响变量指标如表2所示。具体而言,选取人均收入、主要生活来源依靠低保的老年人口占比、每万人拥有卫生人员数量与人均绿地公园面积作为衡量社会经济发展的4项指标[60]。由于人口流动主要通过影响人口和劳动力规模来改变医疗资源、家庭与社会支持供给,进而作用于老年人口健康水平,因此选取人口净流入率作为衡量人口流动的指标。在环境条件方面,主要选取最大温差、空气相对湿度作为反映环境本底的因素变量。选取PM2.5浓度(按人均折算)、人均化学需氧量排放量、人均固体废弃物排放量作为衡量环境污染的3项指标[61]。对于环境治理相关变量的选取,由于地方政府采取的环境治理措施具有多样化的特点,既能够通过颁布环境保护条例、修改环境保护法等法律手段约束环境污染行为[62];也能够通过减税降费、加大环保财政预算投入及环保督察力度等经济、行政手段直接治理环境问题[63-64],因此本文选则构建环境保护力度复合指标,即将各省政府工作报告中环境保护词频占比与节能环保财政预算支出相乘构建各省域环境保护力度指标[65]。同时,控制老年人口年龄结构、性别结构以及家庭规模的区域差异对老年人口健康水平空间格局的影响[66-67]。为排除变量间多重共线性问题,采取熵权法对上述指标进行降维处理,主要将社会经济发展4项指标合并为社会经济发展因素,将环境污染与治理维度中的3项指标合并为环境污染因素。
表2 变量说明
Tab. 2
| 维度 | 变量定义 | 数据来源 |
|---|---|---|
| 老年人口健康 | 60岁及以上人口中自评健康人数占比(%) | 第六、七次全国人口普查 |
| 社会经济发展 | 人均收入(城市人均可支配收入、农村人均纯收入),取对数(元/人) | 《中国统计年鉴》 |
| 低保老年人口占比:各省区或省区城镇、乡村60岁及以上人口主要生活来源为最低生活保障人数占比(%) | 第六、七次全国人口普查 | |
| 每万人拥有卫生人员数量(人) | 《中国统计年鉴》 | |
| 人均绿地面积(km2/人) | 《中国统计年鉴》 | |
| 人口流动 | 人口净流入率:各省区城镇、乡村人口净流入存量值/各省区城镇、乡村人口数量(%) | 第六、七次全国人口普查 |
| 人口及家庭特征 | 低龄老年人口占比:各省区或省区城镇、乡村60岁及以上人口60~69岁人数占比(%) | 第六、七次全国人口普查 |
| 老年人口性别比:各省区或省区城镇、乡村60岁及以上人口的性别比 | 第六、七次全国人口普查 | |
| 平均家庭户规模(人/户) | 第六、七次全国人口普查 | |
| 环境污染 | 人均化学需氧量排放量(kg/人) | 《中国统计年鉴》 |
| PM2.5浓度(ug/m3,按人均折算) | 《中国统计年鉴》 | |
| 人均固体废弃物排放量(t/人) | 《中国统计年鉴》 | |
| 环境治理 | 环境保护力度:政府工作报告中环境保护词频占比×节能环保财政预算支出 | 政府工作报告、《中国统计年鉴》 |
| 环境本底 | 空气相对湿度(%) | 中国气象数据网地面气候资料数据 |
| 最大温差(℃) | 《中国气象年鉴》 |
2.3 研究方法
2.3.1 探索性空间数据分析
探索性空间数据分析(Exploratory Spatial Data Analysis, ESDA)是一系列空间数据分析技术与方法的集合,基于GIS软件,运用空间自相关与空间关联指数等可视化地描述事物在空间上的分布规律,揭示事物的空间结构与相互作用关系[68]。ESDA包括 Moran's I指数、Getis-Ord General G指数和Getis-Ord Gi*,可用来测度全局与局部的空间关联。前两者主要用来测度整体的空间关联结构模式,后者用来深入识别不同要素空间的高值簇和低值簇的空间分布规律[69],本文采用探索性空间数据分析方法,刻画中国城乡老年人口健康水平在空间上的分布规律与集散演化过程,主要公式如下[70-71]:
式中:n代表观测值的数量;
2.3.2 重心—时空地理加权回归
为探究主要影响因素的时空差异,本文将基于上述数据和变量建立时空地理加权回归(GTWR)模型。时空地理加权回归(GTWR)模型是空间地理加权回归(GWR)模型的拓展,核心是综合时间坐标与空间坐标来计算时空权重矩阵,弥补了传统空间地理加权回归模型没有引入时间维度的不足[72]。但传统地理空间坐标会使时空权重矩阵产生较多坐标重合的问题,导致GTWR估计结果近似于以时间维度为研究的线性回归分析[73]。将GTWR模型应用在中国老年人口健康水平研究时,需要解决研究单元在各时点具有不同空间坐标的问题,以体现老年人口健康水平的时空变动趋势,因此有必要结合重心转移模型进行研究[74]。重心转移模型借鉴物理学重心概念,衡量2010年与2020年中国31个省份老龄化人口重心的空间位置,旨在表征出各省份老龄化人口重心在空间上随时间偏移的趋势。中国31个省份老龄化人口重心的具体计算方法如下所示:
式中:i为省份;c为i省份下属设区市;n为下属设区市数量;
将老龄化人口重心与时空地理加权回归模型结合后,构造了如式(5)所示的老龄化重心—时空地理加权回归模型:
式中:i代表各省份;
3 中国老年人口健康水平空间格局演变特征
3.1 城镇与乡村老年人口健康水平均有所上升,但城乡差异总体扩大且以东北地区较为突出
2010—2020年中国老年人健康状况总体上升,全国老年人口自评健康占比由2010年的43.88%升至2020年的54.64%,自评健康与基本健康占比则由83.08%升至87.25%。分城乡来看,城镇与乡村老年人口健康水平均有上升,但幅度存在明显差异。2010—2020年间,城镇老年人口自评健康占比由48.40%增至59.92%,增加11.52个百分点;而乡村老年人口自评健康占比由40.51%增至48.54%,增加8.03个百分点,城乡老年人口自评健康占比差异由2010年的7.89%上升至2020年的11.38%,城乡差异逐步扩大。
进一步考察各省份老年人口健康水平的城乡差异特征可知(表3),与2010年相比,2020年除贵州、江西、陕西、云南、青海等少数地区城乡差异缩小外,全国大部分地区城乡差异均出现扩大,其中,东北、京津冀、长三角等地区城乡差异扩大幅度较大,尤以东部地区较为突出,辽宁、吉林两省城乡差异扩大幅度均超过10个百分点。
表3 2010—2020年中国各省份老年人口健康水平城乡差异及其变动
Tab. 3
| 省份 | 城乡差异(%) | 2010—2020年城乡 差异变动(%) | ||
|---|---|---|---|---|
| 2010年 | 2020年 | |||
| 北京 | 7.70 | 15.88 | 8.17 | |
| 天津 | -0.24 | 17.90 | 18.14 | |
| 河北 | 5.55 | 12.01 | 6.46 | |
| 山西 | 11.37 | 17.50 | 6.14 | |
| 内蒙古 | 9.83 | 18.34 | 8.51 | |
| 辽宁 | 2.62 | 16.96 | 14.33 | |
| 吉林 | 3.92 | 14.34 | 10.42 | |
| 黑龙江 | 3.64 | 10.72 | 7.08 | |
| 上海 | -1.61 | 5.23 | 6.84 | |
| 江苏 | 3.27 | 8.75 | 5.47 | |
| 浙江 | 8.44 | 14.28 | 5.84 | |
| 安徽 | 7.01 | 6.81 | -0.20 | |
| 福建 | 11.08 | 11.10 | 0.03 | |
| 江西 | 10.77 | 5.29 | -5.49 | |
| 山东 | 5.89 | 10.72 | 4.83 | |
| 河南 | 5.81 | 6.95 | 1.15 | |
| 湖北 | 8.34 | 10.81 | 2.46 | |
| 湖南 | 8.23 | 9.04 | 0.81 | |
| 广东 | 12.48 | 17.47 | 4.99 | |
| 广西 | 9.58 | 9.83 | 0.25 | |
| 海南 | 11.99 | 12.90 | 0.91 | |
| 重庆 | 11.90 | 11.11 | -0.79 | |
| 四川 | 13.20 | 15.37 | 2.17 | |
| 贵州 | 13.65 | 1.90 | -11.75 | |
| 云南 | 6.30 | 4.06 | -2.24 | |
| 西藏 | 14.74 | 17.93 | 3.18 | |
| 陕西 | 7.58 | 5.17 | -2.41 | |
| 甘肃 | 8.90 | 8.12 | -0.78 | |
| 青海 | 15.09 | 13.31 | -1.77 | |
| 宁夏 | 6.48 | 10.37 | 3.89 | |
| 新疆 | 1.42 | 6.08 | 4.66 | |
注:城乡差异=城镇60岁及以上人口中自评健康人数占比-乡村60岁及以上人口中自评健康人数占比。
3.2 城镇老年人口健康水平“东—中—西”递减的区域差异趋于强化
为直观比较老年人口健康水平的空间分布特征,依据老年人口自评健康占比(W)将各省划分为6类(等级由低到高):W < 30%、30%≤ W < 40%、40% ≤ W < 50%、50% ≤ W <60%、60% ≤ W < 70%、W ≥ 70%。通过空间可视化与聚类分析(图1)可见,2010—2020年中国城镇老年人口健康水平“东—中—西”递减格局空间格局基本保持不变但逐步强化。沿海省份以及河南、江西、贵州等少数内陆省份城镇老年人口自评健康占比一直高于60%,明显高于其他地区,而新疆、西藏、青海、甘肃等西北省份城镇老年人口自评健康占比一直处于50%以下,处于全国最低水平,其他中西部及东北省份处在全国中游(图1a、1b)。进一步分析城镇老年人口健康水平的空间异质性及其内部空间关系,运用Getis-Ord Gi*指数获得各省域尺度局部Gi*统计量,依据自然断点法划为热点地区、次热地区、次冷地区以及冷点地区4种类型,利用ArcGIS进行可视化(图1e、1f),可以看出2010—2020年东部沿海—中部地区已形成稳定性热点地区,次热点和次冷点地区则稳定聚集在东北及其他中西部省份,而冷点地区则由西藏、新疆、青海3省区扩张至包括甘肃和四川的5省份,这进一步强化了“东—中—西”阶梯式递减空间格局。2010—2020年城镇老人健康水平Moran's I值由0.232增至0.526,也印证了城镇老年人口健康水平总体空间集聚性的增强。
图1
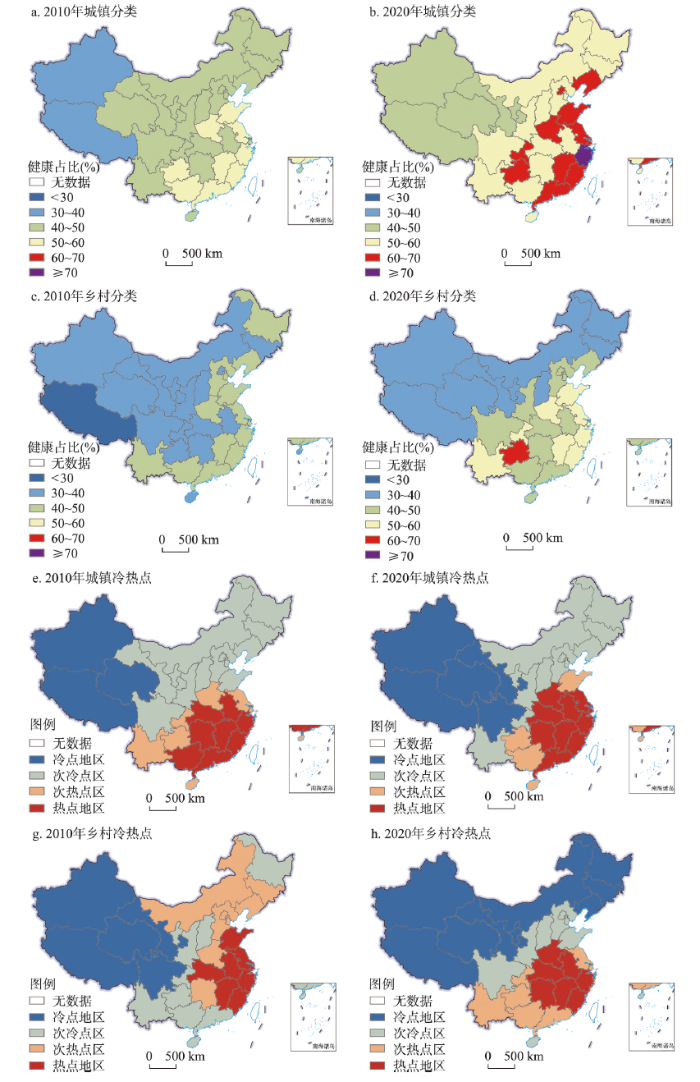
图1
2010—2020年中国城乡老年人口健康水平空间格局演变
注:基于自然资源部标准地图服务网站GS(2019)1823号标准地图制作,底图边界无修改。
Fig. 1
Spatial pattern evolution of urban and rural older adults' health level in China, 2010-2020
考察各省份城镇老年人口自评健康占比极差值,2010年最高值浙江与最低值新疆之间相差20.51个百分点,2020年西北省份老年人口健康水平明显上升,最高值浙江与最低值甘肃之间差距上升至25.75个百分点,但2010年、2020年全国各省城镇老年人口自评健康占比的变异系数(标准差/均值)均为0.12,显示区域差异程度保持稳定。
3.3 乡村老年人口健康的区域差异由“东高西低”向“南高北低”转变
2010—2020年中国农村老年人口健康水平空间格局基本逐步由东西差异转变为南北差异。2010年东部沿海省份乡村老年人口自评健康占比均高于40%,大部分中西部省份城镇老年人口自评健康占比则处于40%以下,东西差异明显,到2020年时南方大部分省份农村老年人口健康水平有较大幅度上升,而北方地区尤其东北地区上升幅度较小,导致南北差异凸显(图1c、1d)。乡村老年人口健康水平的冷热点分布变化显示(图1g、1h),2010—2020年中国乡村老年人口健康水平的局部空间关系变化较大,热点地区集聚程度总体有所增强,在空间上由东部沿海—中部地区向东南沿海地区集聚,冷点地区呈现由西部地区(新—藏—青—甘—川—渝)向西北及东北地区集聚的空间布局变化,次冷点地区由黑龙江及南部地区零散分布趋向华北秦岭淮河一线北侧及四川聚焦,次热点地区相反由华北地区—吉林—湖南等多地零散分布趋向于西南侧集聚,总体而言,热点地区向东南沿海—中部地区聚集,西北—东北地区形成连片冷点地区,次热和次冷地区则主要向南北两个方向分化,从而促使中国乡村老年人口健康水平在空间上呈现由“东热西冷”向“南热北冷”转变。2010—2020年乡村老人健康水平Moran's I值由0.259增至0.506,亦说明其空间集聚性增强。
进一步考察各省份农村老年人口自评健康差异大小可知,2010年最高值山东与最低值西藏之间相差27.56个百分点,2020年最高值贵州与最低值西藏之间差距上升至31.63个百分点,2010年、2020年中国各省乡村老年人口自评健康占比的变异系数(标准差/均值)分别为0.16、0.18,显示区域差异程度总体扩大。
4 中国老年人口健康水平空间格局的影响因素变化
基于重心—时空地理加权回归(Gravity-GTWR)模型回归结果,计算各主要因素对老年人口健康水平影响系数的平均值,并进一步通过绘制社会经济发展、人口流动、环境污染、环境保护对老年人口健康水平影响系数的历年分布图,重点考察这4类因素的作用机理变迁。
4.1 社会经济发展推动老年健康水平改善,但作用趋于减弱,乡城人口流动扩大城乡老年健康差距
各影响因素分省系数的均值结果如表4所示。对于全国老年人口健康水平而言,各因素的作用方向总体符合理论分析所得预期,且对城镇和乡村老年人口健康的作用方向与全国结果基本一致,社会经济发展、人口净流入有利于老年人口健康,环境污染程度上升、空气湿度增加、最大温差扩大均不利于老年人口健康。环境保护力度上升与老年人口健康呈负相关关系,原因可能在于健康水平恶化反而导致环保力度加大,或是环保力度加大通过影响老年人生活习惯、增加其生活成本而造成其健康水平下降,说明当前环境保护举措总体上仍未产生明显的健康改善效应。
表4 重心—时空地理加权回归历年结果(各省份均值)
Tab. 4
| 区域 | 年份 | 社会经济发展因素 | 环境污染因素 | 环境保护力度 | 人口净流入率 | 空气湿度 | 最大温差 |
|---|---|---|---|---|---|---|---|
| 全国 | 2010 | 19.327 | -10.749 | -2.925 | 0.198 | -0.014 | -0.105 |
| 2020 | 18.525 | -10.892 | -2.535 | 0.196 | -0.010 | -0.102 | |
| 城镇 | 2010 | 20.437 | -2.286 | -4.159 | -0.204 | -0.130 | -0.486 |
| 2020 | 7.733 | -4.215 | 1.638 | 0.169 | 0.069 | -0.128 | |
| 乡村 | 2010 | 23.662 | -9.945 | -1.539 | 0.290 | -0.002 | -0.015 |
| 2020 | 23.019 | -10.035 | -1.327 | 0.282 | 0.001 | -0.013 |
值得关注的是:① 社会经济发展因素的健康促进作用整体减弱,社会经济发展因素对全部老年健康影响系数均值从2010年的19.327下降至2020年的18.525,尤其是对城镇老年健康影响系数从2010年的20.437下降至2020年的7.733,反映出随着综合发展水平的不断上升,社会经济发展对老年人口健康的边际贡献逐步下降。② 2010年城镇人口净流入对老年人口健康水平的影响系数均值为-0.204,说明城镇人口净流入可能通过影响公共医疗、养老资源等机制不利于老年人口健康,而2020年城镇人口净流入的影响系数变为0.169,显示人口流入将通过财政收入与支出增长、增加医疗养老资源及社会支持等方式对城镇老年人口起到改善作用;另一方面,2010—2020年乡村人口净流入的影响系数在均为正且略有减小,而事实上中国大部分乡村地区均为人口净流出地区,因此人口流动仍将通过减少家庭与社会支持等机制损害乡村老年人口健康,进而扩大城乡老年人口健康差距。
4.2 环境本底因素作用减弱,环境污染因素作用增强,环境保护举措在城镇地区呈现健康改善效应
2020年空气湿度增加、最大温差扩大在全国及城乡造成健康损失效应相对2010年均出现减小(进一步检验可以发现老年健康水平与空气湿度呈倒“U”型关系),原因在于老年人口针对自然环境条件变动的调整与适应能力总体增强,环境本底因素对老年人口健康水平空间格局的塑造作用趋于减弱。与此同时,环境污染的健康损害效应整体增强,对全部老年健康影响系数均值从2010年的-10.749下降至2020年的-10.892,对城镇老年健康影响变动相对农村也更大,系数从2010年的-2.286变动至2020年的-4.215,说明老年人口的环境问题意识以及对环境污染的敏感程度逐步增强;而环境保护力度增加对城镇老年健康的影响系数均值由负转正,环境保护力度增加并未对乡村老年人口健康产生积极影响,说明2015年后的环保新政策对城镇环境污染治理更具效果,对城镇老年人口健康开始产生积极作用,但改善乡村老年人口健康的作用仍不明显,这也将推动城乡老年健康差距扩大。
4.3 城镇社会经济发展因素作用逐步呈现“东—中—西”递减,人口流动、环境污染和保护因素作用趋于西强东弱
2010年西部地区社会经济发展对城镇老年人口健康的促进作用较强,但随着西部地区社会经济发展水平的总体提高,社会经济发展对健康的边际促进效应逐步减弱,到2020年社会经济发展的健康促进作用则呈现的东—中—西梯度递减格局(图2),这是城镇老年人口健康水平由东向西递减格局强化的主要原因。
图2
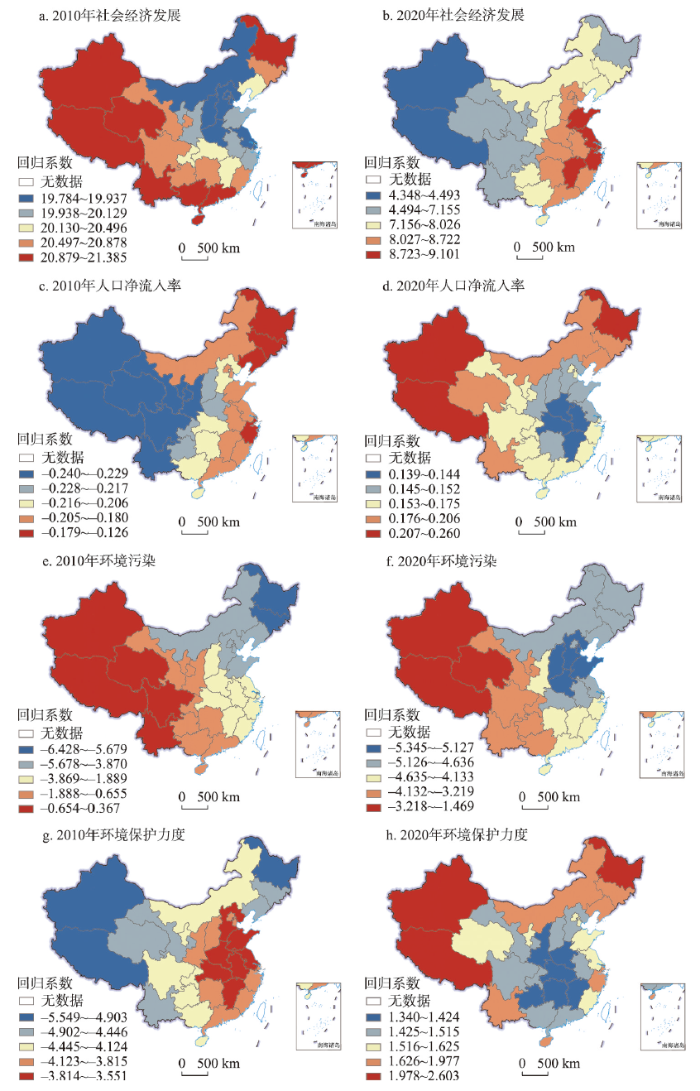
图2
2010—2020年中国城镇老年健康水平影响因素时空变化
注:基于自然资源部标准地图服务网站GS(2019)1823号标准地图制作,底图边界无修改。
Fig. 2
Spatio-temporal changes of factors influencing the health level of urban older adults in China, 2010-2020
2010年人口净流入对东北、东部沿海地区城镇老年人口健康的抑制作用相对其他地区较小,而2020年人口净流入对西部、东北地区城镇老年人口健康的促进作用则相对其他地区较大。与之相似,2010年西部地区环境污染的健康损失效应相比其他地区较弱,但随着环境问题意识的增强,西部地区居民对环境污染的敏感程度上升,2020年环境污染对西部城镇地区老年人口健康的抑制作用明显趋于增大(西部地区环境污染因素系数均值由-0.5左右变至-2左右)。同时,随着城镇环境保护力度增强所带来的健康改善效应凸显,西部等地区环境治理的健康改善效应相比其他地区增幅更大。
4.4 乡村社会经济发展作用呈南高北低分异,人口流动、环境污染和保护因素作用变化有利于南北乡村老年健康差距缩小
图3
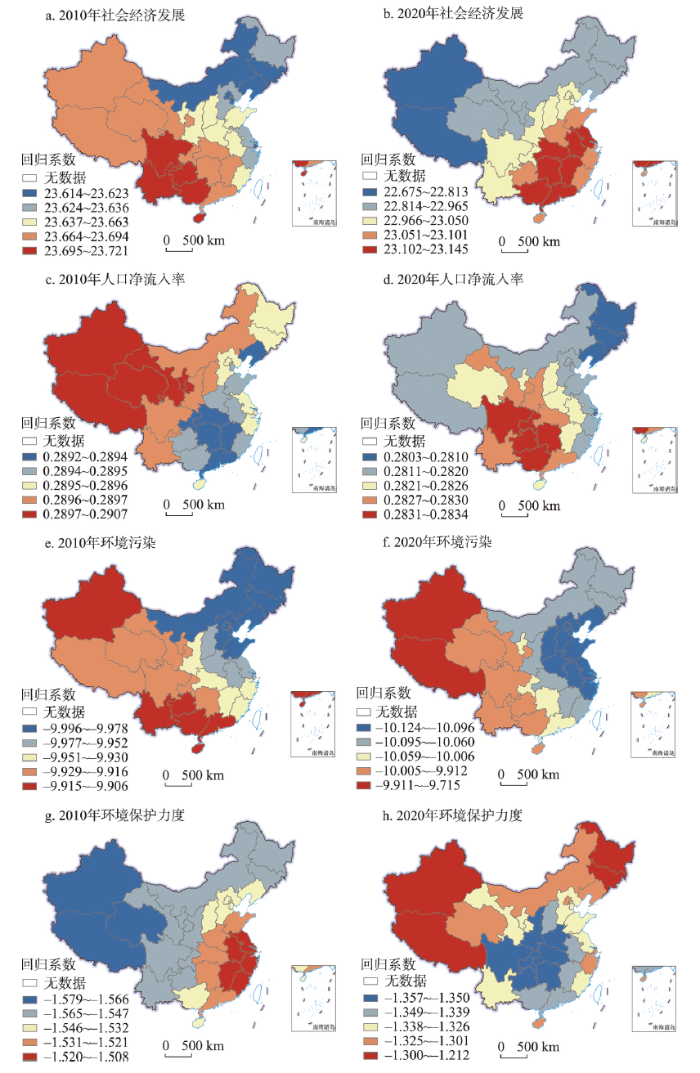
图3
2010—2020年中国乡村老年健康水平影响因素时空变化
注:基于自然资源部标准地图服务网站GS(2019)1823号标准地图制作,底图边界无修改。
Fig. 3
Spatio-temporal changes of factors influencing the health level of rural older adults in China, 2010-2020
在这一时期,乡村人口流动作用普遍减弱,其中西南地区乡村人口流动作用减弱较少,导致2020年影响高值区向西南转移;环境污染因素总体保持东强西弱格局,虽然作用程度普遍增强,但东北地区环境污染因素的作用增幅较小,长三角地区增幅较大;在环境保护因素负面作用整体减弱的趋势下,西北和东北地区负效应减弱幅度相对更大。上述因素有利于缩小乡村老年人口健康水平南北差距,但由于近年来东北地区乡村净流出率增速上升 [19],这造成东北乡村老年人口健康水平恶化,并加剧了东北地区城乡健康差距以及南北乡村健康差距扩大。
5 结论与建议
本文基于第六次、第七次全国人口普查数据,考察2010—2020年中国老年人口健康水平的空间格局演变,并通过Gravity-GTWR模型分析形成该空间格局的主要影响因素变迁,主要结论有:① 2010年以来中国城乡老年人口健康水平总体上升,但城乡差异持续扩大,城镇老年人口健康水平“东—中—西”递减格局逐步强化,区域差异程度保持稳定,乡村老年人口健康水平由“东高西低”转变为“南高北低”,东北地区城乡差异凸显;② 社会经济发展是推动中国城乡老年人口健康水平提高、空间格局形成的首要因素,但总体作用趋于减弱,环境污染因素作用趋于增强,环境本底因素作用趋于下降;③ 乡城人口流动通过财政及医疗资源配置、家庭与社会支持的空间变化扩大城乡老年健康差距,而2015年后环境保护力度加大对城镇居民健康改善更为明显,这进一步加剧了老年人口健康水平的城乡差异;④ 2010年西部地区社会经济发展对城镇老年人口健康的促进作用较强,随着西部地区社会经济发展水平的总体提高,社会经济发展对健康的边际促进效应逐步减弱,到2020年社会经济发展的健康促进作用呈现出“东—中—西”梯度递减格局,塑造了城镇老年健康水平的空间格局,而人口流动、环境污染及保护的健康效应在西部等地区更强,有利于城镇老年健康东西差距的缩小;⑤ 乡村老年人口健康空间模式由东西差异向南北差异转变同样主要是社会经济发展作用区域差异转变的结果,虽然人口流动、环境污染和保护因素作用变化有利于南北乡村老年健康差距缩小,但北方地区尤其东北乡村人口流出进一步扩大了老年健康南北差异,且造成东北地区老年城乡健康差距凸显。
根据上述结论,可提出以下对策建议:① 加强全国城乡健康老龄化发展战略的顶层设计,制定中国城乡老年人健康发展的中长期策略,各省级政府可针对城乡老年人口健康水平空间演变规律与集聚特征,制定差异化老年健康发展策略,同时,加强跨省合作、推进健康老龄化空间联动发展;② 推进社会保障制度改革,不断扩大基本养老保险与基本医疗保险的覆盖面,加大对西北与东北等乡村地区社会保障的财政转移支付,增加乡村地区老年医疗资源供给;③ 坚持实施乡村振兴战略,促进城乡融合发展,以城带乡推动乡村经济社会发展,推进乡村农业现代化发展,提高乡村人口收入的同时增加公共服务供给,特别为留守老人提供针对性的照护、医疗支持,从而提高乡村老人健康水平;④ 环境问题意识的提升对环境保护力度及其政策实施效果提出了更高的要求,在加大环境保护力度的同时,尤其应提高环境保护举措对乡村环境污染问题的针对性、对乡村老年人口群体生活方式的适用性;⑤ 在东南沿海城镇化高水平地区加快产业结构升级,积极发展绿色产业,强化环境治理及生态改善对城镇老年人健康的积极作用;⑥ 通过加强生态环境保护与医疗养老服务资源的规划共建,推进环境保护、生态改善和应对老龄化之间的良性互动,最终实现“健康中国”“健康老龄化”“美丽中国”等多战略的实施推进。
以上基于省级行政单元尺度的分析将不可避免地忽略了县、市级尺度的空间格局演化规律以及部分微观因素影响变迁,但中国老年人口社会保障体系主要以省域为政策制定单元既能考虑到地区差异性,又便于地方政府贯彻实施各项政策,因此本研究能够便于通过总结省级城乡老年人口健康水平规律,为老年人口健康发展对策与养老服务规划的制定与实施提供科学依据。此外,本文主要采用自评健康作为评价地区老年人口健康水平的指标,进一步研究若采用更多维的健康指标与之进行比较分析,可更全面地揭示中国城乡老年人口健康水平的时空演变规律。
参考文献
World population prospects 2019: Highlights
Fiscal Implications of Population Aging and Social Sector Expenditure in China
DOI:10.1111/padr.12206 URL [本文引用: 1]
Future trends of China's population and aging: 2015-2100
The implementation of the universal two-child policy will have a profound influence on China's future trends of population and changing path of aging. Using data from the 1% population sampling survey conducted by the National Bureau of Statistics in 2015,this paper conducts simulations of the size and structure of China's population over the years 2015-2100 by taking into account the potential demographic impacts of the fertility policy adjustment. The results show that China's total popula- tion will grow to the peak in around 2029 and then enter the era of negative population growth; China's population structure will be aging with shrinking working-age population size and expanding elderly population size; the speed of the decline in China's proportion of working-age population will be fast before 2050 and slow with fluctuations after 2050; China's size of elderly population will peak in around 2053 and then gradually begin declining; China will experience a rapid increase in proportion of elderly population before 2050 and the pace of population aging will slow down after 2050.
2015—2100年中国人口与老龄化变动趋势
全面两孩政策的实施将对未来中国人口与老龄化变动趋势产生深远的影响,文章在 充分考虑生育政策调整影响的基础上,依托 2015 年 1%人口抽样调查数据对中国 2015 ~2100 年的人 口规模和结构的变动趋势进行预测分析。结果显示: 中国总人口规模将于 2029 年左右迎来峰值,此 后将步入负增长时期,整个人口的年龄结构将不断老化; 劳动年龄人口规模将处于持续缩减之中,劳 动年龄人口比例在21 世纪前半叶将快速下降、后半叶则将在波动中缓慢下降; 老年人口规模将不断 攀升,于 2053 年左右达到峰值,此后将开始逐年下降,老龄化程度在 21 世纪前半叶将快速提升,但到 了 21 世纪后半叶,老龄化进程将逐渐放缓。
Widening rural-urban disparities in all-cause mortality and mortality from major causes of death in the USA, 1969-2009
DOI:10.1007/s11524-013-9847-2 URL [本文引用: 1]
Building a regional health agenda: A rights-based approach to health in South America
DOI:10.1080/17441692.2017.1308536
PMID:28372479
[本文引用: 1]

Attention to health policies in Southern regional organisations reveals a new 'social turn' in the regional political economy of international cooperation. The aims of this paper are twofold. First, it aims to establish the extent to which the Union of South American Nations (UNASUR) has adopted and sustained policy interventions committed to addressing social inequities and asymmetries in relation to health, as indicated by regional policy agendas, policy development processes and resourcing. Second, it seeks to understand how UNASUR is mobilising national and regional actors in support of such policies. Our analysis of documentary sources and interviews leads us to draw the following conclusions. First, we argue that the UNASUR regional framework has a committed social equity/rights focus in relation to access to health care and medicines, with a clear focus on reducing asymmetries between countries. Second, although UNASUR does not enforce national commitments on health and medicines, it nonetheless plays a role in expanding domestic policy horizons and policy capacities. In this respect, we find that UNASUR interventions lead to initiatives and actions aimed at implementing reforms, setting targets and defining goals nationally. Third, in global arena, UNASUR enhances the visibility and 'voices' of the member states.
Mortality inequality in Canada and the United States: Divergent or convergent trends
DOI:10.1086/703259 URL [本文引用: 1]
Mortality inequality: The good news from a county-level approach
Survival of cancer patients in urban and rural areas of Germany: A comparison
DOI:10.1016/j.canep.2014.02.011
PMID:24680643
[本文引用: 1]
Cancer care services including cancer prevention activities are predominantly localised in central cities, potentially causing a heterogeneous geographic access to cancer care. The question of an association between residence in either urban or rural areas and cancer survival has been analysed in other parts of the world with inconsistent results. This study aims at a comparison of age-standardised 5-year survival of cancer patients resident in German urban and rural regions using data from 11 population-based cancer registries covering a population of 33 million people.Patients diagnosed with cancers of the most frequent and of some rare sites in 1997-2006 were included in the analyses. Places of residence were assigned to rural and urban areas according to administrative district types of settlement structure. Period analysis and district type specific population life tables were used to calculate overall age-standardised 5-year relative survival estimates for the period 2002-2006. Poisson regression models for excess mortality (relative survival) were used to test for statistical significance.The 5-year relative survival estimates varied little among district types for most of the common sites with no consistent trend. Significant differences were found for female breast cancer patients and male malignant melanoma patients resident in city core regions with slightly better survival compared to all other district types, particularly for patients aged 65 years and older.With regard to residence in urban or rural areas, the results of our study indicate that there are no severe differences concerning quality and accessibility of oncological care in Germany among different district types of settlement.Copyright © 2014 Elsevier Ltd. All rights reserved.
China's dusty lung crisis: Rural-urban health inequity as social and spatial injustice
DOI:10.1016/j.socscimed.2019.05.033 URL [本文引用: 1]
Rural-urban inequities in deaths and cancer mortality amid rapid economic and environmental changes in China
DOI:10.1007/s00038-018-1109-3
PMID:29947822
[本文引用: 1]
This paper examines rural-urban inequities in mortality and cancer mortality amid rapid economic growth and environmental degradation in China.SPSS and Joinpoint Regression were used to analyze the 2002-2015 datasets from all death registries in China and associated economic and environmental data.Death and cancer mortality rates among rural residents were higher and increased faster than urban residents. In particular, rural men 30-34 years old were 44% more likely to die from cancer and over 67% more likely to die from all causes, compared to their urban counterparts. Among rural women 15-19 years old, the death rate was 47% higher and the cancer mortality rate was 44% higher than among urban women. Death and cancer mortality rates tended to be positively associated with economic growth and air pollution variables.Rural-urban health inequities have widened in China, with rural youth at the greatest disadvantage. The anticipated health benefits from income growth may have been offset by the impact of air pollution, which calls for further investigation into the causes of rural-urban health inequities.
A closer look at the rural-urban health disparities: Insights from four major diseases in the Commonwealth of Virginia
DOI:10.1016/j.socscimed.2015.07.011 URL [本文引用: 1]
Rising geographic inequality in mortality in the United States
Inequality in mortality between black and white Americans by age, place, and cause and in comparison to Europe, 1990 to 2018
Regional inequalities of residents' health level in China: 2003-2013
DOI:10.11821/dlxb201704010
[本文引用: 2]
As one of the core problems clsoely related with human development, health inequality has aroused an increasing concern in the world. Through an integration of the coefficient of variation, Theil index, exploratory spatial data analysis (ESDA) and spatial panel econometric model, we examine the regional inequality, spatial-temporal dynamic patterns and the key factors of the residents' health level (RHL) in China from 2003 to 2013. The aim is to provide scientific basis for policy making on regional health inequality reduction in China. The results are shown as follows: (1) China's RHL index decreased from 0.404 to 0.295 in 2003-2013, with an annual rate of 2.698%. Specifically speaking, the growing rate in the western region was higher than that in the eastern and central regions, but the there is no change in RHL in terms of the basic pattern which decreases from the east to central part then to the west. (2) The regional inequality of RHL presented an extending trend in 2003-2013. Among this, the RHL inequality between regions presented a reducing trend, but that within a region presented an expanding trend. And the growing rate of inequalities of RHL in the western region was higher than that of the eastern and central regions. (3) The spatial distribution of RHL has tended into the letter "T" shape, and the RHL presented a stepped decrease from the east to the central part then to the west and a symmetric decrease from the north to the central part then to the south. (4) By observing the change of Moran's I in 2003, 2008 and 2013, we found that the spatial agglomeration range of RHL presented a narrowing trend. All the hot spots and cold spots presented a shrinking tendency, the RHL in the west formed a stable cold spot, including Xinjiang, Qinghai and Xizang, but that in the east coastal area formed a stable hot spot, including Shandong, Henan, Qinghai, Hubei, Anhui, Jiangsu and Shanghai. (5) The selected explanatory variables, such as per capita GDP, per capita spending on health, urbanization level and environment quality, have significant direct impacts on the RHL in China. With the increase of per capita GDP, per capita spending on health and urbanization level and the improvement of environment quality, the RHL will be raised. Finally, this paper points out the attention should be focused on the research of the regional inequality of RHL, such as the problems of the residents' multi-time-domain, multi-scale and multi-influencing mechanism.
中国居民健康水平的区域差异: 2003—2013
DOI:10.11821/dlxb201704010
[本文引用: 2]
健康不公平作为影响人类发展的核心问题,已引起世界各国的广泛关注。基于变异系数、泰勒指数、空间自相关分析和空间面板计量模型,本文探讨了2003年以来中国居民健康水平的区域差异、时空变化及其关键影响因素,旨在为政府制定全民健康政策提供科学依据。结果发现:① 2003-2013年,中国居民健康水平提高26.98%,西部增幅高于东、中部,但始终保持着“东—中—西”阶梯式递减态势;② 中国居民健康水平的区域差异总体呈扩大趋势,其中地带间差异趋于缩小,地带内差异趋于扩大,西部地带内差异扩大尤为显著;③ 居民健康水平的空间分布转为明显的“T”字型格局,并呈“东—中—西”阶梯式及“北—中—南”对称式递减;④ 居民健康水平的空间集聚程度趋于减小,热点区与冷点区均呈收缩态势,且西部形成规模显著的稳定性冷点,东部沿海形成规模显著的稳定性热点;⑤ 人均GDP、人均公共医疗卫生支出、城市化水平及环境质量等因素对居民健康水平时空变化具有显著影响,随着人均GDP与人均公共医疗卫生支出的增加、城市化水平的提高及环境质量的改善,居民健康水平随之提高。未来,还需对居民健康水平的多时域、多尺度及多影响机制等问题开展深入研究。
Analysis of regional differences in health level of Chinese residents
中国居民健康水平的区域差异分析
Study on the spatial distribution pattern of physical health in China
中国省域国民体质健康空间分异格局研究
Spatial econometric analysis of regional differences and influencing factors of urban and rural health equity
城乡健康公平区域差异及影响因素的空间计量分析
Health difference of the elderly between the rural and urban districts
城乡老年人口健康差异研究
Health inequality among the Chinese elderly: Changes, regional disparities and determinants
This paper examines patterns and trends in health inequality of the Chinese elderly over 1998-2008 using data from Chinese Longevity Health Longitudinal Survey with techniques for spatial analysis.While health status of the Chinese elderly was improving steadily,widening inequality was observed,which</br>was more serious in rural than in urban areas. There are significant differences in health status of the elderly across the provinces of China. Health status of older people was the best in the eastern region,better in the central region,and worst in the western region. The rural old,female old,oldest old,and older people without spouse had significantly poorer health than their counterparts. More attention and policy support need to be given to those "multiple vulnerable" groups,in order to improve their health status and health inequality.
老年人健康不平等的演化、区域差异与影响因素分析
文章使用"中国老年人健康长寿影响因素调查"(CLHLS)数据,利用健康质量指标和空间分析技术分析我国老年人健康状况的时间和空间演变,并利用健康集中指数证实了我国老年人健康不平等的存在及其变化趋势。研究发现,在1998~2008年间,全国老年人的健康水平处于平稳提高状态,但老年人的健康不平等现象越发严重,农村老年人的健康不平等现象较城市更为严重;同时还发现,不同省份老年人健康状况存在显著差异,东部地区老年人健康状况较好,西部地区老年人健康状况最差,其中,农村、女性、高龄、无配偶老年人健康状况要显著差于其对应群体。因此,对于这种"多重弱势"群体,应该得到社会更多的关注和政策支持,通过不同渠道改善健康水平和健康不平等现象。
Regional difference decomposition and convergence analysis of health level of the elderly
老年健康水平的区域差异分解及收敛性分析
Urban-rural disparity, digital divide and health inequality of the elderly
城乡差异、数字鸿沟与老年健康不平等
Spatial distribution and influencing factors of health level of the elderly population in China
中国老年人口健康水平空间分布及影响因素
From new situation to new national policy: Strategic thinking of actively coping with the aging population
从新国情到新国策: 积极应对人口老龄化的战略思考
Health inequality among the Chinese elderly: Changes, regional disparities and determinants
This paper examines patterns and trends in health inequality of the Chinese elderly over 1998-2008 using data from Chinese Longevity Health Longitudinal Survey with techniques for spatial analysis.While health status of the Chinese elderly was improving steadily,widening inequality was observed,which</br>was more serious in rural than in urban areas. There are significant differences in health status of the elderly across the provinces of China. Health status of older people was the best in the eastern region,better in the central region,and worst in the western region. The rural old,female old,oldest old,and older people without spouse had significantly poorer health than their counterparts. More attention and policy support need to be given to those "multiple vulnerable" groups,in order to improve their health status and health inequality.
老年人健康不平等的演化、区域差异与影响因素分析
文章使用"中国老年人健康长寿影响因素调查"(CLHLS)数据,利用健康质量指标和空间分析技术分析我国老年人健康状况的时间和空间演变,并利用健康集中指数证实了我国老年人健康不平等的存在及其变化趋势。研究发现,在1998~2008年间,全国老年人的健康水平处于平稳提高状态,但老年人的健康不平等现象越发严重,农村老年人的健康不平等现象较城市更为严重;同时还发现,不同省份老年人健康状况存在显著差异,东部地区老年人健康状况较好,西部地区老年人健康状况最差,其中,农村、女性、高龄、无配偶老年人健康状况要显著差于其对应群体。因此,对于这种"多重弱势"群体,应该得到社会更多的关注和政策支持,通过不同渠道改善健康水平和健康不平等现象。
Changes in resident income gap in China's 40 years of economic transformation
中国经济转型40年中居民收入差距的变动
Characteristics of the temporal and spatial pattern of the economic disparity and convergence between different regions in China
中国区域经济差异与收敛的时空演进特征
Research on the factors of economic divergence between the north and south of China: From the perspective of regional innovation capability differences
我国南北经济分化的影响因素研究: 基于区域创新能力差异的视角
China's changing population distribution and influencing factors: Insights from the 2020 census data
DOI:10.11821/dlxb202202008
[本文引用: 1]
Using data of the latest three decennial censuses, this paper systematically analyzes the overall spatial pattern, changing trends, and influence mechanisms of China's population distribution since 2000. The study reveals that the general population distribution pattern of "dense east and sparse west" in China has not changed, which is determined by the differences in natural geographic environments on the two sides of Hu Line. In the first decade of the century, population concentration was mainly found in the southeastern area, but it has been observed in all regions in the recent decade. Provincial capitals have become the winners of population competition and the advantages of population growth of provincial capitals have been further strengthened in the recent decade compared with 2000-2010. However, the administrative power-led effects of the increasing dominance of provincial capitals will gradually weaken with the development of their provinces. The regional differentiation of population changes is also apparent: coastal region gradually forms a dense belt of population and towns with solid population attraction based on the development of urban agglomerations; the northeast region almost turns to a complete population shrinking status; central provinces still compete fiercely for population based on their capitals; the population of Sichuan, Chongqing, and Guizhou has stopped the decline and returned to growth; and the northwest region faces the risk of population loss. In addition, this paper finds that the driving factors of regional population growth have gradually changed from economic factors to both economic and amenity factors, and the difference of amenities among regions may become an important factor for future changes in China's population geography.
2000—2020年中国人口分布格局演变及影响因素
DOI:10.11821/dlxb202202008
[本文引用: 1]
基于第五、六、七次全国人口普查数据,本文分析了2000—2020年中国人口分布的空间格局、集散态势和影响因素。结果表明,中国人口分布依然保持东密西疏的基本格局,胡焕庸线两侧的自然地理环境差异性决定了这一格局的长期稳定性;人口空间集中化趋势在21世纪初的10年内主要发生在东南半壁,但在2010—2020年间成为各区域的共同特征。省会城市的人口集聚能力持续增强,2010—2020年的优势更加凸显,但这种行政力量主导的首位度提升效应将随着全省发展阶段的演进而逐渐弱化。人口变动的区域分化明显:沿海城市群的空间连绵化逐渐形成了强吸引力、高承载力的沿海人口增长带,东北地区几乎转向全面的人口收缩,中部各省依托省会展开的人口竞争依然激烈,川渝黔地区普遍实现了人口的止降回增,西北地区则面临人口收缩风险。此外,区域人口增长的驱动因素逐渐从经济要素主导转为经济要素和舒适性要素并重,各地区舒适性的差异可能将成为影响未来人口空间格局变化的重要因素。
Healthy aging or suffering aging? Prevalence of chronic disease in elderly population in the view of healthy China strategy
健康老龄化还是病痛老龄化: 健康中国战略视角下老年人口的慢性病问题
Relative fitness and frailty of elderly men and women in developed countries and their relationship with mortality
To investigate the relationship between accumulated health-related problems (deficits), which define a frailty index in older adults, and mortality in population-based and clinical/institutional-based samples.Cross-sectional and cohort studies.Seven population-based and four clinical/institutional surveys in four developed countries.Thirty-six thousand four hundred twenty-four people (58.5% women) aged 65 and older.A frailty index was constructed as a proportion of all potential deficits (symptoms, signs, laboratory abnormalities, disabilities) expressed in a given individual. Relative frailty is defined as a proportion of deficits greater than average for age. Measures of deficits differed across the countries but included common elements.In each country, community-dwelling elderly people accumulated deficits at about 3% per year. By contrast, people from clinical/institutional samples showed no relationship between frailty and age. Relative fitness/frailty in both sexes was highly correlated (correlation coefficient >0.95, P<.001) with mortality, although women, at any given age, were frailer and had lower mortality. On average, each unit increase in deficits increased by 4% the hazard rate for mortality (95% confidence interval=0.02-0.06).Relative fitness and frailty can be defined in relation to deficit accumulation. In population studies from developed countries, deficit accumulation is robustly associated with mortality and with age. In samples (e.g., clinical/institutional) in which most people are frail, there is no relationship with age, suggesting that there are maximal values of deficit accumulation beyond which survival is unlikely.
Determinants of self-rated health in old people
老年人健康自评的影响因素分析
Perceived health and mortality: A nine-year follow-up of the human population laboratory cohort
The association between perceived health ratings ("excellent," "good," "fair," and "poor") and mortality was assessed using the 1965 Human Population Laboratory survey of a random sample of 6928 adults in Alameda County, California, and a subsequent nine-year follow-up. Risk of death during this period was significantly associated with perceived health rating in 1965. The age-adjusted relative risk for mortality from all causes for those who perceived their health as poor as compared to excellent was 2.33 for men and 5.10 for women. The association between level of perceived health and mortality persisted in multiple logistic analyses with controls for age, sex, 1965 physical health status, health practices, social network participation, income, education, health relative to age peers, anomy, morale, depression, and happiness.
Self-rated health and physician-rated health as independent predictors of mortality in elderly men
DOI:10.1093/ageing/afr161
PMID:22180414
[本文引用: 1]
When assessing health status, physicians may focus on objective symptoms and diagnoses, whereas individuals may focus more on subjective symptoms, functional limitations and quality of life.In the Zutphen Elderly Study, 710 community-living men (aged 64-84 years) were followed until death for 15 years. Self-rated health was assessed through a single-item question. Physician-rated health was estimated on a Likert scale by physicians after medical history assessment and physical examination. Both health ratings were categorised into three groups. All-cause, cardiovascular and cancer mortality rates were analysed in Cox proportional-hazards models.There were 352 (49.6%) men who felt healthy and 225 (31.7%) men with a good physician-rated health. During 15 years of follow-up 503 of 710 men (70.8%) died, of whom 229 (45.5%) from cardiovascular causes and 144 (28.6%) from cancer. Self-rated and physician-rated health both predicted independently all-cause mortality (hazard ratios [HR] for worst vs. best health category: 1.72; 95% confidence interval [CI]: 1.26-2.33, and 1.77; 95% CI: 1.36-2.29; respectively; P-values of <0.005). When self-rated and physician-rated health were discordant, mortality risk was highest when physicians had a less favourable view on the health status than the participant. Self-rated health predicted independently cancer mortality (HR 2.41), whereas physician-rated health cardiovascular mortality (HR 2.13).Self-rated and physician-rated health status predicted both all-cause mortality, and showed a differential pattern for cancer and cardiovascular diseases mortality.
The determinants of population health spatial disparities
DOI:10.2478/cer-2014-0039 URL [本文引用: 1]
Spatial variability of climate effects on ischemic heart disease hospitalization rates for the period 1989-2006 in Quebec, Canada
DOI:10.1186/1476-072X-9-5 URL [本文引用: 1]
The common cold
DOI:10.1016/S0140-6736(03)12162-9 URL [本文引用: 1]
Evidence for urban-rural disparity in temperature: Mortality relationships in Zhejiang Province, China
Humidity: A review and primer on atmospheric moisture and human health
DOI:10.1016/j.envres.2015.10.014 URL [本文引用: 1]
Infection, inflammation, height, and longevity
Using historical data from cohorts born before the 20th century in four northern European countries, we show that increasing longevity and declining mortality in the elderly occurred among the same birth cohorts that experienced a reduction in mortality at younger ages. Concurrently, these cohorts also experienced increasing adult height. We hypothesize that both the decline in old-age mortality and the increase in height were promoted by the reduced burden of infections and inflammation. Thus, early growth and cardiovascular diseases of old age may share infectious and inflammatory causes rooted in the external environment.
The effect of economic growth, urbanization, and industrialization on fine particulate matter (PM2.5) concentrations in China
DOI:10.1021/acs.est.6b02562 URL [本文引用: 1]
The impact of regional economic development and income inequality on individual's self-rated health
地区经济发展与收入分配状况对我国居民健康差异的影响
Changes in urban air quality during urbanization in China
DOI:10.1016/j.jclepro.2018.03.293 URL [本文引用: 1]
Pollution, health and inequality: Escape from the environment-health-poverty trap
污染、健康与不平等: 跨越“环境健康贫困”陷阱
An analysis on the health status of the older persons in China
中国老年人口健康状况分析
Disparities of medical care access between rural and urban seniors: Based on the data from 2011 CLHLS
我国城乡老年人口医疗服务可及性差异研究: 基于2011年中国老年健康影响因素跟踪调查数据
Research on the relationship between social and economic status, social security treatment and elderly health: Based on the dataset of China household income survey
经济地位、社会保障待遇与老年健康关联研究: 基于中国居民收入调查数据的分析
An empirical study on fiscal incentives of local governments in supply of public services for migrant population in China
流动人口公共服务供给中的地方政府财政激励实证研究
Health Insurance coverage and medical expenditures of immigrants and native-born citizens in the United States
DOI:10.2105/AJPH.2008.144733
PMID:19443829
[本文引用: 1]
I examined insurance coverage and medical expenditures of both immigrant and US-born adults to determine the extent to which immigrants contribute to US medical expenditures.I used data from the 2003 Medical Expenditure Panel Survey to perform 2-part multivariate analyses of medical expenditures, controlling for health status, insurance coverage, race/ethnicity, and other sociodemographic factors.Approximately 44% of recent immigrants and 63% of established immigrants were fully insured over the 12-month period analyzed. Immigrants' per-person unadjusted medical expenditures were approximately one half to two thirds as high as expenditures for the US born, even when immigrants were fully insured. Recent immigrants were responsible for only about 1% of public medical expenditures even though they constituted 5% of the population. After controlling for other factors, I found that immigrants' medical costs averaged about 14% to 20% less than those who were US born.Insured immigrants had much lower medical expenses than insured US-born citizens, even after the effects of insurance coverage were controlled. This suggests that immigrants' insurance premiums may be cross-subsidizing care for the US-born. If so, health care resources could be redirected back to immigrants to improve their care.
Migrant population and the development of Shanghai: Influence, trend and countermeasures
外来人口与上海市的发展: 影响、趋势与对策
Research on the effective supply of urban community pension service resources in China
我国城市社区养老服务资源有效供给问题研究
Improving migrants' access to the public health insurance system in China: A conceptual classification framework
DOI:10.1177/0117196817705779 URL [本文引用: 1]
Equalization of urban and rural public goods supply and improvement of transfer payment system
城乡公共品供给均等化与转移支付制度的完善
The impact of large-scale population outflow on rural family structure and its countermeasures: Based on the data of Sichuan Province
人口大规模流出对农村家庭结构的影响及对策研究: 基于四川省的数据
The contemporary transition of the Chinese family and the reconstruction of family policy
当代中国家庭变迁与家庭政策重构
The relationship between elderly suicides rates, household size and family structure: A cross-national study
DOI:10.3109/13651500902887656
PMID:24916934
[本文引用: 1]
Background. Cultural factors may influence cross-national variations in elderly suicide rates. Methods. A cross-national study examining the relationship between elderly suicide rates and (i) mean household size and (ii) family structure was conducted with the "a priori" unidirectional hypothesis that larger mean household size and greater proportion of extended families may imply a greater number of people being potentially available within the household to provide support and respect to the elderly and to hold them in high esteem, and ultimately leading to reduction in elderly suicide rates. Data on elderly suicide rates was ascertained from the World Health Organisation website. Data on mean household size and family structure was ascertained from a report from the Inter-American Development Bank. Results. The main findings were elderly suicide rates in both sexes were significantly correlated with the mean household size (negative), percentage of extended households (negative; except in males aged 65-74 years where this approached significance) and percentage of single person households (positive). Conclusions. The impact of mean household size and family structure on elderly suicide rates may interact with and be modified and mediated through cultural factors. The contribution of cross-national differences in cultural factors on elderly suicide rates requires further study by formally measuring cultural factors with validated instruments.
A genome-wide association study of aging
Does education contribute to improve physical and mental health? Based on the data from Jiangsu provision
教育有助于改善身心健康吗? 基于江苏省的数据分析
The impact of the implementation of the new environmental protection law on investment efficiency of heavy pollution industry
新《环境保护法》实施对重污染行业投资效率的影响
Do constraints on local governments' environmental targets affect industrial transformation and upgrading?
地方政府环境目标约束是否影响了产业转型升级?
New environmental protection law and corporate green innovation: forcing or forcing out
新《环保法》与企业绿色创新: “倒逼”抑或“挤出”
The consequences of spatially differentiated water pollution regulation in China
DOI:10.1016/j.jeem.2018.01.010 URL [本文引用: 1]
Gender differences in the effect of marriage on the health and longevity of the elderly in China
婚姻对中国高龄老人健康长寿影响的性别差异分析
A research on regional longevity phenomenon, China's regional standards and its evaluation index system
中国区域长寿现象与区域长寿标准评价体系
The characteristics and influencing factors of health status in Chinese elderly
中国老年人健康状况分布特征及其影响因素分析
Interactive techniques and exploratory spatial data analysis
Evolvement of spatial pattern of economy in Jiangsu Province at county level
DOI:10.11821/xb200906008
[本文引用: 1]
This article, taking Jiangsu Province as an example, describes the spatial changes of the diverse economy of Jiangsu at county level since the 1990s through the related analysis of ESDA as well as other tools such as Moran's I, Getis-Ord General G, Getis-Ord Gi and the function of variogram and its amount of fractal dimension as scale index. Based on four time discontinuity surfaces, some conclusions are drawn as follows. (1) Considering the overall spatial economic framework, the county economy of Jiangsu province shows a strong trend of spatial natural correlation. The similar areas cluster in space. The space structure of the hotspot distribution tends to be the circular space structure centered on Wuxi and Suzhou. (2) The development of the spatial economic growth framework is likely to be more stochastic and unstable in the aspect of spatial distribution. Hotspot areas are changing frequently without obvious appearance of geographical concentration. (3) According to the space-time mechanism, the Jiangsu spatial economic framework tends to be more continuous and self-organized, the random of the spatial differential pattern keeps decreasing and the mechanism of the structural differentiation caused by natural correlation in space is becoming more and more remarkable. The homogeneousness of economic development in the direction of northeast-southwest is typical for its relatively small spatial difference. As to the opposite direction, the spatial difference is great. (4) The driving force of the evolvement of Jiangsu economic framework can be identified through the following aspects: the basis of historical development, the economic location and the policies on regional development.
基于县域单元的江苏省经济空间格局演化
Local indicators of spatial association-LISA
DOI:10.1111/j.1538-4632.1995.tb00338.x URL [本文引用: 1]
The analysis of spatial association by use of distance statistics
DOI:10.1111/j.1538-4632.1992.tb00261.x URL [本文引用: 1]
Geographically and temporally weighted regression for modeling spatio-temporal variation in house prices
DOI:10.1080/13658810802672469 URL [本文引用: 1]
A new geographically and temporally weighted regression model for panel data based on holograph mapping
一种新的基于全息映射的面板时空地理加权回归模型方法
Multi-dimensional analysis of urban expansion patterns and their driving forces based on the center of Gravity-GTWR model: A case study of the Beijing-Tianjin-Hebei urban agglomeration
DOI:10.11821/dlxb201806007
[本文引用: 1]
Research into urban expansion patterns and their driving forces is of great significance. Under the background of the integrated development of the Beijing-Tianjin-Hebei (Jing-Jin-Ji) urban agglomeration, it is important to study the temporal and spatial patterns of urban land expansion and the driving forces development. This paper uses land-use data of the Jing-Jin-Ji urban agglomeration from 1990 to 2015 and reveals the multi-dimensional characteristics of the urban land expansion patterns. We then combine the urban spatial interaction and the spatial and temporal nonstationarity of the urban land expansion process and build the center of gravity-geographically and temporally weighted regression (GTWR) model by coupling the center of gravity model with the GTWR model. Using the center of gravity-GTWR model, we analyze the driving forces of urban land expansion at the city scale, and summarize the dominant mode and core driving forces of the Jing-Jin-Ji urban agglomeration. The results show that: (1) Between 1990 and 2015, the expansion intensity of the Jing-Jin-Ji urban agglomeration showed a down-up-down trend, and the peak period of expansion was in 2005-2010. Before 2005, high-speed development was seen in Beijing, Tianjin, Baoding, and Langfang, which were then followed by rapid development in Xingtai and Handan. (2) Although the center of gravity of cities in the Jing-Jin-Ji urban agglomeration showed a divergent trend, the local interaction between cities was enhanced, and the driving forces of urban land expansion showed a characteristic of spatial spillover. (3) The spatial development mode of the Jing-Jin-Ji urban agglomeration changed from a dual-core development mode to a multi-core development mode, which was made up of three function cores: the transportation core in the northern part, the economic development core in the central part, and the investment core in the southern part. The integrated development between functional cores led to the multi-core development mode. (4) The center of gravity-GTWR model analyzes urban land expansion as a space-time dynamic system. The model proved to be feasible in the analysis of the driving forces of urban land expansion.
基于重心-GTWR模型的京津冀城市群城镇扩展格局与驱动力多维解析
DOI:10.11821/dlxb201806007
[本文引用: 1]
城镇用地扩展格局及驱动力研究对城市群发展规划与决策具有重要意义。以京津冀地区为例,基于城镇用地扩展强度指数、城镇用地扩展差异指数、分形维数、土地城镇化率和重心转移模型,多维解析了城市群城镇用地扩展格局特征,并耦合重心转移模型和时空地理加权回归(GTWR)模型构建重心-GTWR模型,在对空间格局进行长时间序列多维度指标分析的基础上,运用该模型依序对其特征进行驱动力解读,进而总结凝练京津冀区域发展的主导模式与城市核心驱动力。主要结论为:① 1990-2015年,京津冀城市群城镇用地扩展强度呈现“下降—上升—下降”的趋势,高峰时期在2005-2010年,在2005年之前高速发展城市集中在北京、天津、保定和廊坊,2005年之后集中在邢台和邯郸;② 城市群城镇用地重心虽呈现出发散态势,但城市之间的局部相互作用力逐渐增强,城镇用地扩展驱动力表现出空间溢出特征;③ 京津冀城市群空间发展模式由以北京和天津为中心的双核发展模式向多核发展模式转变,并出现北部资源运输核心、中部经济发展核心和南部投资发展核心三大功能核心组团,城市群趋向于多核功能协同发展模式;④ 重心-GTWR模型结合了时空非平稳性和城市空间相互作用,将城市群城镇用地扩展作为一个时空变化系统进行分析,经验证,该模型在城镇用地扩展格局驱动力分析研究中具有可行性。
