

1 引言
独特的地质背景、典型的二元水文结构与不合理的人类活动相叠加,导致喀斯特地区石漠化问题严峻[1]。石漠化所引发的生态系统退化不仅降低了区域生态系统服务的供给,同时还限制了喀斯特山地生态屏障功能的有效发挥,严重制约区域社会经济的可持续发展,威胁区域生态安全格局的稳定性[2]。在此背景下,如何实现生态系统服务的优化与提升成为中国喀斯特研究领域的关键议题[3]。而精准探析喀斯特地区生态系统服务的环境影响因子,可为石漠化科学治理提供理论参考,是实现生态系统服务优化与提升的有效途径[4]。已有研究表明,环境影响因子识别结果受尺度变换的影响[5]。因此,厘定喀斯特生态系统服务相关环境变量的适用尺度与最优解释力,成为环境影响因子识别过程中的关键科学问题。
目前喀斯特地区生态系统服务影响因子识别的研究,多采用相关或回归统计方法,如李瑞等[6]采用二次多项式回归的方法揭示了贵州典型喀斯特小流域降雨因子与土壤侵蚀的关系。赵斯琦等[7]通过对比不同地形因子与土壤侵蚀线性回归方程的相关系数,识别影响土壤侵蚀的主导地形因子。上述研究缺乏对生态系统服务和环境因子空间属性的考虑,且对于多因子及其交互作用的定量研究不足[8]。同时,Martinez等[9]研究表明,生态系统服务影响因子识别具有空间尺度效应。在不同幅度和粒度情况下,环境因子与生态系统服务的作用关系存在差异[10]。但目前对喀斯特生态系统服务影响因子识别的研究,其尺度多采用单一空间粒度。如Deng等[11]研究了基础数据统一为0.125°分辨率时,中国喀斯特地区降水、温度和NDVI与土壤水分的作用关系;魏梦瑶等[12]以1 km×1 km为统一网格大小,研究不同土地利用方式和地形特点与土壤侵蚀的作用关系。与此类工作相比,从多尺度视角开展喀斯特生态系统服务的精准归因工作,可以有效避免单一尺度在采用低分辨率数据时丢失局部限制因素的作用信息,在采用高精度数据时,掩盖宏观控制因素信息的尺度问题。
除受空间粒度的影响,环境因子与生态系统服务之间的作用关系也会随空间幅度的变化而产生差异[13]。例如,Wu等[14]研究指出影响草地生产力的主导环境因子在全国尺度上为温度和降水,而在喀斯特地区由温度主导。Li等[15]研究指出在全流域尺度上,影响土壤侵蚀的主导环境因子是温度和NDVI,在红水子流域尺度则为径流和降水。目前生态系统服务的归因研究多集中于区域尺度,对区域内部的固有异质性关注较少[16]。中国西南喀斯特地区包含岩溶河谷、峰丛洼地、断陷盆地、岩溶高原、中高山等多种地貌类型,区域内部景观异质性显著。地貌的区域分异直接影响地表水分与光照强度,从而在一定程度上控制着生态系统服务的驱动因子[17]。高度不连续且破碎的景观特征,使得该地区生态系统服务及环境影响因子的空间分布在不同地貌类型区之间差异显著。因此从不同地貌形态类型区尺度,分析喀斯特地区生态系统服务影响因子的差异,可为石漠化针对性治理提供科学参考。
石漠化是地表植被破坏后,经水土流失作用而产生的表土损失、基岩裸露、土地农业利用价值丧失和生态环境退化现象[18],因而土壤保持与产流服务是遏制喀斯特地区石漠化发展的关键[19]。尽管目前已有研究揭示了降水、地形和土地利用类型等要素与土壤侵蚀和产水量的关系[20],但对于多因子综合分析以及双因子交互作用的研究较少,关注尺度效应对归因结果影响的研究更为不足。地理探测器具有能够定量化显示影响因子对研究对象解释力的特点[21],通过比对不同环境因子的解释力可以实现多因子综合分析。同时,地理探测器还可以通过对比单因子和双因子作用大小的差异,获取双因子交互作用关系。基于此,本文以多尺度为视角,选取坡度、海拔、降水、岩性、植被覆盖度、土地利用类型等多种环境因子,运用地理探测器定量分析不同环境因子对土壤侵蚀和产水量空间分布的解释力及其多尺度变化规律,识别环境因子的最优解释力,进而精准判识不同地貌形态类型区内主导影响因子及因子间交互作用。
2 研究方法与数据来源
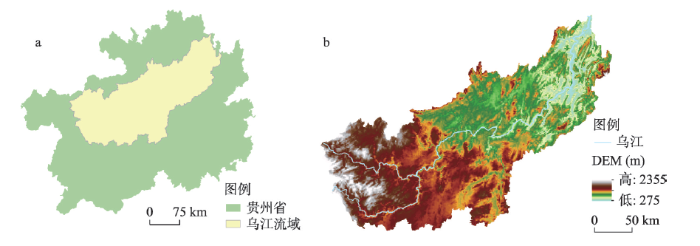
2.1 研究区概况
图1
2.2 研究框架
本文从驱动因子解释力的多尺度效应视角出发,识别不同环境因子对土壤侵蚀和产水量空间分布的最优解释力,研究框架如下:① 研究数据主要包括:气象数据、土壤数据、土地利用数据、岩性数据、地貌类型数据、数字高程模型(DEM)和归一化植被指数(NDVI)(数据来源见表1),其中气象数据、土地利用数据和NDVI的数据时间为2015年。通过ArcGIS10.2将上述研究数据重采样为30 m、100 m、300 m、500 m、1 km和2 km共6种空间分辨率,选用RUSLE和InVEST模型优化模拟不同分辨率下的土壤侵蚀模数和产水量;② 根据地形起伏特征,将研究区低海拔平原、低海拔丘陵、中海拔台地、小起伏中山等11种地貌类型[23]合并为台地、丘陵和山地3种地貌形态类型区。地理探测器应用于不同地貌形态类型区,识别不同分辨率下单因子和因子间交互作用对土壤侵蚀和产水量的解释力;③ 根据环境因子解释力随分辨率变化的趋势及其最佳分辨率(最大解释力所对应的分辨率)大小,判定环境因子为宏观、局地或平稳因子。若解释力随分辨率降低而增大,最佳分辨率大于或等于1 km,即为宏观因子;若解释力随分辨率降低而减小,最佳分辨率小于或等于300 m,则为局地因子;若解释力随分辨率降低无明显变化,则为平稳因子。④ 以最佳分辨率所对应的解释力为环境因子对土壤侵蚀和产水量的最优解释力,对比不同地貌形态类型区内环境因子最优解释力的大小,从而识别出影响土壤侵蚀和产水量空间分布的主导因子。
表1 数据来源
Tab. 1
| 数据类型 | 数据来源 |
|---|---|
| 气象数据 | 国家气象科学数据中心( |
| 土壤数据 | 世界土壤数据库(HWSD)、全国第二次土壤普查数据库 |
| 土地利用 岩性、地貌 | 中国科学院资源环境科学数据中心( |
| DEM | Google Earth影像 |
| NDVI | 美国地质调查局官网( |
2.3 分析方法
2.3.1 RUSLE模型
式中:A是年均土壤侵蚀模数(t hm-2 a-1);α为石漠化系数,依据不同石漠化程度的基岩裸露率获得(表2);R为降雨侵蚀力因子(MJ mm hm-2 h-1 a-1),采用章文波等[26]所提出的基于日降雨量数据的降雨侵蚀力估算方法,并针对喀斯特地区进行修正。在喀斯特地区采用≥ 30 mm作为侵蚀性降雨标准,在非喀斯特地区则以≥ 12 mm为标准[27];K为土壤可蚀性因子(t hm h MJ-1 mm-1 hm-2),计算采用Williams等[28]提出的侵蚀力影响计算器(EPIC);LS为地形因子,选用由McCool等[29]提出、Zhang等[30]修正的LS计算方法得出;C为植被覆盖与管理因子,应用蔡崇法等[31]的研究算法得出;P为水土保持措施因子,参考Gao等[25]针对喀斯特地区的赋值标准。LS、C、P无量纲。
表2 不同石漠化程度土壤侵蚀修正系数
Tab. 2
| 石漠化程度 | 无 | 潜在 | 轻微 | 中度 | 高 | 极高 |
|---|---|---|---|---|---|---|
| 基岩裸露率(%) | < 20 | 20~30 | 31~50 | 51~70 | 71~90 | > 90 |
| α | 10 | 25 | 40 | 60 | 80 | 95 |
2.3.2 InVEST模型
选用InVEST模型[32]模拟流域产水量,模型的产水量模块基于Budyko水热耦合平衡假设,公式如下:
式中:Y(x)为研究区每个栅格单元的年产水量;AET(x)为每个栅格单元的年实际蒸散量;P(x)为每个栅格单元的年降水量,单位均为mm。
其中:实际蒸散量与降水量比值AET(x)/P(x)的计算,同样基于Budyko水热耦合平衡假设公式。
式中:PET(x)为研究区的潜在蒸散量,可根据植物蒸散系数和参考作物蒸散量计算得到,公式如下:
式中:Kc(lx)为植物蒸散系数,体现不同植被对产流量的影响;ET0(x)为参考作物蒸散量,可通过彭曼公式计算得到。
式中:ω(x)为表征自然气候土壤性质的非物理参数;AWC(x)为土壤有效含水量,Z为经验常数,代表季节性因素的影响。
2.3.3 地理探测器
地理探测器是一种探测、利用空间异质性并揭示其驱动因子的新兴统计方法[33],主要包括因子、生态、风险和交互四个探测部分。地理探测器通过探测各因子的空间分异性,给出表征影响因子对土壤侵蚀和产水量作用程度的q值。因子探测器的计算公式如下:
式中:q为自变量对因变量的解释力,值域为[01],q值越大,自变量对因变量的解释力越大,即表明各环境影响因子对土壤侵蚀和产水量空间分布的解释力越大;L为自变量X的类别数,N为研究区所有栅格单元总数,Nh为自变量X的类型h的栅格单元总数,σ2为研究区所有样本的总方差,q为自变量X的类型h的总方差。
交互作用探测器用来识别不同影响因子的交互作用,通过对比单因子和双因子作用大小的差异性来获取其作用关系(表3)。
表3 双因子交互作用类型[33]
Tab. 3
| 判断依据 | 交互类型 |
|---|---|
| q(X1∩X2) < Min(q(X1), q(X2)) | 非线性减弱 |
| Min(q(X1), q(X2)) < q(X1∩X2) < Max(q(X1), q(X2)) | 单因子非线性减弱 |
| q(X1∩X2) > Max(q(X1), q(X2)) | 双因子增强 |
| q(X1∩X2) = q(X1)+q(X2) | 独立 |
| q(X1∩X2) > q(X1)+q(X2) | 非线性增强 |
3 结果分析
3.1 不同分辨率下土壤侵蚀和产水量模拟
RUSLE模型模拟结果显示,2015年乌江流域土壤侵蚀模数在不同分辨率情况下均值范围为17.64~17.95 t hm-2 a-1,以微度侵蚀和轻度侵蚀为主。与Zeng等[34]应用RUSLE模型模拟典型喀斯特地区——贵州省印江县的土壤侵蚀模数(18.84 t hm-2 a-1)较为接近。随分辨率降低,乌江流域的土壤侵蚀模数均值呈小幅减小,各分辨率下的侵蚀模数均值都在18 t hm-2 a-1左右。同时,随分辨率的降低,流域内土壤侵蚀模数的最大值显著减小,30 m分辨率的土壤侵蚀模数最大值为1419.61 t hm-2 a-1,2 km分辨率的最大值降至357.20 t hm-2 a-1,最小值均为0值,没有随分辨率发生改变。
InVEST模型的模拟结果显示,产水量在不同分辨率情况下均值在967.59~968.18 mm之间,其空间分布呈现北低南高的特点(图2)。这一结果与前人研究喀斯特地区产水量的结果较为吻合[35-36]。随着分辨率的降低,产水量的均值和最大值小幅减小,各分辨率均值、最大值分别保持在968 mm和1442 mm左右。产水量的最小值则随分辨率降低而显著增加,30 m分辨率的产水量最小值为403.38 mm,2 km分辨率的产水量最小值升至487.17 mm。土壤侵蚀模数与产水量均值随分辨率的变化规律与Martinez等[9]应用大块样地(3.05 m×9.1 m)和小块样地(0.61 m×1.22 m)两个尺度的田间试验数据,分析尺度差异对牧场产水量和土壤侵蚀量的影响较为一致,均表现为随分辨率降低,模拟值减小。
图2
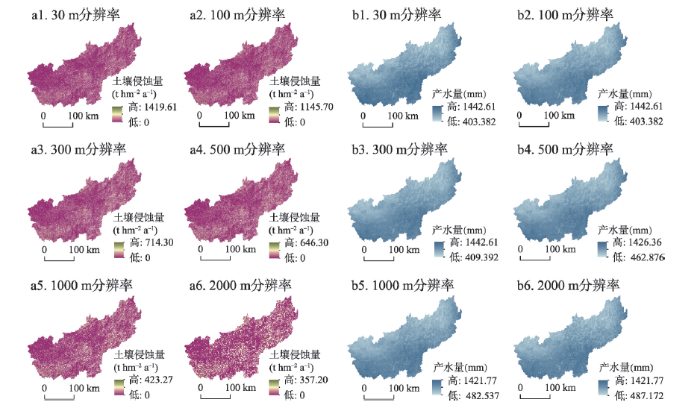
图2
乌江流域不同分辨率下土壤侵蚀和产水量的空间分布
Fig. 2
Spatial distribution of soil erosion and water yield at different resolutions in the Wujiang River Basin
3.2 土壤侵蚀和产水量的多尺度定量归因
空间尺度的变换显著影响环境因子对土壤侵蚀空间分布的解释力(图3)。台地类型区坡度的解释力在1 km分辨率时为18%,而在2 km分辨率时升至27%。随分辨率降低,不同环境因子解释力的变化趋势不同。坡度、土地利用类型的解释力均随分辨率降低而增大,在1 km或2 km分辨率时达到最优,为宏观因子。其他环境因子的解释力随分辨率的变化情况,在不同地貌形态类型区内存在差异。植被覆盖度在台地、丘陵类型区的解释力随分辨率的降低而增大,在山地类型区随分辨率降低解释力减小,这可能与不同地貌形态类型区内植被分布的差异性有关。表4显示了环境因子最优解释力之间的相对位次。其中坡度、植被覆盖度和土地利用类型是土壤侵蚀的主要影响因子,其他因子的解释力有限(< 3%)。不同地貌形态类型区内土壤侵蚀的主导影响因子存在差异。在地形起伏度相对较小的台地和丘陵类型区,坡度对土壤侵蚀的解释力最强。在地形起伏度较大的山地类型区,植被覆盖度成为控制土壤侵蚀空间格局的主导因子。
图3
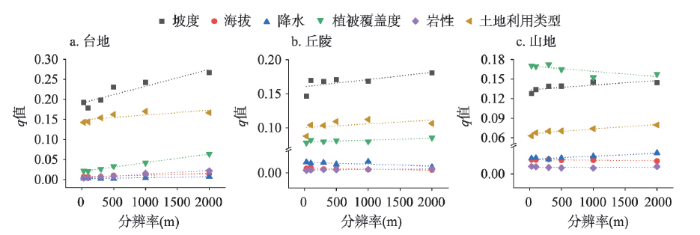
图3
不同地貌类型区内环境因子对土壤侵蚀的解释力随分辨率的变化
Fig. 3
Variation of explanatory power of environmental factors on soil erosion with resolutions in different geomorphological areas
表4 不同地貌类型区内环境因子对土壤侵蚀的最优解释力排序
Tab. 4
| 地貌类型区 | 排序 | 环境因子 | 因子类型 | 最佳分辨率(m) | 最优解释力(q值) |
|---|---|---|---|---|---|
| 台地 | 1 | 坡度 | 宏观 | 2000 | 0.27 |
| 2 | 土地利用类型 | 宏观 | 1000 | 0.17 | |
| 3 | 植被覆盖度 | 宏观 | 2000 | 0.06 | |
| 4 | 岩性 | 宏观 | 2000 | 0.02 | |
| 5 | 海拔 | 宏观 | 2000 | 0.01 | |
| 6 | 降水 | 宏观 | 2000 | 0.01 | |
| 丘陵 | 1 | 坡度 | 宏观 | 2000 | 0.18 |
| 2 | 土地利用类型 | 宏观 | 1000 | 0.11 | |
| 3 | 植被覆盖度 | 宏观 | 2000 | 0.09 | |
| 4 | 降水 | 局地 | 1000 | 0.02 | |
| 5 | 海拔 | 局地 | 100 | 0.01 | |
| 6 | 岩性 | 宏观 | 2000 | 0.01 | |
| 山地 | 1 | 植被覆盖度 | 局地 | 300 | 0.17 |
| 2 | 坡度 | 宏观 | 1000 | 0.15 | |
| 3 | 土地利用类型 | 宏观 | 2000 | 0.08 | |
| 4 | 降水 | 宏观 | 2000 | 0.02 | |
| 5 | 海拔 | 局地 | 300 | 0.01 | |
| 6 | 岩性 | 平稳 | 30 | 0.01 |
海拔在台地类型区对产水量的解释力在不同分辨率下差异显著,其解释力在300 m分辨率时为45%,在2 km分辨率时降至34%。其他环境因子的解释力虽然对于分辨率的响应程度较小,但也呈现一定规律(图4):降水和海拔均表现为在台地、丘陵类型区随分辨率的降低其解释力减小,在山地类型区随分辨率的降低其解释力增大。由表5可知,降水、海拔、土地利用类型是影响研究区产水量空间分布的主要影响因子,岩性、植被覆盖度和坡度的解释力较低(< 10%)。降水在所有地貌形态类型区内均为产水量的主导影响因子,解释力高达75%以上,显著高于其他环境因子。影响产水量空间分布的第二因子在不同地貌形态类型区中存在差异,在台地类型区为海拔,在山地、丘陵类型区则为土地利用类型。
图4
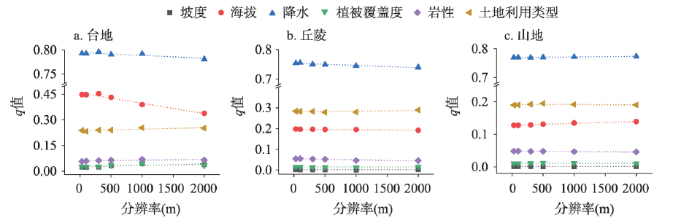
图4
不同地貌类型区内环境因子对产水量的解释力随分辨率的变化
Fig. 4
Variation of explanatory power of environmental factors on water yield with resolutions in different geomorphological areas
表5 不同地貌类型区内环境因子对产水量的最优解释力排序
Tab. 5
| 地貌 类型区 | 排序 | 环境因子 | 因子类型 | 最佳 分辨率(m) | 最优解释力 (q值) |
|---|---|---|---|---|---|
| 台地 | 1 | 降水 | 局地 | 300 | 0.80 |
| 2 | 海拔 | 局地 | 300 | 0.45 | |
| 3 | 土地利用类型 | 宏观 | 1000 | 0.25 | |
| 4 | 岩性 | 宏观 | 1000 | 0.07 | |
| 5 | 植被覆盖度 | 宏观 | 1000 | 0.05 | |
| 6 | 坡度 | 宏观 | 1000 | 0.04 | |
| 丘陵 | 1 | 降水 | 局地 | 100 | 0.76 |
| 2 | 土地利用类型 | 宏观 | 2000 | 0.29 | |
| 3 | 海拔 | 局地 | 30 | 0.20 | |
| 4 | 岩性 | 局地 | 100 | 0.06 | |
| 5 | 植被覆盖度 | 平稳 | 2000 | 0.02 | |
| 6 | 坡度 | 平稳 | 2000 | 0.00 | |
| 山地 | 1 | 降水 | 宏观 | 2000 | 0.77 |
| 2 | 土地利用类型 | 平稳 | 500 | 0.19 | |
| 3 | 海拔 | 宏观 | 2000 | 0.14 | |
| 4 | 岩性 | 局地 | 100 | 0.05 | |
| 5 | 植被覆盖度 | 平稳 | 500 | 0.01 | |
| 6 | 坡度 | 平稳 | 2000 | 0.00 |
3.3 不同尺度下土壤侵蚀和产水量对双因子交互作用的响应
交互作用探测器的结果显示,环境因子两两叠加均会增强其对土壤侵蚀的解释力,表现为双因子增强或非线性增强。植被覆盖度、坡度单因子作用时对山地类型区土壤侵蚀的解释力分别为0.17、0.08,双因子叠加作用时解释力升至0.32。空间尺度的变换对双因子交互作用的影响也十分显著。在台地类型区,坡度和植被覆盖度的交互作用对土壤侵蚀的解释力在300 m分辨率时为31%,在2 km分辨率时升至53%(图5)。随分辨率降低,不同交互作用解释力的变化趋势存在差异。坡度与其他环境因子叠加的解释力均随分辨率降低而增大,在2 km分辨率时达到最优,为宏观交互作用。其他因子间交互作用的解释力随分辨率变化的情况在不同地貌形态类型区表现不同,植被覆盖度和土地利用类型叠加的解释力在台地、丘陵类型区随分辨率降低而增大,在山地类型区不同分辨率下差异较小。由表6可知,坡度和植被覆盖度之间的交互作用对土壤侵蚀空间分布的解释力最强。第二交互作用在不同地貌形态类型区中存在差异,在台地类型区为坡度和土地利用类型交互,在山地、丘陵类型区则为植被覆盖度和土地利用类型交互。
图5
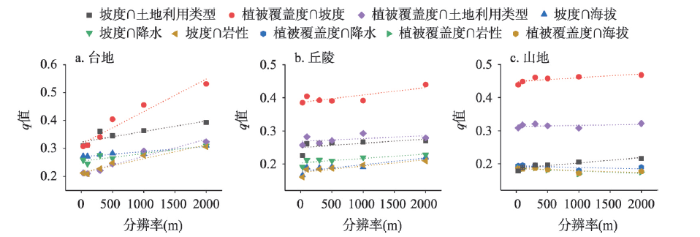
图5
不同地貌类型区内双因子交互作用对土壤侵蚀的解释力随分辨率的变化
Fig. 5
Variation of explanatory power of interactions between two factors on soil erosion with resolutions in different geomorphological areas
表6 不同地貌类型区内双因子交互作用对土壤侵蚀的最优解释力排序
Tab. 6
| 地貌 类型区 | 排序 | 交互因子 | 因子类型 | 最佳 分辨率(m) | 最优解释力 (q值) |
|---|---|---|---|---|---|
| 台地 | 1 | 坡度∩植被覆盖度 | 宏观 | 2000 | 0.53 |
| 2 | 坡度∩土地利用类型 | 宏观 | 2000 | 0.39 | |
| 3 | 植被覆盖度∩土地利用类型 | 宏观 | 2000 | 0.32 | |
| 4 | 坡度∩海拔 | 宏观 | 2000 | 0.31 | |
| 5 | 坡度∩降水 | 宏观 | 2000 | 0.31 | |
| 6 | 坡度∩岩性 | 宏观 | 2000 | 0.31 | |
| 丘陵 | 1 | 坡度∩植被覆盖度 | 宏观 | 2000 | 0.44 |
| 2 | 植被覆盖度∩土地利用类型 | 宏观 | 1000 | 0.29 | |
| 3 | 坡度∩土地利用类型 | 宏观 | 2000 | 0.27 | |
| 4 | 坡度∩降水 | 宏观 | 2000 | 0.23 | |
| 5 | 坡度∩海拔 | 宏观 | 2000 | 0.22 | |
| 6 | 坡度∩岩性 | 宏观 | 2000 | 0.21 | |
| 山地 | 1 | 植被覆盖度∩坡度 | 宏观 | 2000 | 0.47 |
| 2 | 植被覆盖度∩土地利用类型 | 平稳 | 2000 | 0.32 | |
| 3 | 坡度∩土地利用类型 | 宏观 | 2000 | 0.22 | |
| 4 | 植被覆盖度∩降水 | 局地 | 100 | 0.20 | |
| 5 | 植被覆盖度∩岩性 | 局地 | 30 | 0.19 | |
| 6 | 植被覆盖度∩海拔 | 局地 | 300 | 0.19 |
与单因子作用相似,环境因子间的交互作用对产水量的解释力对于分辨率的响应程度较小,但仍表现出一定规律(图6)。海拔和土地利用类型交互作用的解释力,在台地类型区随分辨率的降低而减小,在山地、丘陵类型区则随分辨率的降低而增大。降水与其他环境因子(除土地利用)间交互作用的解释力,在台地、丘陵类型区随分辨率的降低而减小,在山地类型区随分辨率降低而增大,在2 km分辨率下最优。环境因子间的两两交互作用会增强其对产水量的解释力,在台地类型区,降水和土地利用类型单因子作用时其解释力分别为0.80和0.45,交互作用时升至0.98。由表7可知,降水和土地利用类型的交互是影响产水量空间分布的主导交互作用,解释力高达95%以上,显著高于其他环境因子间的交互作用。解释力在75%~80%之间的交互作用,均为降水与其他环境因子的叠加。
图6
图6
不同地貌类型区内双因子交互作用对产水量的解释力随分辨率的变化
Fig. 6
Variation of explanatory power of interactions between two factors on water yield with resolutions in different geomorphological areas
表7 不同地貌类型区内双因子交互作用对产水量的最优解释力排序
Tab. 7
| 地貌 类型区 | 排序 | 交互因子 | 因子类型 | 最佳 分辨率(m) | 最优解释力 (q值) |
|---|---|---|---|---|---|
| 台地 | 1 | 降水∩土地利用类型 | 局地 | 30 | 0.98 |
| 2 | 降水∩岩性 | 局地 | 300 | 0.80 | |
| 3 | 降水∩植被覆盖度 | 局地 | 300 | 0.80 | |
| 4 | 降水∩海拔 | 局地 | 300 | 0.80 | |
| 5 | 降水∩坡度 | 局地 | 300 | 0.80 | |
| 6 | 海拔∩土地利用类型 | 局地 | 300 | 0.67 | |
| 丘陵 | 1 | 降水∩土地利用类型 | 宏观 | 1000 | 0.97 |
| 2 | 降水∩海拔 | 局地 | 100 | 0.76 | |
| 3 | 降水∩岩性 | 局地 | 100 | 0.76 | |
| 4 | 降水∩植被覆盖度 | 局地 | 100 | 0.76 | |
| 5 | 降水∩坡度 | 局地 | 100 | 0.76 | |
| 6 | 海拔∩土地利用类型 | 宏观 | 2000 | 0.50 | |
| 山地 | 1 | 降水∩土地利用类型 | 宏观 | 2000 | 0.97 |
| 2 | 降水∩海拔 | 宏观 | 2000 | 0.79 | |
| 3 | 降水∩岩性 | 宏观 | 2000 | 0.78 | |
| 4 | 降水∩植被覆盖度 | 宏观 | 2000 | 0.78 | |
| 5 | 降水∩坡度 | 宏观 | 2000 | 0.78 | |
| 6 | 海拔∩土地利用类型 | 宏观 | 2000 | 0.33 |
4 讨论与结论
4.1 讨论
基于发生学视角,6种环境因子均为土壤侵蚀和产水量的重要影响因子,但不同环境因子对土壤侵蚀和产水量的控制程度存在差异[37]。精准辨识研究区生态系统服务变量的主导影响因子,可为当地石漠化科学治理提供针对性参考。研究结果表明,坡度和植被覆盖度是土壤侵蚀的主导影响因子,两因子间的交互作用对土壤侵蚀的解释力最强,这与王尧等[38]研究得出乌江流域高强度土壤侵蚀多发生在坡地和低植被覆盖度地区的结论相符。产水量的主导影响因子为降水,与胡奕等[39]研究表明降雨是影响我国西南喀斯特地区产水量的主要因子的结论较为一致。降水和土地利用类型的交互作用对产水量空间分布的解释力高达95%以上。不同土地利用类型下,产水量差异显著。林地、草地地区植被覆盖度高,对降水的截流作用明显,产水量较低,地表径流有效减少,水土流失减弱[40]。而裸岩石质地、城镇工矿用地等地区,在自然或人为因素作用下形成地表不透水层,产水量较高[41]。大量地表径流从裸露地区向土壤覆盖区冲刷,加重水土流失,从而形成恶性循环。因此在今后石漠化防治工作中,需加强裸岩石质地和矿业废弃地的生态修复和管理,增加其地表植被覆盖。同时在城镇地区推行“海绵城市”建设,减少不透水地面的分布,从而有效减缓水土流失。
环境因子对生态系统服务变量的解释力及其尺度变化规律,受地貌宏观控制作用的显著影响[16]。不同地貌形态类型区,生态系统服务变量的主导影响因子存在差异,具体表现为:土壤侵蚀的主导影响因子在台地、丘陵类型区为坡度,在山地类型区则为植被覆盖度。这与Wang等[8]提出坡度对土壤侵蚀的解释力,随地形起伏度的增大而减小的结论相符合。环境因子在不同地貌形态类型区的空间变异性,影响其最优解释力水平[5]。在台地、丘陵类型区,地形较为平缓,海拔的空间变异性较小,提高分辨率能够保留更多细微变化信息,因而在高精度分辨率下解释力最优。而在山地类型区,地形起伏剧烈,海拔的空间变异性较大,降低分辨率能更好地从总体上反映其变化特点,因而表现为在低精度分辨率下解释力更强[42]。因此在今后开展石漠化治理工作和研究时,应综合考虑不同地貌形态类型区喀斯特生态系统服务影响机制与空间异质性。
尺度效应是指由尺度所引起的对象表达和分析结果上的变化[43]。地理过程具有明显的尺度特征,环境因子与生态系统服务的作用关系在不同尺度上存在差异[10]。若仅选用单一高精度分辨率进行生态系统服务归因,可能会掩盖宏观因子的控制作用;若仅选用单一低精度分辨率,则会导致局地因子大量的细节信息被忽略,从而降低其对生态系统服务的解释力[44]。以山地类型区的土壤侵蚀为例,植被覆盖度在山地类型区表现为局地因子,坡度则表现为宏观因子。若采用单一30 m分辨率作为研究尺度,植被覆盖度是土壤侵蚀的主导影响因子;若采用单一1 km分辨率作为研究尺度,土壤侵蚀为坡度和植被覆盖度共同主导(图4)。因选取尺度不同而造成归因结果的差异印证了尺度效应的存在[45]。在石漠化防治工作中,若忽视尺度效应的影响,很可能导致土壤侵蚀和产水量核心驱动因子识别有误,从而造成石漠化防治重点的偏差。为规避尺度效应对管理决策正确性可能带来的影响,建议今后从多尺度视角探讨环境因子与生态系统服务的关系[46]。
4.2 结论
生态系统服务主导因子的定量精准辨识,尤其是对于异质性剧烈的山地生态系统,需要综合考虑不同尺度的变化规律。以空间异质性显著的典型喀斯特流域——乌江流域为研究区,基于环境因子对土壤侵蚀和产水量空间分布的解释力在不同分辨率下的变化规律,厘定了不同环境因子的适用尺度和最优解释力,进而对比分析生态系统服务变量主导因子的区域性规律。主要结论如下:
(1)坡度在解释土壤侵蚀空间分布时,表现为宏观因子。无论是坡度单因子作用还是坡度与其他环境因子的交互作用,其解释力均随分辨率的降低而增大,在低分辨率下(≥ 1 km)达到最优。对比不同环境因子的最优解释力,坡度是影响台地、丘陵类型区土壤侵蚀空间分布的主导因子。而在山地类型区,受景观破碎与地形切割普遍性的影响,主导影响因子则为植被覆盖度。因子间的交互作用增强了相应单因子的解释力,坡度与植被覆盖度的交互对土壤侵蚀空间分布的解释力最强。
(2)降水在不同地貌形态类型区的空间变异性,影响其对产水量空间分布的最优解释力水平。降水单因子作用和降水与其他环境因子(除土地利用类型)间的交互作用,在台地、丘陵类型区,均表现为在高分辨率(≤ 300 m)下的解释力最优,而在山地类型区则表现为在低分辨率(2 km)下的解释力更强。降水是决定产水量空间异质的主导因子。第二主导因子在台地类型区为海拔,在山地、丘陵类型区则为土地利用。降水与土地利用类型的交互作用对产水量空间分布的解释力达95%以上。
(3)本文在多尺度的框架下,借助地理探测器方法,实现了多因子及其交互、多区域及其集成的研究,对于最优解释力的定量辨识以及主导因子精准化分析具有学术贡献。此外,将研究技术框架应用于典型喀斯特流域,有助于推动喀斯特生态系统服务科学的发展。
参考文献
Karst ecosystem and environment: Characteristics, evolution processes, and sustainable development
Spatial variation in drivers of karst rocky desertification based on geographically weighted regression model
DOI:10.18402/resci.2017.10.16
[本文引用: 1]

Analysis and identification of key drivers of karst rocky desertification (KRD)can contribute to effective management and restoration. Ignoring heterogeneity leads to statistical bias and influences the specificity of desertification control planning. Taking Guizhou and Guangxi Karst Mountainous Regions as the study area,this paper chose twelve factors,including socioeconomic,spatial distance,topography,climate,soil,lithology and land use,as drivers of KRD. Geographically Weighted Regression modeling (GWR)and embedding spatial factors to the traditional ordinary linear regression (OLS)model were used to analyze the spatial distribution of influence on KRD. An obvious spatial agglomeration of KRD in the study area according to Moran’s I at the significant level of 99% was found. Coefficients of determination (R2)of GWR were much higher for OLS (0.508 vs. 0.156),indicating a much better fit for the GWR model. Coefficients of GWR between twelve drivers and an obvious spatial distribution of value magnitudes,negative or positive effects and combined types. The specifics of the karst background create a fragile and vulnerable environment that is susceptible to human activities. Meanwhile,intense human activities lead to a sharp change in KRD status,which included the predatory sabotage for casing the severe KRD and the KRD restoration projects for reversing KRD to no KRD. The regression coefficients of the twelve drivers and their linear combined characteristics showed different spatial distributions based on GWR modeling. Using the GWR model revealed the spatial discrimination of the effects of driving forces on KRD and identified key drivers of KRD at the local area,revealing the spatial distribution of the joint effect of different driving forces helping provide a scientific reference to differential KRD control at small watershed scales.
基于地理加权回归的石漠化影响因子分布研究
DOI:10.18402/resci.2017.10.16
[本文引用: 1]
分析和识别石漠化的关键影响因子,有助于有效治理和恢复石漠化。以往研究对影响因子的空间局部差异关注较少,本文以黔桂喀斯特山地为研究区,选取自然及社会经济等12个影响因子,利用地理加权回归(GWR)模型,在普通线性回归的基础上嵌入空间因素,分析石漠化影响因子的空间分异。结果表明:①黔桂喀斯特山地的石漠化Moran’s I大于正态函数在99%显著水平,存在明显空间聚集现象;②GWR模型R<sup>2</sup>(0.508)明显高于传统统计模型的R<sup>2</sup>(0.156),回归模型拟合效果显著提高;③12个影响因子与石漠化关系呈现不同数值大小、正负效应和线性组合关系的空间分布差异;④人类活动叠加在喀斯特特殊的岩性、土壤和植被组合上,显著影响石漠化分布;同时,局部区域高强度人类活动导致石漠化的急剧变化。GWR模型可揭示石漠化影响因子的空间分异规律和局部的关键影响因子,刻画多因子组合作用对石漠化的影响,有助于差别化的小流域石漠化治理。
The comprehensive treatment of karst rocky desertification and its regional restoration effects
喀斯特石漠化综合治理及其区域恢复效应
Quantitative attribution analysis of NPP in karst peak cluster depression based on geographical detector
基于地理探测器的喀斯特植被NPP定量归因
Scale-dependent effects of environmental factors on soil organic carbon, soil nutrients and stoichiometry under two contrasting land-use types
DOI:10.1111/sum.12695 URL [本文引用: 2]
Response of soil erosion to main influencing factors on hillslope of typical watersheds in Guizhou karst area
贵州喀斯特区典型小流域坡面土壤侵蚀与主要影响因子的响应
Research on topographic factors in relation to regional soil erosion in karst region
喀斯特地区区域尺度土壤侵蚀地形因子研究
Quantitative attribution analysis of soil erosion in different morphological types of geomorphology in karst areas: Based on the geographical detector method
DOI:10.11821/dlxb201809005
[本文引用: 2]
The formation mechanism and influencing factors identification of soil erosion are the core and frontier issues of current research. However, studies on the multifactor synthesis are still insufficient. In this study, the simulation of soil erosion and its quantitative attribution analysis have been conducted in different morphological types of geomorphology in a typical karst basin based on the RUSLE model and the geographical detector method. The influencing factors, such as land use type, slope, rainfall, elevation, lithology and vegetation cover, have been taken into consideration. Results show that the strength of association between the six influencing factors and soil erosion was notably different in various morphological types of geomorphology. Land use type and slope were the dominant factors of soil erosion in the Sancha River Basin, especially for land use type whose power of determinant (q value) for soil erosion was much higher than that of other factors. The q value of slope declined with the increase of relief in mountainous areas, namely it was ranked as follows: middle elevation hill > small relief mountain > middle relief mountain. Multi-factor interactions were proven to significantly strengthen soil erosion, particularly for the combination of land use type with slope, which can explain 70% of soil erosion distribution. It can be found that soil erosion in the same land use type with different slopes (such as dry land with a slope of 5°and dry land with slopes above 25°) or in the diverse land use types with the same slopes (such as dry land with a slope of 5° and forest with a slope of 5°), varied greatly. This indicates that prohibiting steep slope cultivation and the Grain for Green Project are reasonable measures to harness soil erosion in karst areas. Based on statistics of soil erosion difference between diverse stratifications of each influencing factor, results of risk detector suggest that the amount of stratification combinations with significant difference accounted for 55% at least in small and middle relief mountains. Therefore, the spatial heterogeneity of soil erosion and its influencing factors in different morphological types of geomorphology should be investigated to control karst soil loss more effectively.
基于地理探测器的喀斯特不同地貌形态类型区土壤侵蚀定量归因
DOI:10.11821/dlxb201809005
[本文引用: 2]
土壤侵蚀形成机制与影响因素识别是当前研究的核心与前沿议题,然而从多因素综合作用的角度进行定量归因仍需加强。以喀斯特典型峰丛洼地流域为研究区,基于GIS手段和RUSLE模型模拟土壤侵蚀,综合土地利用、坡度、降雨、高程、岩性、植被覆盖度等影响因子,应用地理探测器方法针对喀斯特不同地貌形态类型区进行土壤侵蚀的定量归因研究。结果表明,各影响因子对土壤侵蚀的解释力及因子间耦合作用程度在不同地貌形态类型区差异显著,其中土地利用和坡度是决定土壤侵蚀空间异质的主导因子,但在山地丘陵区,随着地形起伏度的升高,坡度的控制作用下降,即地理探测器q值表现为中海拔丘陵>小起伏中山>中起伏中山;生态探测器显示土地利用对土壤侵蚀的影响相比于其他因子有显著差异;双因子交互作用有助于增强对土壤侵蚀的解释力,土地利用与坡度的协同作用对土壤侵蚀的解释力达到70%以上;对于土壤侵蚀空间分布的差异性检验,风险探测器显示在小起伏中山、中起伏中山等地貌形态类型中,具有显著差异的影响因子分层组合数占比至少55%。因而,喀斯特地区土壤侵蚀的治理应综合考虑不同地貌形态类型区土壤侵蚀影响机制的空间异质性。
Scale effects on runoff and soil erosion in rangelands: Observations and estimations with predictors of different availability
DOI:10.1016/j.catena.2016.12.011 URL [本文引用: 2]
Shedding light on relationships between plant diversity and tropical forest ecosystem services across spatial scales and plot sizes
Spatiotemporal dynamics of soil moisture in the karst areas of China based on reanalysis and observations data
Characteristics of soil erosion in Guangxi based on CSLE
基于CSLE模型的广西土壤侵蚀规律
Environmental determinants impacting the spatial heterogeneity of karst ecosystem services in Southwest China
DOI:10.1002/ldr.3815 URL [本文引用: 1]
Projected changes of grassland productivity along the representative concentration pathways during 2010-2050 in China
Scale-specific controls of sediment yield in karst watersheds
Exploring the complex relationships and drivers of ecosystem services across different geomorphological types in the Beijing-Tianjin-Hebei region, China (2000-2018)
Exploring soil erosion trajectories and their divergent responses to driving factors: A model-based contrasting study in highly eroded mountain areas
DOI:10.1007/s11356-020-11703-1 URL [本文引用: 1]
Research progress of karst rocky desertification and soil erosion in southwest China
西南喀斯特石漠化与水土流失研究进展
The spatial trade-offs and differentiation characteristics of ecosystem services in karst peak-cluster depression
喀斯特峰丛洼地生态系统服务空间权衡度及其分异特征
Characteristics of soil erosion and nutrient losses in three land use patterns in the small watershed of southern Dianchi
滇南小流域3种土地利用方式下土壤侵蚀及养分流失特征
Applying Geodetector to disentangle the contributions of natural and anthropogenic factors to NDVI variations in the middle reaches of the Heihe River Basin
Spatio-temporal variations of precipitation and runoff and analyses of water-heat-human-land matching characteristics in typical mountainous areas of China
DOI:10.11821/dlxb201911007
[本文引用: 1]
Mountainous areas in China face complex problems due to conflicts between natural eco-environmental protection and socio-economic development. Mountain water resources have evolved in the context of climate change and human activities, which further affects their coordination and matching with regional climate resources, land resources and socio-economy. Hence, it is of fundamental significance for mountain development to study these issues to identify key weakness and provide solutions. The paper focuses on three typical mountainous areas under different natural geographic conditions and at socio-economic development levels in China, namely, Taihang Mountains Area (TMA), Hengduan Mountains Region (HMR) and Guizhou-Guangxi Karst Area (GKA), and studies the spatio-temporal variations of precipitation and runoff from 1956 to 2015 by Mann-Kendall test based on national water resources assessment results and statistical data of land use and socio-economy. The characteristics of natural and socio-economic factors are analyzed by matching distance and imbalance index. In this process, four groups of parameters are selected, including water (precipitation and runoff), heat (accumulated temperature and radiation), land (total area and farmland area) and socio-economy (population and GDP). The results indicate that, the water resources endowment of TMA is the worst, and significant reduction of runoff since 2000 makes it even worse, while the precipitation and runoff of HMR and GKA are abundant and there is no obvious change trend. According to the analysis of regional water-heat-human-land matching characteristics, TMA mainly suffers from water shortage, land and heat resources have great disadvantages in most parts of HMR with uneven distribution of water and heat, and land resources are relatively deficient in all counties of GKA. In general, mismatching degree of water and other factors is the highest, and the allocation and coordination of water are the key issue for sustainable development of mountainous areas, especially in TMA.
典型山地降水径流时空演变及“水—热—人—地”匹配性分析
DOI:10.11821/dlxb201911007
[本文引用: 1]
山地是中国自然生态保护与经济社会发展问题交织、矛盾突出的区域。山地水资源受气候变化和人类活动综合影响发生演变,进一步影响到其与区域气候资源、土地资源以及经济社会之间的协调匹配,研究这些问题对辨识山地发展关键短板、提供山地问题解决思路具有基础意义。根据自然环境特点和经济社会发展状况,选择太行山、横断山和黔桂喀斯特三大典型山地开展研究,基于全国水资源调查评价成果及土地利用、经济社会数据,采用Mann-Kendall检验等方法分析1956-2015年山地降水和径流时空演变特点;采用匹配距离和不平衡指数对山地的水(降水和径流)、热(积温和辐射)、地(面积和耕地)以及社会经济(人口和GDP)等4类要素匹配性进行综合对比分析。结果表明:三大典型山地中,太行山水资源禀赋最差,且2000年以来径流显著衰减,而横断山和黔桂喀斯特降水、径流丰富,且无明显变化趋势;从“水—热—人—地”对比来看,太行山以缺水问题为主,横断山多数地区土地与热资源偏少且水热空间差异大,黔桂喀斯特整体来说土地资源偏少;综合来看,水与其他要素的匹配性最差,特别是在太行山区,水的时空分布及其均衡匹配是保障山地可持续发展的关键。
Research on the classificaton system of digital land geomorphology of 1:1000000 in China
DOI:10.3724/SP.J.1047.2009.00707 URL [本文引用: 1]
中国陆地1:100万数字地貌分类体系研究
地貌分类体系是地貌图研制的关键之一,本文在总结国内外地貌及分类研究的基础上,借鉴20世纪80年代的中国1∶100万地貌图制图规范,基于遥感影像、数字高程模型和计算机自动制图等技术条件,归纳总结了数字地貌分类过程中应遵循的几大原则,分析了它们之间的相互关系,讨论了数字地貌分类的各种指标:包括形态、成因、物质组成和年龄等,提出了中国陆地1∶100万数字地貌三等六级七层的数值分类方法,扩展了以多边形图斑反映形态成因类型,以点、线、面图斑共同反映形态结构类型的数字地貌数据组织方式,并详细划分了各成因类型的不同层次、不同级别的地貌类型。中国1∶100万数字地貌分类体系的研究,为遥感等多源数据的陆地地貌解析和制图提供了规范,也为《中华人民共和国地貌图集》的编制奠定了基础,同时为全国大、中比例尺地貌图的分类和编制研究提供了借鉴。
A review of the (Revised) Universal Soil Loss Equation ((R)USLE): With a view to increasing its global applicability and improving soil loss estimates
DOI:10.5194/hess-22-6059-2018 URL [本文引用: 1]
Temporal analysis on quantitative attribution of karst soil erosion: A case study of a peak-cluster depression basin in Southwest China
DOI:10.1016/j.catena.2018.08.035 URL [本文引用: 2]
Rainfall erosivity estimation under different rainfall amount
不同类型雨量资料估算降雨侵蚀力
降雨侵蚀力反映气候因素-降雨对土壤侵蚀的潜在作用能力,由于次降雨资料难以获得,一般利用气象站整编降雨资料评估计算降雨侵蚀力的结果进行对比分析,结果表明以日雨量计算多年平均侵蚀力的精度最高,而在4种采用月或年雨量的模型中尽管以逐年月雨量模型表现相对最好,但这4种模型之间差别不明显。同时在降雨量较丰富地区,各类型雨量资料估算侵蚀力的精度也相对较高。
Assessment of soil erosion in karst critical zone based on soil loss tolerance and source-sink theory of positive and negative terrains
DOI:10.11821/dlxb201811007
[本文引用: 1]
Traditional classic soil erosion models are not applicable in karst areas. In this study, the effective rainfall erosion threshold was obtained and the rainfall erosivity was re-estimated, according to the lithologic difference of the karst critical zone. The soil formation rate was calculated and used as the soil loss tolerance, based on the chemical composition variation of carbonate rocks. The spatial distribution information of karst depression was extracted by geomorphologic-hydrologic analysis, and the soil erosion algorithm in the karst critical zone was modified and improved. The results showed that: (1) The traditional algorithm ignored the specificity of the underlying surface of the karst critical zone. The average rainfall erosivity was estimated to be 47.35%, and the average rainfall erosivity in the karst area is only 59.91% of the non-karst area. (2) The soilless or less soil areas could be miscalculated as the high erosion region by using the conventional algorithm. However, the soil loss tolerance by continuous carbonate, carbonate clastic, carbonate and clastic interbeds were about 0.21, 1.2 and 2.89 t ha-1 yr-1, respectively. (3) Sloping lands and croplands in the depressions are generally regarded as the high incidence area of soil erosion, but the depression of the karst should be the sediment area of surface erosion. The spatial distribution of karst depression was basically coincided with that of carbonate rocks. (4) The traditional algorithm overestimated the soil erosion area at about 27.79%, while the soil erosion amount at approximately 47.72%. Generally, the traditional classic model could greatly overestimate the soil erosion amount in the karst area, therefore, an accurate and applicable model should be established. In addition, due to the slow soil formation rate, the thin soil layer and the less total amount of soil in karst area, the soil loss tolerance was far lower than the erosion standard of non-karst area. The classifying and grading standard and risk assessment method of soil erosion applicable to karst area should be set and established.
基于允许流失量和正负地形源汇理论的喀斯特关键带土壤侵蚀研究
DOI:10.11821/dlxb201811007
[本文引用: 1]
喀斯特地区下垫面的特殊复杂性使得地表发生显著坡面径流需要达到更大的降水累积阈值,碳酸盐岩岩石成土速率的缓慢和空间异质性导致喀斯特地区的土壤存量被严重高估和均一化等,因此,传统经典的土壤侵蚀模型在喀斯特地区难以适用。本文依据喀斯特关键带岩性的差异,确定其有效降水侵蚀阈值,并对降雨侵蚀力进行重新测算;根据碳酸盐岩化学成分的差异,计算其成土速率并作为土壤允许流失量;通过地貌—水文分析法提取喀斯特洼地空间分布信息,对喀斯特关键带土壤侵蚀算法进行多次改进和创新。结果显示:① 传统算法忽视了喀斯特关键带下垫面的特殊性,致使其平均降雨侵蚀力被高估47.35%,且喀斯特区域的平均降雨侵蚀力仅相当于非喀斯特区域的59.91%;② 传统算法可能将一些无土或少土可流区计算为土壤的高侵蚀量区,而连续性碳酸盐岩、碳酸盐岩夹碎屑岩、碳酸盐岩与碎屑岩互层的土壤允许流失量仅分别为0.21 t ha<sup>-1</sup> yr<sup>-1</sup>、1.2 t ha<sup>-1</sup> yr<sup>-1</sup>、2.89 t ha<sup>-1</sup> yr<sup>-1</sup>;③ 传统算法通常将有坡度和耕作的洼地视为土壤侵蚀的高发区,但其实际应是地表侵蚀的沉积区,喀斯特洼地在空间上的连续性与碳酸盐岩的分布区基本重合;④ 传统算法高估土壤侵蚀面积27.79%,土壤侵蚀量47.72%。总之,传统经典模型会大大高估喀斯特地区的土壤侵蚀量,因此,应该建立一种精确适用的模型。另外,由于喀斯特地区的成土速率慢而土层薄、总量少,土壤允许流失量远低于非喀斯特区域侵蚀标准,应制定适用于喀斯特地区的土壤侵蚀分类分级标准和风险评价方法。
The EPIC crop growth model
DOI:10.13031/2013.31032 URL [本文引用: 1]
Revised slope length factor for the universal soil loss equation
DOI:10.13031/2013.31192 URL [本文引用: 1]
Extension of a GIS procedure for calculating the RUSLE equation LS factor
DOI:10.1016/j.cageo.2012.09.027 URL [本文引用: 1]
Study of applying USLE and geographical information system IDRISI to predict soil erosion in small watershed
应用USLE模型与地理信息系统IDRISI预测小流域土壤侵蚀量的研究
InVEST 3.7.0 User's Guide
Geodetector: Principle and prospective
DOI:10.11821/dlxb201701010
[本文引用: 2]
Spatial stratified heterogeneity is the spatial expression of natural and socio-economic process, which is an important approach for human to recognize nature since Aristotle. Geodetector is a new statistical method to detect spatial stratified heterogeneity and reveal the driving factors behind it. This method with no linear hypothesis has elegant form and definite physical meaning. Here is the basic idea behind Geodetector: assuming that the study area is divided into several subareas. The study area is characterized by spatial stratified heterogeneity if the sum of the variance of subareas is less than the regional total variance; and if the spatial distribution of the two variables tends to be consistent, there is statistical correlation between them. Q-statistic in Geodetector has already been applied in many fields of natural and social sciences which can be used to measure spatial stratified heterogeneity, detect explanatory factors and analyze the interactive relationship between variables. In this paper, the authors will illustrate the principle of Geodetector and summarize the characteristics and applications in order to facilitate the using of Geodetector and help readers to recognize, mine and utilize spatial stratified heterogeneity.
地理探测器: 原理与展望
DOI:10.11821/dlxb201701010
[本文引用: 2]
空间分异是自然和社会经济过程的空间表现,也是自亚里士多德以来人类认识自然的重要途径。地理探测器是探测空间分异性,以及揭示其背后驱动因子的一种新的统计学方法,此方法无线性假设,具有优雅的形式和明确的物理含义。基本思想是:假设研究区分为若干子区域,如果子区域的方差之和小于区域总方差,则存在空间分异性;如果两变量的空间分布趋于一致,则两者存在统计关联性。地理探测器q统计量,可用以度量空间分异性、探测解释因子、分析变量之间交互关系,已经在自然和社会科学多领域应用。本文阐述地理探测器的原理,并对其特点及应用进行了归纳总结,以利于读者方便灵活地使用地理探测器来认识、挖掘和利用空间分异性。
Soil erosion evolution and spatial correlation analysis in a typical karst geomorphology using RUSLE with GIS
DOI:10.5194/se-8-721-2017 URL [本文引用: 1]
Distinguishing the impacts of land use and climate change on ecosystem services in a karst landscape in China
Projected land use changes impacts on water yields in the karst mountain areas of China
Change pathway and intersection of rainfall, soil, and land use influencing water-related soil erosion
Analysis on the relationship between soil erosion and land use in Wujiang river basin in Guizhou province
贵州省乌江流域土地利用与土壤侵蚀关系研究
Runoff features and the influencing factors on karst sloping farmland
喀斯特坡耕地产流特征及影响因素
Features of soil and water loss and key issues in demonstration areas for combating karst rocky desertification
DOI:10.11821/xb201207002
[本文引用: 1]
Very little information on water and soil loss in karst areas is available. Moreover, traditional methods of assessing soil loss are difficult to apply to this area. In this paper the authors analyze the features of water and soil loss based on location monitoring during the five years (2006-2010), in demonstration areas for combating karst rocky desertification (KRD). The following conclusions are obtained. (1) Soil erosion showed a decreasing trend after a series of comprehensive treatments in the three study regions, and erosion was macroscopically mitigated in terms of landform types. (2) The slope cropland is distributed extensively in Yachi mountain region and erosion is thus serious. With better natural conditions and ecological economy development, erosion in Hongfenghu basin is relatively weak. Due to the severely poor soil cover, the amount of soil erosion is extremely low in Huajiang gorge. (3) Ecologic rehabilitation is the key to combat KRD. Closing hillsides to facilitate afforestation and water conservation are effective measures for the mitigation of soil and water loss. Grassland and economic forests bring both economic and ecological benefits. (4) KRD degrees differ greatly in slope gradient and soil layer. Further classification for soil erosion in karst areas should be proposed based on KRD degrees. (5) Hazard evaluation of subterranean soil loss is one of the tough tasks at present. However, control of key parts such as sinkholes is the efficient way to prevent subterranean loss.
典型喀斯特石漠化治理区水土流失特征与关键问题
Land-use zoning management to protecting the regional key ecosystem services: A case study in the city belt along the Chaobai River, China
Some scaling issues of geography
DOI:10.11821/yj2005010002
[本文引用: 1]
The pattern, process and their relationships are fundamental issues in geography. Patterns and processes in nature, such as ecosystem distribution, regional climatic changes, land use and land cover, and rainfall or runoff series, display complex behavior and often intertwine with scale problems. Many scale-dependent phenomena have been exemplified in scientific researches, and scale issues are found at the center of methodological discussions in both physical and human geography. However, some existed research works failed to make a distinction among the concepts of scale and scaling, to employ consistent scaling paradigm, and to adopt an objective criterion for assessing the scaling effects in geography. This paper attempts to calibrate those deviations and to present new branch subject of geography-Scaling Methodology of Geography. After introducing scaling approaches, upscaling and downscaling, in geography, we place a focus on the research objects, categories and contents of proposed subjects, and three basic principles, scientific principle, economic principle and operational principle, are proposed in scaling works. Finally, ten key issues are presented for establishing the scaling methodology of geography. The key questions are as follows: (1) how does spatial heterogeneity scale in scaling ? (2) how do ratio variables change with scale in scaling? (3) how do dominating processes change with scale in scaling? (4) how does property of processes change with scale in scaling? (5) how does sensitivity change with scale in scaling? (6) how does predictability change with scale in scaling? (7) what is sufficiency for simple aggregation and disaggregation in scaling? (8) how do disturbance factors change with scale in scaling? (9) can scaling transcend several scales and scale fields? (10) is noise factor changeable with scale in scaling?
地理尺度转换若干问题的初步探讨
Scale issues in digital terrain analysis and terrain modeling
DOI:10.11821/yj2007030002
[本文引用: 1]
Digital elevation model (DEM) and terrain analysis based on DEM is scale-dependant. With the view of geoscience analysis and modeling, the paper mainly discusses scale and scale effect of terrain analysis based on grid DEM. Firstly, the paper outlines five common uses of the term "scale" within DEM and terrain analysis which are geographical scale, sampling scale, DEM structure scale, analysis scale and cartographic scale. The geographical scale means the spatial extent of the DEM or the area of coverage; the sampling scale refers to sampling intervals in DEM data collection; the DEM structure scale refers to the resolution of DEM which includes DEM horizontal resolution and vertical resolution; the analysis scale refers to the analysis extent of local windows including window size and threshold value; and the cartographic scale which is used for map reflects the ration between the measurements on a map and the actual measurement on the ground. Secondly, the paper's focus is put on the scale effect of terrain analysis based on DEM. In this section, the uncertainty of DEM and terrain analysis caused by the above scales is classified into single scale effect, cross scale effect and boundary effect. One area of terrain analysis that has been largely ignored is the effect of variability of terrain within the bounds of single grid cell that is referred to the heterogeneity effect of DEM grid size in the paper.We pointed out those and discussed the effect on terrain analysis. At the end of this section, the scale threshold which can be used to indicate the effective extend of terrain attributes is discussed. It is known that the existing DEM with fixed resolution does not always meet the requirement of application. This means that one can deduct more scale terrain models from a fixed resolution DEM. In fact, scaling model can realize the terrain information allocation and aggregation in terrain analysis based on DEM. In this paper, three scaling models including scale deduce model, scale inversion model and multi-scale terrain analysis model are discussed.
论DEM地形分析中的尺度问题
Scale effect and spatially explicit drivers of interactions between ecosystem services: A case study from the Loess Plateau
Multiscale spatiotemporal characteristics of landscape patterns, hotspots, and influencing factors for soil erosion
Integrating ecosystem services supply and demand into optimized management at different scales: A case study in Hulunbuir, China
Scale effect on spatial patterns of ecosystem services and associations among them in semi-arid area: A case study in Ningxia Hui Autonomous Region, China
DOI:10.1016/j.scitotenv.2017.04.009 URL [本文引用: 1]
Mapping the spatiotemporal heterogeneity of ecosystem service relationships and bundles in Ningxia, China
