

1 引言
植被是区域环境重要组成部分,在生物圈碳循环和能量平衡以及在保持全球生态系统稳定中发挥着不可替代的作用[1-2]。目前,大部分自然植被分布在全球主要山地。横断山区位于中国西南边陲,地处亚热带与青藏高寒区过渡地带,属于典型的纵向岭谷区,季风环流在此强烈受到因地形引起的“通道—阻隔”作用[3],多种地理要素在此交汇。受其影响,植物区系成分复杂,植被分布格局独特,过渡性质明显。以其北部地区为例,这里是横断山脉植物区系地区向华中植物区系地区的重要过渡地带,与华北植物区系地区的黄土高原亚地区毗邻[4],是现代植被形成的基础。横断山区不仅是长江上游的重要生态屏障,而且是世界上物种最为丰富的地区之一[5],其植被变化对维系区域生态安全和可持续发展起着十分重要的作用。前人对于横断山区的生态地理过程[3]、气候变化[6-7]、生长季长度[8]、地质灾害[9-10]等方面作过较为深入的研究。
但是,以往研究对横断山区全域性、长时段植被变化、不同类型的覆被特征及其动态等方面分析还相对薄弱。仅少数工作利用植被遥感的归一化植被指数(Normal Difference Vegetation Index, NDVI)揭示了该区植被活动的增强趋势[11]、植被净初级生产力(Net Primary Productivity, NPP)的波动增加情况[12⇓⇓-15]及气候的干暖化趋势[6-7]。1998年以来国家植被保护政策发生根本变化,较大影响到该区域的植被覆被。比如,国家和地方政府先后在研究区实施了3期长江流域防护林体系建设工程、两期天然林资源保护工程和两期退耕还林还草工程,对植被保护和恢复起到关键作用[16]。值得注意的是,横断山区地质条件复杂,降雨充沛,地质灾害频发且分布广泛,崩塌、滑坡和泥石流等灾害均有发育[9-10],严重影响到区域植被,亟待开展相应研究。
目前,研究区缺乏系统植被调查,对区域植被变化的系统研究较少。同时,为数不多的研究主要采用中分辨率成像光谱仪(Moderate-resolution Imaging Spectroradiometer, MODIS)数据及其衍生产品完成。但对其他遥感资料,如深高分辨率辐射计(Advanced Very-High-Resolution Radiometer, AVHRR)、SPOT、哨兵(Sentinel)等多种不同时空分辨率遥感资料及其产品的利用还很不充分。因此,进行横断山区植被变化及归因研究,在未来的区域生态环境质量监测和评估、进行植被增汇和实现“双碳”目标、生物多样性与生态系统评估系统指标体系建立、甚至在世界自然遗产申报潜力评估[22]等理论研究和应用实践上都具有重要意义。本文针对目前区域植被变化研究的不足,采用多种资料互相印证开展研究,试图在植被覆被与植被活动变化及其归因方面取得初步结论,为区域生态环境保护、自然灾害综合风险评估和未来气候变化影响下的植被变化预测提供参考。
2 研究方法与数据来源
2.1 研究区概况
本文所指横断山区边界及范围主要是基于区域地质基础和地貌特征而确定①(①根据中国科学院战略性先导科技专项“美丽中国生态文明建设科技工程”“气候变化条件下山地致灾风险绿色调控关键技术与示范”项目组最新划分结果。),包括中国西藏东南部、四川西部、云南北部与青海、甘肃的部分地区以及高黎贡山西坡的一部分,地处96.07°E~105.17°E、24.44°N~34.17°N之间,总面积约43万km2(图1)。研究区海拔在291~7556 m之间,地势西北高,东南低,横跨中国西南一、二、三级地形阶梯,是中国西南地区一系列南北向平行山脉的总称。横断山区高山峡谷纵列分布,山岭自西而东包括伯舒拉岭、高黎贡山、怒山、宁静山、云岭、沙鲁里山、大雪山、邛崃山等,其间分布着怒江、澜沧江、金沙江、雅砻江、大渡河、岷江等众多水系。横断山区气候主要受西风环流、西南季风、东南季风和高原季风等多种季风及地形的多重影响[18],由东南的亚热带湿润性季风气候向西北的高寒气候过渡[23]。1961—2011年横断山区年均气温为13.0 ℃,年均降水量为982.3 mm[7],降水量总体上从西北向东南、从金沙江河谷向东西两侧增加[6]。植被垂直结构表现为从低海拔向高海拔依次出现“亚热带常绿阔叶林与干旱草(灌)丛—暖温性针叶林—寒温性暗针叶林—高寒灌丛与草甸—冰雪带”等类型[24],而分布面积较大的植被类型主要有常绿针叶林、灌丛—草地镶嵌类型(简称灌草镶嵌类)[17]。同时,纵向岭谷使山地垂直带谱具有明显的坡向效应,迎风坡与背风坡分别表现为湿润和干旱的类型和带谱结构[3,19]。
图1
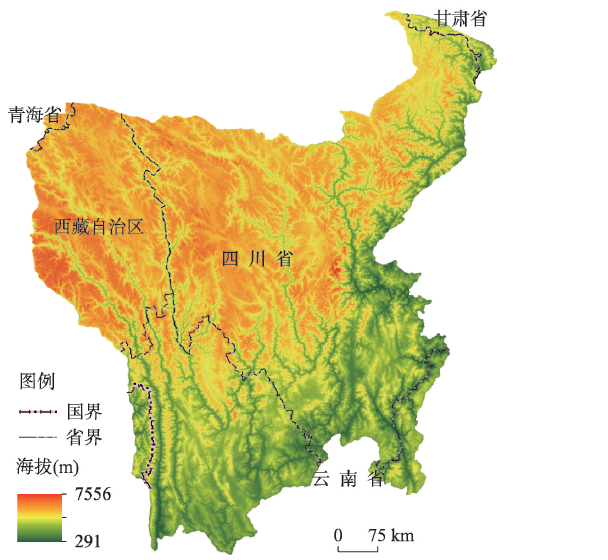
图1
横断山区范围与地形
Fig. 1
Geographical range and topography of the Hengduan Mountains
2.2 数据来源
植被分类数据包括成图于20世纪80—90年代的1:100万植被分类图[20]和欧洲航天局(European Space Agency, ESA)“气候变化倡议”项目发布的土地覆被数据集(Climate Change Initiative Land Cover, CCI-LC)(
图2
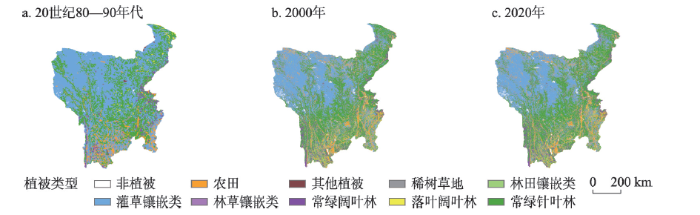
图2
横断山区植被类型分布
注:图a为20世纪80—90年代的植被类型图,图b、图c为CCI-LC土地覆被数据,以上均已进行重分类。
Fig. 2
Geographical distribution of vegetation types in the Hengduan Mountains
本文所采用的NDVI数据为美国国家航空航天局(National Aeronautics and Space Administration, NASA)生产的MOD13A1数据(
本文所采用的环境数据还包括地形和气候数据。前者主要指30 m分辨率的STRM(Shuttle Radar Topography Mission)数据(
2.3 研究方法
2.3.1 不同植被类型转换分析方法
为了解植被类型在不同时段覆被面积的变化关系,本文采用转移矩阵对其进行了分析。转换矩阵可用于分析植被类型的转化情况,从而揭示植被类型变化的方向[34]。其公式为:
式中:
2.3.2 植被活动变化趋势
式中:
Mann-Kendall检验是一种评估趋势显著性的非参数检验方法,它不需样本服从一定的分布,也不受少数异常值的干扰[37],选择0.05显著性水平进行统计分析。
2.3.3 植被活动与气候变化相关性分析
采用偏相关分析与t检验法计算气温和降水分别对植被活动的影响。偏相关分析是在控制
t检验法主要用于样本量较小且总体标准差未知的正态分布[39]。计算公式为:
式中:
3 结果分析
3.1 横断山区植被类型分布与变化
3.1.1 横断山区植被分布
采用遥感解译的CCI-LC土地覆被数据(图2b、2c)分析植被分布状况。将20世纪80—90年代基于植被调查的植被类型数据(图2a)按照CCI-LC分类系统对植被分级进行合理归并,将植被型组一级的阔叶林区分为植被型一级的常绿阔叶林和落叶阔叶林,将草甸、草丛与灌丛合并为灌草镶嵌类等。结果显示,两类数据各植被类型的空间分布基本一致。2020年常绿针叶林与灌草镶嵌类是横断山区分布最广泛的植被类型,两者分别占区域总面积的37.28%、34.46%。常绿针叶林主要分布在海拔4000 m以下区域,灌草镶嵌类主要分布在研究区西北部和东南部的海拔4000 m以上的区域。林草镶嵌类和稀树草地主要分布在上述两者之间,分别占总面积的4.08%、3.21%,且稀树草地主要集中于川滇交界的干热河谷。农田和林田镶嵌类主要分布在南部河谷地区与北部高原的部分区域,分别占总面积的7.45%、6.21%;常绿阔叶林和落叶阔叶林分别占总面积的4.78%、1.28%,主要分布在西南部、东南部以及东北部四川盆地边缘;其他植被面积相对较少,占总面积的0.23%,主要包括沼泽、稀疏植被;非植被面积占1.02%,主要为冰川、水体、城市、裸地等。
3.1.2 横断山区植被转换时空特征
(1)植被变化阶段性特征。1992—2020年研究区发生转换的植被面积为24871.31 km2(图3a),但发生两次及以上转换的区域占比小于0.01%。植被的转出以灌草镶嵌类(35.05%)和林田镶嵌类(27.49%)为主,另外常绿针叶林(12.00%)也占有较大的面积,这说明该区域存在植被退化现象;其次为稀树草地(7.98%)、林草镶嵌类(4.85%)、农田(4.84%)、其他植被(4.55%),常绿阔叶林(2.31%)、落叶阔叶林(0.72%)、非植被(0.20%)转出最少。植被转入以常绿针叶林为主(52.32%),其次为农田(11.00%)、林草镶嵌类(8.07%)、灌草镶嵌类(7.48%)、林田镶嵌类(6.61%)、常绿阔叶林(6.33%),转为稀树草地(3.42%)、非植被(2.20%)、落叶阔叶林(1.72%)、其他植被(0.85%)最少。
图3
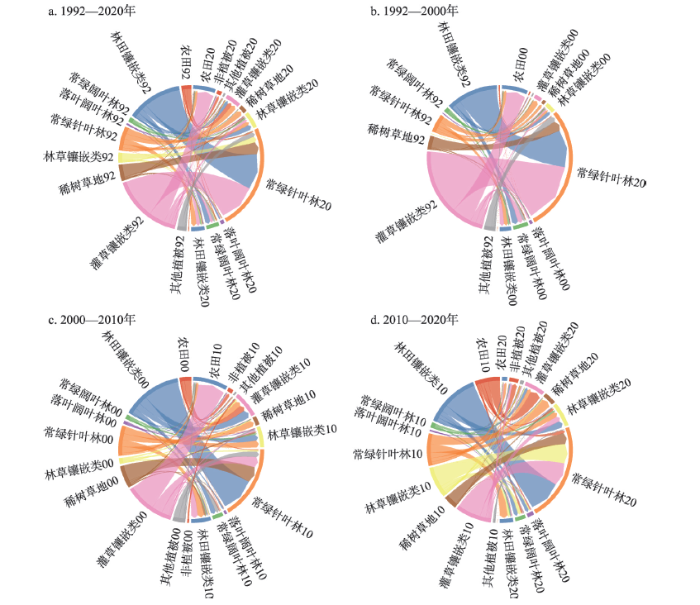
图3
1992—2020年横断山区不同植被类型转换变化
注:图中标签最后的两位数字代表年份,每幅弦图左侧为较早年份转出植被类型,右侧为较迟年份转入植被类型。图a~d转换面积分别为24871.31 km2、11781.08 km2、6739.94 km2、7114.17 km2。
Fig. 3
Transformation changes of vegetation types in the Hengduan Mountains from 1992 to 2020
1992—2000年研究区发生植被转换面积为11781.08 km2(图3b)。其中超60%的比例转向常绿针叶林,其次转入为农田。灌草镶嵌类转出比例最大,受植树造林和气候变暖影响,其中66.25%转为常绿针叶林,20.66%转为农田;林田镶嵌类转出比例次之,78.23%转为常绿针叶林,11.93%转为常绿阔叶林;常绿针叶林、常绿阔叶林转出主要以植被退化为主且整个研究时段内始终存在,可能与地质灾害有关;稀树草地主要转向常绿针叶林;其余植被类型转换比例不大。
2000—2010年研究区植被转换面积减小为6739.94 km2(图3c),这也是转换面积最小的一个时期。在该阶段转为常绿针叶林的比例减小而其余植被类型转入比例增加,植被互转明显。林田镶嵌类转出比例增大成为该阶段转出面积最大的植被类型,除61.80%转向常绿针叶林外,也分别有14.88%、8.29%转向灌草镶嵌类和常绿阔叶林;灌草镶嵌类转出比例减小,仍主要转向常绿针叶林和农田,但转向常绿针叶林的比例减小为57.00%,农田的比例增大为22.01%;农田在该阶段的转出比例增大为5.67%,但仍为净转入植被,主要转向灌草镶嵌类与非植被,这或与城市化建设与退耕还草有关;其余植被类型的转换情况变化不大。
2010—2020年研究区植被转换面积有所增加,为7114.17 km2(图3d)。除转入农田比例大幅减小而转入常绿针叶林比例增加外,其余植被类型转入比例与上阶段大致相同。林田镶嵌类仍为转出比例最大的植被类型,转入植被类型与比例变化较小;灌草镶嵌类在此阶段仍为转出比例第二大植被类型,其中67.99%转向常绿针叶林,而转入农田比例很小,仅为3.33%;林草镶嵌类转出比例增大,其中69.13%转向常绿针叶林,11.68%转向常绿阔叶林;农田在该阶段转出比例继续增大,达到12.33%,成为净转出植被,仍主要转向灌草镶嵌类与非植被。
总体而言,灌草镶嵌类转出面积与比例逐渐减少,林田镶嵌类转出比例变化不大,林草镶嵌类和农田转出比例逐渐增大,农田在1992—2010年呈净增长趋势而在2010—2020年成为净转出植被,常绿针叶林在各时段均有相当面积的转出,主要以植被退化为主。在各时段均主要转入为常绿针叶林,其中2000—2010年转入常绿针叶林所占比例最小而转入草地所占比例较大,这或与地质灾害有关,非植被所占比例逐渐增大,城市化进程加快。
(2)主要植被类型间转换关系及其分布。1992—2020年横断山区的主要植被转变情形如图4所示。从空间分布来看,河谷地区以灌草镶嵌类(5113.03 km2)转为常绿针叶林为主,其南部较低海拔区域以林田镶嵌类(4737.66 km2)、稀树草地(1591.19 km2)、林草镶嵌类(763.55 km2)转为常绿针叶林为主;灌草镶嵌类转为农田主要分布在北部高原和南部干热河谷的部分区域,共计2130.86 km2;常绿针叶林转为稀树草地、灌草镶嵌类的区域主要分布在龙门山脉、雅砻江与鲜水河交汇处东部以及云贵高原与青藏高原交接的干热河谷地带,转换面积分别为727.75 km2、692.98 km2。另外,横断山区南部有667.72 km2林田镶嵌类转为常绿阔叶林,也有一定面积农田转为非植被区域,后者主要是城市化的扩张。总体而言,植被发生变化的区域均集中于河谷附近和南部的小盆地区域,特别是龙门山脉植被变化剧烈。
图4
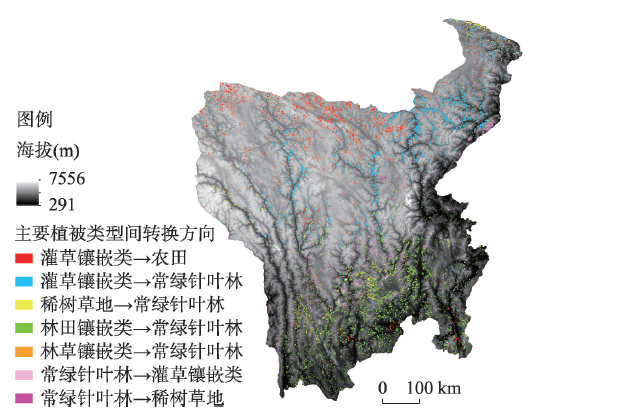
图4
横断山区主要植被类型间转换关系及其分布
Fig. 4
Geographical map of transformation among vegetation types in the Hengduan Mountains
3.1.3 横断山区不同类型植被的分布面积与平均海拔变化
为细致了解横断山区各植被类型年际变化情况,本文还逐年统计了各植被类型分布面积及其分布的平均海拔高度逐年变化情况(图5)。结果表明,各植被类型在1995年之前面积变动不大,2010年左右也有一个相对平稳期。其中,常绿针叶林在1994—2005年迅速增长,之后经历了10 a左右的相对平稳期,从2016年开始面积继续增长;林田镶嵌类、灌草镶嵌类则呈现与常绿针叶林相反的趋势;常绿阔叶林、落叶阔叶林面积变化不大;农田与林草镶嵌类则呈现先增长后下降的趋势;稀树草地、其他植被在经历1994—2004年的下降后趋于稳定,但还有些许变动;非植被面积增速呈现越来越快的趋势。总体而言,横断山区植被覆被逐渐向好,草地、人工植被多向森林转换,农田、非植被面积略微增加,城市化进程加快。
图5
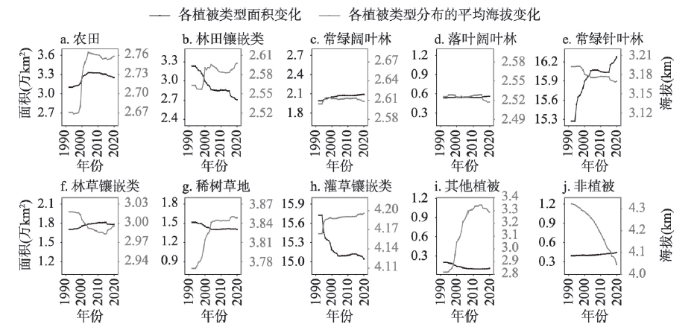
图5
1992—2020年横断山区植被类型面积与分布平均海拔变化
Fig. 5
Relationship between vegetation area and average elevation in the Hengduan Mountains from 1992 to 2020
除农田外,其他植被类型分布的平均海拔与面积呈现相反的变化趋势。由于植被从草地向森林的转换主要发生在低海拔地区,这导致森林分布的平均海拔随面积的增加而降低,草地分布的平均海拔随面积的减少而升高。2000年后农田分布的平均海拔的显著升高是由横断山区北部高原区域耕地的开垦导致。
3.2 横断山区植被活动变化
3.2.1 横断山区植被活动变化趋势
区域植被活动变化主要表现为各种植被类型平均NDVI的波动(表1)。据2000—2020年MOD13A1数据分析该时段植被活动的变化趋势可知,研究区植被活动(生长季均值或峰值)整体上呈显著增强趋势。其中,全区生长季平均NDVI值增速达到0.020/10a,年最大NDVI值平均增速较小,为0.014/10a。植被生长季平均NDVI呈增长趋势的区域占植被类型未变化总面积的80.94%(图6),主要分布于研究区高山地区、怒江和澜沧江除上游河谷区域、雅砻江河谷以及东部的岷江流域;呈下降趋势的区域仅占19.06%,集中分布于研究区西部的怒江与澜沧江上游、南部的金沙江、东部大渡河以及龙门山脉。年最大植被NDVI变化趋势和生长季平均NDVI变化趋势大致相同,但总体来看空间分异明显,其显著增长的区域集中于南部较低海拔区域。总之,2000—2020年无论是生长季平均NDVI还是年最大NDVI均呈现上升趋势,显著上升区占比在23.27%~28.49%之间。
表1 横断山区各植被类型年均NDVI增长趋势及显著性
Tab. 1
| 生长季平均NDVI | 生长季平均NDVI增速 | R2 | 增长趋势在该类型的占比(%) | 显著增长趋势在该类型的占比(%) | |
|---|---|---|---|---|---|
| 农田 | 0.479 | 0.016/10a** | 0.32 | 72.36 | 30.85 |
| 林田镶嵌类 | 0.483 | 0.019/10a** | 0.32 | 76.20 | 28.27 |
| 常绿阔叶林 | 0.633 | 0.024/10a** | 0.43 | 90.30 | 40.75 |
| 落叶阔叶林 | 0.558 | 0.012/10a | 0.08 | 68.69 | 19.68 |
| 常绿针叶林 | 0.582 | 0.021/10a** | 0.45 | 87.40 | 40.26 |
| 林草镶嵌类 | 0.544 | 0.015/10a** | 0.15 | 76.68 | 18.65 |
| 稀树草地 | 0.493 | 0.011/10a | 0.09 | 74.23 | 12.77 |
| 灌草镶嵌类 | 0.426 | 0.012/10a* | 0.24 | 76.69 | 16.18 |
| 其他植被 | 0.405 | 0.005/10a | 0.03 | 74.65 | 15.76 |
注:**表示在P < 0.01下显著,*表示在P < 0.05下显著。
图6
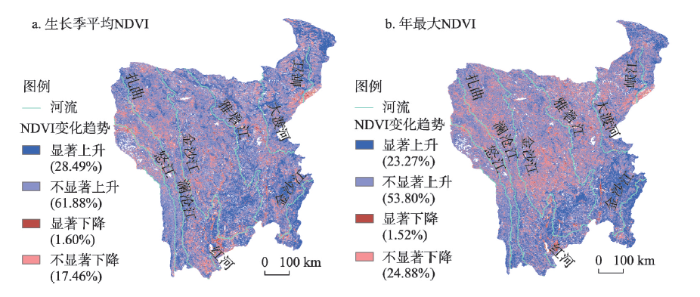
图6
横断山区植被活动空间变化趋势
Fig. 6
Spatial variation trend of vegetation activity in the Hengduan Mountains
就植被类型来说,横断山区森林生长季平均NDVI值、增长速度以及呈增长趋势所占该类型面积比例较草地高,人工植被则在两者之间(表1)。常绿阔叶林、常绿针叶林两种植被类型表现得最为明显且具有较高的置信度和R2;落叶阔叶林生长季平均NDVI增长趋势所占面积比例最小且增速较慢,这与其生长季的延长有一定关系。
3.2.2 植被活动的影响因素
(1)气候影响。在全球变暖的背景下,2000—2020年横断山区年平均气温以0.04 ℃/a呈显著上升趋势(P < 0.01),而年降水量则以-0.55 mm/a呈不显著下降趋势(P > 0.1)。在剔除各类变化植被的像元后,分析保留部分的生长季植被活动与气候要素的偏相关关系,结果表明研究区73.98%面积内的气温与NDVI呈正相关,显著正相关(P < 0.05)区域面积占全区总面积的16.22%,这说明温度的升高对于横断山区大部分区域植被活动有积极作用。但干热河谷温度升高对植被活动有消极影响。升温对森林植被活动的积极影响最强,而对人工植被的消极影响更强(图7a)。
图7
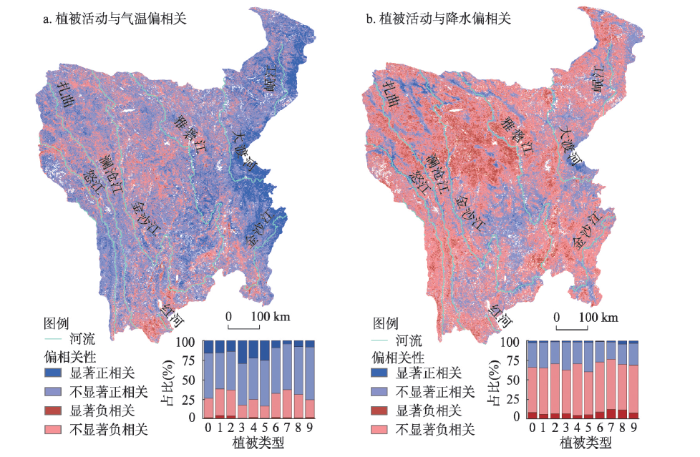
图7
横断山区植被活动与气候要素的偏相关空间特征
注:右下角堆积柱状图横坐标植被类型0代表整个区域所有植被,1~9分别为农田、林田镶嵌类、常绿阔叶林、落叶阔叶林、常绿针叶林、林草镶嵌类、稀树草地、灌草镶嵌类和其他植被。
Fig. 7
Spatial distribution of partial correlations between vegetation activities and climate factors in the Hengduan Mountains
在特定海拔高度和特定地区,植被活动与降水的偏相关关系主要以正相关为主且存在聚集性,二者呈正相关的像元占整个区域的33.89%,其中显著相关(P < 0.05)像元占比6.61%。与其他类型相比,草地对降水变化更加敏感,植被活动与降水的正相关关系也更强。例如,在横断山区中南和东南部2000 m海拔高度以下的金沙江及附近干热河谷区域,降水减少对常绿针叶林和草地两种类型植被的限制作用更加显著。在二郎山东部1200~2000 m海拔高度区域,降水增加对常绿针叶林、常绿阔叶林和草地的植被活动有十分显著的积极作用。对北部的怒江、澜沧江、金沙江、雅砻江等流域2000~3200 m海拔高度的干热河谷区域而言,草地植被活动对降水的响应极为敏感。在同一区域3200~3800 m海拔高度范围内,降水对作物生长的促进作用也较为明显(图7b)。而在东南部中山丘陵区域,因降水相对丰沛,草地物种组成与上述区域相比亦有不同,降水减少对植被活动的限制条件不明显。
(2)地形影响。由于横断山区高山峡谷纵列,高差极大,植被分布特征明显,其险峻的地形和丰沛的降水也造成了该区地质灾害频发。因此,研究区域植被活动减弱趋势与地形因子的关系也很密切(图8)。分析表明,海拔2000 m以下区域植被活动减弱最为明显,其中1000m以下区域植被活动减弱面积占该区间总植被面积的32.65%。就坡度影响而言,植被活动呈减弱趋势的面积随坡度的升高先增加后减少。其中,0°~4°、> 36°坡度范围植被活动减弱趋势最为显著。从坡向方面看,植被活动呈减弱趋势以东坡最为明显,南坡和平地次之。总体而言,低海拔区、坡度> 36°的偏东偏南坡和坡度为0°~4°的平坦区的植被活动减弱趋势最为显著。
图8
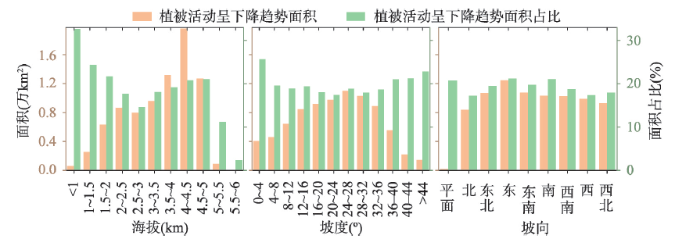
图8
植被活动趋势与地形关系
Fig. 8
The relationship between vegetation activities and topographical conditions of the Hengduan Mountains
4 结论与讨论
4.1 讨论
4.1.1 不同植被类型分布及其转换得到多种地面资料支持
常绿针叶林是横断山区最主要的植被类型,这与以往植被调查结果相一致。例如,刘伦辉等[17]基于植被调查指出横断山区金沙江附近山地暗针叶林为地区代表性植被;吴学靖等[43]在有关哈巴雪山的研究中指出,长苞冷杉林为区内分布面积最大的植被类型,其次为云南松林,其面积分别占整个保护区面积的19.9%和16.1%;据朱华[44]所述,滇中高原的地带性代表植被为半湿润常绿阔叶林,但大部分由于破坏已被云南松林替换;云南松林为云南高原上现存面积最大的森林类型[45]。植被发生变化的区域集中在河谷地区和南部较低海拔地区,这与张雪梅等[46]的研究相同。其中,植被的转出主要以草地和人工植被为主,转入主要以常绿针叶林为主,印证了近年来中国西南地区农田、草地丧失较多的事实[47]。这是由于森林一经砍伐或火烧之后,树种具有很强的萌生力和根孽习性,不久形成不同高度的萌生灌丛,在不断砍樵利用下,则会停留在灌丛状态[48],而中国实施的封山育林育草、植树造林、退耕还林等措施促进横断山区植被恢复[49-50],该区域生态环境在近30年持续向好。此外,横断山区耕地的减少与非植被面积的增加密切相关,与快速城市化进程相关。城市化占用耕地,威胁粮食安全的问题值得进一步重视[51]。同时,中国严格的耕地保护和就近补偿政策迫使开垦新的耕地,这会对横断山区生态环境造成一定的破坏。
4.1.2 植被活动趋势与其他类似研究具有较好可比性
横断山区生长季平均NDVI以0.020/10a的速度呈显著的增长趋势,这与基于遥感数据的同类研究趋势接近。如胡实等[11]发现2000—2016年横断山区98县区植被活动年均增长率为0.004/10a,熊巧利等[52]得出2000—2016年西南地区植被活动以0.009/10a增强,张亮等[53]研究发现2000年后长江流域植被活动增速为0.016/10a。有研究指出研究区所在的西南地区是中国植被活动最强的区域之一[47]。草地的植被活动增速低于森林,主要原因是由于草地大多生长于高海拔地区,自然环境较森林恶劣[54],故在该区域森林植被活动增长较快。另外,胡实等认为高海拔区域植被活动的增强是由于草地面积增加的影响[11],但本文结果表明草地面积减少,但其植被活动在增强,其原因主要是自然环境条件向好发展和封山育林育草政策影响。
4.1.3 植被活动变化与非气候因素的关系
横断山区仍有超20%的区域植被活动呈下降趋势,主要分布于未发生植被变化的河谷区域与龙门山脉、贡嘎山附近区域。有研究表明,大渡河流域森林植被破坏严重[55],河谷坡度较大,植被稳定性差[56],降水丰富使得河谷及其附近区域成为泥石流等地质灾害多发的区域[9-10],而龙门山脉、贡嘎山附近可能是由于汶川、绵竹和康定地震的原因。本文对人类活动影响的定量分析尚有进一步深化的余地。横断山区地形和气候条件复杂,人类活动与气候要素对植被活动交织影响。由于本文在分析植被活动变化中已去除植被类型变化影响,人类活动影响难以体现。但客观上看,近年来中国实施的植树造林和加强封山育林等生态管理措施对增加区域植被分布、提升植被活动均有积极影响[21]。其中,上文所述的长江流域防护林体系建设工程等生态工程[16]均将横断山作为主要示范区域。后续研究需注意加强人类活动对植被变化影响的定量分析。
4.2 结论
针对近年横断山区全域性和长时段植被覆被变化及其与海拔关系研究相对薄弱问题,本文主要利用综合性遥感影像资料较系统研究了横断山区不同类型植被分布和转换状况、植被活动变化及其对气候的响应等问题,主要结论如下:
(1)横断山区植被主要以常绿针叶林和灌草镶嵌类为主,1992—2020年灌草镶嵌类面积减小而常绿针叶林面积增加,植被类型发生变化的区域均集中于河谷附近和南部的小盆地区域,尤以1992—2000年变化最为明显,这说明该时段中国先后实施植树造林、退耕还林、封山育林等生态工程已经取得显著成效。因此,森林面积逐年增加而其分布的平均海拔逐年降低,草地分布变化却与之相反。与此同时,在横断山区北部高原区域较强烈的耕地开垦,使2000年后农田分布的平均海拔显著升高。
(2)2000—2020年横断山区各类植被生长季的植被活动均呈现增强趋势,其幅度由高到低分别为常绿阔叶林>常绿针叶林>林田镶嵌类>农田>林草镶嵌类>落叶阔叶林>灌草镶嵌类>稀树草地>其他植被。在植被类型未变化区域中,植被活动增强面积超过3/4,其中显著增强区域面积超过1/5(P < 0.05)。各类植被呈显著增长趋势占该类型的面积比例由高到低分别为常绿阔叶林>常绿针叶林>农田>林田镶嵌类>落叶阔叶林>林草镶嵌类>灌草镶嵌类>其他植被>稀树草地。
(3)横断山区73.98%区域的植被活动与气温呈正相关关系,在森林植被的表现更显著。而横断山区西北部、中南部的干热河谷等区域植被活动与降水有显著的正相关关系。
本文结论有助于更深入了解近30年横断山区植被分布与植被活动的时空特征,可为区域环境变化研究、植被和生态系统管理提供科学依据和参考。
参考文献
Changes in satellite-derived vegetation growth trend in temperate and boreal Eurasia from 1982 to 2006
DOI:10.1111/j.1365-2486.2011.02419.x URL [本文引用: 1]
Trend analysis of vegetation dynamics in Qinghai-Tibet Plateau using Hurst Exponent
DOI:10.1016/j.ecolind.2011.08.011 URL [本文引用: 1]
Barrier-corridor effect of longitudinal range-gorge terrain on monsoons in Southwest China
DOI:10.11821/yj2012010001
[本文引用: 3]

Topographic pattern has important impacts on atmospheric circulation and regional climate.The special terrain of Longitudinal Range-Gorge Region(LRGR) in Southwest China has a "corridor-barrier" effect on monsoons circulation,which led to the redistribution of surface hydrothermal pattern and is the main driving force of the formation and evolution of the ecosystems.Previous studies showed that LRGR was influenced by the combined effect of the Indian monsoon and the Pacific monsoon,which meet at the Ailaoshan mountain ranges.The Ailao Mountains are an important geographical dividing line.In this study,based on proofs of the atmospheric circulation,moisture transport,regional climate,runoff,and plant stable oxygen isotopes compostion,we found that LRGR is affected mainly by the Indian monsoon.The Pacific monsoon only affect this area in August,and the influence is not significant.Under the terrain "corridor-barrier" effect,surface water vapor,precipitation and runoff in LRGR showed significant zonal differences and meridional extension;crowd circulation,moisture transport,regional climate and river runoff.The atmospheric precipitable water,precipitation and stream flow present an apparently different pattern between the west and east sides of Ailao Mountains.The environmental differences are the results of the hydrothermal redistribution by the special terrain,which are the "barrier" and "corridor" effects of the LRGR.These differences are not the results of geographical zonality,but the results of non-zonality.The "corridor-barrier" effects of the longitudial range-gorge on monsoons result in the spatial differences of the geographical elements and the associated ecological effects.
西南纵向岭谷地形对季风的“通道—阻隔”作用
DOI:10.11821/yj2012010001
[本文引用: 3]
地形格局对大气环流与区域气候具有重要影响。已有研究认为纵向岭谷区主要受到印度洋季风与太平洋季风的共同影响,二者在哀牢山山脉附近交汇,哀牢山山脉是一条重要的地理分界线。本文从大气环流、水汽输送、区域气候、河川径流以及植物稳定氧同位素等多个方面研究发现:纵向岭谷地区主要受印度洋季风的影响,太平洋季风的影响在8月份有一定的作用,但不够明显;在地形格局作用下,地表水汽、降水以及河川径流在纵向岭谷区表现出明显的纬向差异、经向延伸的特征;大流环流、水汽输送、区域气候以及河川径流等的空间差异,是特殊环境对水热再分配的结果,即"通道-阻隔"作用的效应;这些差异不是地理地带性的表现,而是非地带性作用的结果;这种"通道—阻隔"作用导致地表水热条件的再分配,是该区生态地理格局形成与演化的主驱动力之一。纵向岭谷地形对季风的"通道—阻隔"作用导致了一系列地理要素的空间分异和相关联的生态效应。
The Dujiangyan Region: Pivot sector of assemblage, differentiation and maintenance of biodiversity in northern part of Hengduan Mountain
都江堰地区─横断山北段生物多样性交汇、分化和存留的枢纽地段
Spatial patterns of plant diversity and communities in Alpine ecosystems of the Hengduan Mountains, northwest Yunnan, China
DOI:10.1093/jpe/rtn012 URL [本文引用: 1]
Spatio-temporal variations of temperature and precipitation in Mts
我国横断山区1960—2008年气温和降水时空变化特征
Variation character of annual, seasonal and monthly temperature and precipitation
横断山区气温和降水年季月变化特征
1 km growing season length data product over China-ASEAN (2013)
1 km growing season length data product over China-ASEAN (2013)
The safety of the settlement in mountain area with frequent geological disasters: Examples of villages and towns in the Hengduan Mountains
地质灾害频发山区聚落安全性探索: 以横断山系的集镇和村庄为例
Spatial pattern of debris-flow catchments and the rainfall amount of triggering debris flows in the Hengduan Mountains region
DOI:10.11821/dlxb201911008
[本文引用: 3]
Environmental factors determine the spatial and temporal distribution of debris flows. Understanding the relationship between debris flows and their effective factors is important for debris flows risk assessment at regional scale. In this paper, geographic detectors and gray correlation analysis are used to explore the relationship between 11 influencing factors, including precipitation, climate, landforms, geology, land cover type, soil thickness and topographic wetness, and the spatial distribution of debris flows-prone catchments, as well as the spatial and temporal correlation between precipitation and debris flows disasters in the Hengduan Mountains region. The results show that the topographic wetness index is the most dominant factor controlling the spatial distribution of the catchments, followed by topographic relief and soil thickness. Temporal correlation between debris flows disasters and precipitation characteristics has large regional heterogeneity. The rainfall characteristics of debris flows disaster events in different regions exhibit significant difference. The frequency of debris flows with rainfall, topographic wetness, topographic relief and soil thickness in the Hengduan Mountains region varies significantly in different zones, which indicates that not only the rainfall but also the other factors controlling the spatial pattern of debris flows should be reflected in debris flows early warning model in the region.
横断山区泥石流空间格局和激发雨量分异性研究
DOI:10.11821/dlxb201911008
[本文引用: 3]
地形、降雨等环境因子决定了泥石流的时空分布特征,理解泥石流与这些因子的关系有助于区域泥石流灾害风险评估与防灾减灾工作。以横断山区为研究区域,选取降水、气候、地貌、地质、土地覆盖、土壤厚度、高差势能以及湿度指数等因子,利用地理探测器和灰度关联分析等方法,探讨了环境因子与泥石流沟空间分布的关系以及降水特征与泥石流灾害的时间关联性。结果表明,湿度指数是决定泥石流沟空间格局的最主要因子,其次是高差势能和土壤厚度,多年平均分布的降水特征对泥石流沟分布的影响较小。泥石流灾害事件与降水特征的时间关联具有较大的区域异质性。泥石流发生地的激发雨量、湿度指数、高差及土壤厚度的统计分布在不同地貌、地质和气候单元中有明显差异。这表明泥石流预警不仅需要考虑雨量等激发因子,还必须考虑其他影响因素的空间差异性。
Detecting changes and causes of vegetation greenness in the Hengduan Mountains region, China
横断山区植被绿度的时空变化特征及其成因
Tempo-spatial variations and driving factors analysis of net primary productivity in the Hengduan Mountain area from 2004 to 2014
横断山区2004—2014年植被NPP时空变化及其驱动因子
Spatio-temporal pattern of net primary productivity in Hengduan Mountains area, China: Impacts of climate change and human activities
DOI:10.1007/s11769-017-0895-5 URL [本文引用: 2]
Quantitatively determine the dominant driving factors of the spatial-temporal changes of vegetation NPP in the Hengduan Mountain area during 2000-2015
DOI:10.1007/s11629-020-6404-9 URL [本文引用: 2]
Land use/land cover change and the effects on ecosystem services in the Hengduan Mountain region, China
DOI:10.1016/j.ecoser.2018.09.008 URL [本文引用: 2]
Problems and countermeasures in returning cultivated land in steep hills into forest and in banning deforestation in the upper reaches of the Yangtze River
长江上游退耕还林与天然林保护的问题与对策
The division of vertical vegetation zone in Hengduanshan
横断山自然植被垂直带的划分
Discussion upon the regularities of vegetational distribution in the Hengduan Mountains
横断山地区植被分布规律的探讨
Spatial pattern and exposure effect of altitudinal belts in the Hengduan Mountain
横断山区垂直带谱的分布模式与坡向效应
Quantitative analysis of the impact of ecological projects on vegetation dynamics under the background of climate change: A review of methods
气候变化背景下定量解析生态工程对植被动态影响的研究方法综述
Evaluation of natural heritage potential of China in the background of applying for world natural heritage
申遗背景下的中国自然遗产潜力评估
A new scheme for climate regionalization in China
DOI:10.11821/xb201001002
[本文引用: 1]
A new scheme for climate regionalization in China was established based on the daily observations for 609 meteorological stations during the period 1971-2000.During regionalization,current basic theories,classification methodologies and criteria system were used,besides,five principles were taken into consideration,mainly included zonal and azonal integration,genetic unity and regional relative consistent climate integration,comprehensiveness and leading factors integration,bottom-up and top-down integration,spatial continuity and small patch omission.The new scheme consists of 12 temperature zones,24 moisture regions and 56 climatic sub-regions.
中国气候区划新方案
Gross and net land cover changes in the main plant functional types derived from the annual ESA CCI land cover maps (1992-2015)
DOI:10.5194/essd-10-219-2018 URL [本文引用: 1]
Accuracy evaluation of the seven land cover data in Qiangtang Plateau
DOI:10.11821/dlyj201711003
[本文引用: 2]
The land cover datasets in the Qiangtang Plateau (QP) have generally been considered as the fundamental data in the studies of local environmental and ecological issues. We evaluated the accuracy of seven land cover datasets in the QP, i.e. International Geosphere-Biosphere Program's Data and Information System Cover (IGBPDIS), Global Land cover mapping at 30 m resolution (GlobeLand 30), The MODIS Land Cover Type product (MCD12Q1), Climate Change Initiative Land Cover (CCI-LC), Global Land Cover 2000 (GLC2000), GlobCover 2009 (GlobCover) and University of Maryland (UMD). For that, the study used 6851 field samples with first and second level (8 and 10, respectively) land cover types. Three widely used parameters were derived to describe the error matrix of the map and also for the overall user's and producer's accuracy. The quantitative assessments of the map quality and classification accuracy for the available land cover maps will help to improve the overall accuracy of land cover mapping in future. The overall results of the assessment pointed out that the GlobeLand 30 and CCI-LC land cover map have higher accuracy than other data sets. However, they are also just 55.09% and 53.92% in first level assessment and 46.55% and 46.23% in the second level accuracy assessment. The best producer's accuracies of the three main land cover classes, e.g. alpine grassland, barren land and desert land in the QP were 46.19% in GLC 2000, 39.20% in MCD12Q1, and 84.44% in the IGBPDIS. The user's accuracy of the three first level land cover classes were less than 50%. In addition, the accuracy of the CCI-LC data was 92.8%, with omission error at 19.90% in the snow and ice cover. After analysis, we found that the discrepancy of classification system and the typical plateau environment in the QP are the main factors that result in a high level of inaccuracy of the land cover datasets.
七套土地覆被数据在羌塘高原的精度评价
DOI:10.11821/dlyj201711003
[本文引用: 2]
基于羌塘高原8个一级土地覆被类型(包括10个二级土地覆被类型)的6851个样本点,采用混淆矩阵方法,从总体精度、制图精度和用户精度角度评价International Geosphere-Biosphere Program's Data and Information System Cover(IGBPDIS)、Global Land cover mapping at 30 m resolution(GlobeLand 30)、The MODIS Land Cover Type product(MCD12Q1)、Climate Change Initiative Land Cover(CCI-LC)和Global Land Cover 2000(GLC2000)等七套土地覆被数据产品在羌塘高原的精度。结果表明:① 七套数据产品的一级类型和二级类型总体精度普遍偏低,在相对较高的GlobeLand 30和CCI-LC数据中,一级类型总体精度分别为55.09%和53.92%,二级类型分别为46.55%和46.23%;② 草地、裸地和荒漠三个主要一级类型生产者精度最高的数据对应为:GLC 2000(46.19%)、MCD12Q1(39.20%)和IGBPDIS(84.44%)。而三个主要一级类型的用户精度均低于50%。其他覆被类型中,雪被与冰川类型用户精度最高的数据为CCI-LC(92.80%),漏分比例为19.90%;③ 羌塘高原特殊的高原环境与土地覆被分类系统构成原则和标准是影响遥感解译数据精度的主要原因。
Accuracy assessment of seven global land cover datasets over China
DOI:10.1016/j.isprsjprs.2017.01.016 URL [本文引用: 2]
The impact of global cropland changes on terrestrial ecosystem services value, 1992-2015
DOI:10.1007/s11442-019-1600-7
[本文引用: 1]
From 1992 to 2015, ecological environment has been threatened by the changes of cropland around the world. In order to evaluate the impact of cropland changes on ecosystem, we calculated the response of terrestrial ecosystem service values (TESVs) variation to cropland conversion based on land-use data from European Space Agency (ESA). The results showed that cropland changes were responsible for an absolute loss of $166.82 billion, equivalent to 1.17% of global TESVs in 1992. Among the different regions, the impact of cropland changes on TESVs was significant in South America and Africa but not obvious in Oceania, Asia and Europe. Cropland expansion from tropical forest was the main reason for decreases in TESVs globally, especially in South America, Africa and Asia. The effect of wetland converted to cropland was notable in North America and Europe while grassland converted to cropland played an important role in Oceania, Africa and Asia. In Europe, the force of urban expansion cannot be ignored as well. The conversion of cropland to tropical or temperate forest partly compensated for the loss of TESVs globally, especially in Asia.
Land cover classification system: Classification concepts and user manual
Application of CASA model to the estimation of Chinese terrestrial net primary productivity
利用CASA模型估算我国植被净第一性生产力
基于地理信息系统和卫星遥感应用技术,利用CASA模型估算了我国1997年植被净第一性生产力及其分布。结果表明: 1997年我国植被净第一性生产量为1.95 Pg C, 约是世界陆地植被年净第一性生产力的4.0%; 我国植被净第一性生产力的主要分布趋势是从东南沿海向西北逐渐减小; 其中海南岛南部、云南西南部、青藏高原东南部的热带雨林和季雨林地区植被年净第一性生产力最大,达900 g C•m<sup>–2</sup>•a<sup>–1</sup>以上,而西部塔克拉玛干沙漠地区植被年净第一性生产力最小,不足10 g C•m<sup>–2</sup>•a<sup>–1</sup>。
Comparison of the accuracy between SRTM and ASTER GDEM over typical mountain area: A case study in the Eastern Qinghai-Tibetan Plateau
典型山区SRTM3与ASTER GDEM数据精度对比分析: 以青藏高原东麓深切河谷区为例
DOI:10.3724/SP.J.1047.2015.00091
[本文引用: 1]
目前广泛应用的数字高程模型(DEM)包括SRTM和ASTER GDEM,但在地形影响下,两类数据的误差分布并不均匀。本文选用1:5万地形图DEM及河流要素作为参照,在青藏高原东麓山区开展实验,分别采用“河流-河谷”位置偏移量与高程中误差来评价两类数据的平面精度与垂直精度,结果表明:(1)实验区内SRTM3存在向西南方向的水平位置偏移,平均偏移量为127.8 m,ASTER GDEM则以正西方向偏移为主,平均偏移量为104.1 m,该区域ASTER GDEM的总体平面精度较好;(2)SRTM3数据样本的绝对误差分布相对集中,高程中误差为35.3 m,小于ASTER GDEM样本的高程中误差50.2 m,总体垂直精度优于ASTER GDEM;(3)在平均高程大于4500 m的高海拔区域,两类数据的中误差与高程值正相关,SRTM3中误差随高程增速较慢,垂直精度较ASTER GDEM高;(4)两组数据垂直精度对坡度有较大依赖性,中误差随坡度近似指数曲线增长,在平缓区域SRTM3中误差小于ASTER GDEM。本研究为该类数据在山区的选用及误差修正提供依据。
Comparison of slope classification methods in slope mapping from DEMs
基于DEM坡度图制图中坡度分级方法的比较研究
Homogenized daily relative humidity series in China during 1960-2017
DOI:10.1007/s00376-020-9180-0 URL [本文引用: 1]
Study on the variation of landscape pattern in the west suburbs of Shenyang
Spatial pattern of landscape is a central issue in landscape ecology research. The main reason of variation of landscape pattern owes to the external disturbance. There are three remarkable variations of landscape pattern:(a)a landscape element becomes a new matrix in place of former matrix;(b) landscape proportions among several landscape elements changed; (c) a new landscape element is arisen in the landscape system. Landscape pattern was studied in this paper with following quanta indexes:(1) number and size of patches, (2) transition matrix of patches, (3) dominance indexes of patches, (4) the diversity index of landscape.The results show that in the west suburbs of Shenyang, landscape is becoming more and more fragmentary throughout 30 years. There are many patches plot or island-liked in the landscape. Landscape matrix has changed, the west suburbs of Shenyang is urbanized remarkably. Economical benefits of land use has increased. With the population growth, average land area per person has constantly decreased. The unused land hardly left. This means that the capacity of land will be saturated, predicting land crisis is coming.
沈阳西郊景观格局变化的研究
Land-cover change detection using multi-temporal MODIS NDVI data
DOI:10.1016/j.rse.2006.06.018 URL [本文引用: 1]
Advance and evaluation in the long time series vegetation trends research based on remote sensing
基于遥感的植被长时序趋势特征研究进展及评价
Character of vegetation cover change in China's eastern coastal areas 1998-2008
1998—2008年中国东部沿海植被覆盖变化特征
Spatial differences of variations of vegetation coverage in Inner Mongolia during 2001-2010
DOI:10.11821/xb201209010
[本文引用: 1]
Global climate change has led to significant vegetation changes in the past half century. Inner Mongolia, most of which was located in arid and semi-arid areas, is undergoing a process of prominent warming and drying. It is necessary to investigate the response of vegetation to the climatic variations (temperature and precipitation) for a better understanding of the accumulated consequence of climate change. Vegetation coverage, which is an important indicator for evaluating terrestrial environment, is used to monitor vegetation change. MODIS-NDVI data and climate data were used to analyze the vegetation dynamics and its relationship with climate change on different spatial (forest, grassland and desert biome) and temporal (yearly and monthly) scales in Inner Mongolia during 2001-2010. It was found that vegetation coverage increased from west to east across Inner Mongolia with a change rate of 0.2/10°N. During 2001-2010, the mean vegetation coverage was 0.57, 0.4 and 0.16 in forest, grassland and desert biome, respectively, exhibiting evident spatial heterogeneities. There is a slight increase of vegetation coverage over the study period. Across Inner Mongolia, the vegetation coverages with extremely significant and significant increase accounted for 11.25% and 29.13% of the total study area, respectively, while those with extremely significant and significant decrease were 7.65% and 26.61%, respectively. The correlation analysis between vegetation coverage and climate shows that annual vegetation coverage was better correlated with precipitation, while the change of monthly vegetation coverage is consistent with both the changes of temperature and precipitation, indicating that the vegetation growth within a year is more sensitive to the joint function of hydrothermal combination rather than either climate factor. The vegetation coverage of forest biome was mainly affected by temperature on both yearly and monthly scales, while that of desert biome was mainly influenced by precipitation on the two temporal scales.
2001—2010年内蒙古植被覆盖度时空变化特征
Intercomparison of the time for climate abrupt change between the Tibetan Plateau and other regions in China
青藏高原与中国其他地区气候突变时间的比较
Interpretation of China Biodiversity Conservation Strategy and Action Plan
《中国生物多样性保护战略与行动计划》解读
Biodiversity survey and assessment methods in biodiversity conservation priority areas in China
中国生物多样性保护优先区域生物多样性调查和评估方法
Vegetation distribution characteristics and diversity conservation in Habaxueshan provincial nature reserve
哈巴雪山省级自然保护区植被分布特征及其多样性保护研究
Vegetation diversity of Yunnan
云南植被多样性研究
A research on the distribution of Pinus yunnanensis forest in Yunnan Province
云南松林在云南的分布研究
Investigation and analysis of farmland afforestation by RS and GIS in Western of Sichuan Province, China
干旱河谷地区退耕还林调查与生态还林分析
Spatial and temporal variations of land use and vegetation cover in Southwest China from 2000 to 2015
DOI:10.13287/j.1001-9332.202102.017
[本文引用: 2]
Southwestern China is an important ecologically resource area and ecologically fragile area in China, which plays an important role in the national project of “Clear Waters and Green Mountains”. Based on land use data set with a 1 km spatial resolution and combined with land use transfer matrix, we analyzed the characteristics and driving forces of land use change in Southwest China from 2000 to 2015. Based on the MODIS remote sensing index, we calculated the vegetation coverage in Southwest China using the dimidiate pixel model, and analyzed the changes of the normalized vegetation index (NDVI) and vegetation coverage. Results showed that the main land types were woodland, cropland and grassland. The built-up land area increased by 5874 km<sup>2</sup>(55.8%), the cropland area decreased by 6211 km<sup>2</sup>, and grassland decreased by 2099 km<sup>2</sup>. From 2000 to 2015, the area that had been changed to built-up land was the largest, mainly from cropland (contributed 68.2%), woodland (contributed 19.2%) and grassland (contributed 13.1%). The transformed areas were mostly close to urban area. The area and rate for the transformation of cropland were 7079 km<sup>2</sup> and 2.2% respectively, accounting for 46.0% of all the transferred out areas. Most of the woodland were transformed from grassland (61.8%), mainly distributed in central and southern Guizhou and western Yunnan. Both NDVI and vegetation coverage were significantly increased, indicating that the whole region was greening. NDVI of both natural vegetation and cropland increased significantly, while the NDVI of areas with expanded build-up land decreased. Therefore, natural vegetation and cropland dominated the vegetation change in this region. Results of the resi-dual analysis showed that both climate change and human activities contributed significantly to the greening trend.
2000—2015年西南地区土地利用与植被覆盖的时空变化
DOI:10.13287/j.1001-9332.202102.017
[本文引用: 2]
西南地区是我国重要的生态资源区和生态脆弱区,在国家“绿水青山”战略发展中具有重要地位。本研究基于1 km空间分辨率的土地利用数据集,结合土地利用转移矩阵,定量分析2000—2015年间西南地区土地利用变化特征及其驱动力。并基于MODIS遥感植被指数,利用像元二分模型计算西南地区植被覆盖度,分析归一化植被指数(NDVI)和植被覆盖度的变化规律。结果表明: 研究期间,西南地区的主要地类是林地、农田和草地。建设用地面积增加5874 km<sup>2</sup>,增长率为55.8%;农田面积减少最多,下降6211 km<sup>2</sup>,其次是草地,减少2099 km<sup>2</sup>。2000—2015年间,西南地区建设用地的转入面积最多,主要由农田(贡献率68.2%)、林地(贡献率19.2%)和草地(贡献率13.1%)转化而来,转化的区域多靠近城区。农田的转出面积和转出率分别为7079 km<sup>2</sup>和2.2%,占所有转出类型面积的46.0%。林地多由草地(贡献率61.8%)转化而来,转化区域多分布在贵州中南部和云南西部等地。全区NDVI和植被覆盖度均呈显著增加趋势,说明研究区整体呈变绿趋势。其中,自然植被和农田的NDVI均显著增长,建设用地扩张地区的NDVI下降,说明自然植被和农田主导了该地区植被变化。通过残差分析发现,气候变化和人类活动对研究区变绿趋势的贡献显著。
Hard-leaved evergreen broad-leaved forests in China
我国的硬叶常绿阔叶林
China and India lead in greening of the world through land-use management
DOI:10.1038/s41893-019-0220-7
PMID:30778399
[本文引用: 1]
Satellite data show increasing leaf area of vegetation due to direct (human land-use management) and indirect factors (climate change, CO fertilization, nitrogen deposition, recovery from natural disturbances, etc.). Among these, climate change and CO fertilization effect seem to be the dominant drivers. However, recent satellite data (2000-2017) reveal a greening pattern that is strikingly prominent in China and India, and overlapping with croplands world-wide. China alone accounts for 25% of the global net increase in leaf area with only 6.6% of global vegetated area. The greening in China is from forests (42%) and croplands (32%), but in India is mostly from croplands (82%) with minor contribution from forests (4.4%). China is engineering ambitious programs to conserve and expand forests with the goal of mitigating land degradation, air pollution and climate change. Food production in China and India has increased by over 35% since 2000 mostly due to increasing harvested area through multiple cropping facilitated by fertilizer use and surface/ground-water irrigation. Our results indicate that the direct factor is a key driver of the "Greening Earth", accounting for over a third, and likely more, of the observed net increase in green leaf area. They highlight the need for realistic representation of human land-use practices in Earth system models.
Spatial and temporal characteristics of land use and cover changes in the Tibetan Plateau
青藏高原土地利用与覆被变化的时空特征
Spatiotemporal characteristics, patterns and causes of land use changes in China since the late 1980s
DOI:10.11821/dlxb201401001
[本文引用: 1]
Land-Use/land Cover Changes (LUCC) are a direct consequence of human and nature interactions. China's Land Use/cover Datasets (CLUD) were updated regularly at five-year intervals from the late 1980s to the year of 2010 with standard procedures based on Landsat TM/ETM + images. A dynamic zoning method was proposed to analyze major land-use conversions. The spatiotemporal characteristics, differences, and causes of land-use changes at a national scale were then examined. The main findings are summarized as follows: Land-Use Changes (LUC) across China indicated a significant variation in spatial and temporal characteristics in the past 20 years between the 20th and 21st centuries. The amount of cropland change decreased in the south and increased in the north, but the total area remained almost unchanged. The reclaimed cropland was shifted from northeast to northwest. The built-up lands were expanded rapidly, which were mainly distributed in the east and gradually spread out to the midwest. Woodland decreased first and then increased, but desert area was inverted. Grassland continued decreasing. Different spatial patterns of LUC in China were found between the late 20th century and the early 21st century. The original 13 LUC zones were replaced by 15 units with changes of boundaries in some zones. The main spatial characteristics of these changes included (1) an accelerated expansion of built-up land in the Huang-Huai-Hai region, the coastal areas of southeastern China, the midstream area of the Yangtze River, and the Sichuan Basin; (2) the shifted land reclamation in the north from Northeast China and eastern Inner Mongolia to the oasis agricultural areas in Northwest China; (3) the continuous transform from rain-fed farmlands in Northeast China to paddy fields; and (4) the effectiveness of the “Grain-for-Green” project in the southern agricultural-pastoral ecotones of Inner Mongolia, the Loess Plateau, and mountainous areas of southwestern China. In recent two decades, although climate change in the north impacted the change in cropland, policy regulation and economic driving forces were still the primary causes of LUC across China. During the first decade of the 21st century, the anthropogenic factors that drove variations in land-use patterns have shifted the emphasis from one-way land development to both development and conservation. The "dynamic zoning method" was used to analyze changes in the spatial patterns of zoning boundaries, the internal characteristics of zones, and the growth and decrease of units. The results revealed "the pattern of the change process," namely the process of LUC and regional differences in characteristics at different stages. The growth and decrease of zones during this dynamic LUC zoning, variations in unit boundaries, and the characteristics of change intensities between the former and latter decades were examined. The patterns of alternative transformation between the "pattern" and "process" of land use and the reasons for changes in different types and different regions of land use were explored.
20世纪80年代末以来中国土地利用变化的基本特征与空间格局
Spatiotemporal patterns of vegetation coverage and response to climatic and topographic factors in growth season in Southwest China
西南地区生长季植被覆盖时空变化特征及其对气候与地形因子的响应
Spatiotemporal variation of the vegetation coverage in Yangtze River Basin during 1982-2015
DOI:10.31497/zrzyxb.20171056 URL [本文引用: 1]
1982—2015年长江流域植被覆盖度时空变化分析
Normalized difference vegetation index of different vegetation cover types and its responses to climate change in the Loess Plateau
黄土高原不同植被覆被类型NDVI对气候变化的响应
Study on land cover change based on vegetation succession: Forest cutting, regeneration and degradation in the upper reaches of Dadu River
基于植被演替的土地覆被变化研究: 大渡河上游的森林采伐、更新和退化
Preliminary study on the distribution characteristics of potentially unstable vegetated-slopes: A case study of Dadu River basin
植被覆被条件下不稳定斜坡分布规律探究: 以大渡河流域为例
Analysis of the difference between landscape surface area and vertical projection area in the Hengduan Mountains: A case study of Yajiang county
横断山区地表真实面积与垂直投影面积差异分析: 以雅江县为例
