

1 引言
目前,国内外学者针对城市土地利用变化模拟,通常采用元胞自动机(Cellular Automata, CA)、系统动力学(System Dynamics, SD)、多智能体(Multiple Agent System, MAS)和逻辑回归(Logistic Regression, LR)等模型[3⇓⇓-6]。其中,CA模型因其强大的空间运算能力、与遥感和地理信息数据良好的耦合能力、复杂系统时空动态变化模拟能力等显著优势,已经在土地利用变化[7]、城市群扩展[8]、城市扩散与聚合过程[9]等方面的模拟研究中广泛应用。尤其是在土地利用变化模拟中,CA不仅能够根据局部规则自动模拟出复杂的全局特征,而且可以通过调整元胞大小和邻域结构来适应不同尺度的模拟需求,非常适于开展城市扩张及土地利用变化精细化模拟等领域的研究[3,10⇓ -12]。
遥感影像能够为城市土地利用变化模拟研究提供良好的数据基础[13-14]。目前,以MODIS、Landsat、SPOT、资源卫星和高分卫星等为代表的遥感影像,具有覆盖范围大、时相丰富等优点,已成为城市土地利用变化模拟研究的主要数据源[1,15⇓ -17]。但需注意的是,基于遥感数据提取土地利用信息的传统方法,主要依据影像的光谱和纹理信息,偏重于对城市地表自然属性的识别,难以表达城市土地中与人类活动及社会功能相关的属性。随着城市众源地理信息的快速发展,细粒度的兴趣点(Point of Interests, POI)数据引起了学者的广泛关注[18⇓⇓-21]。它具有定位精度高、数据量大、获取成本低、更新速度快等特点,可以直观反映同人类生活密切相关的用地功能及其空间分布,已经迅速应用于主体功能区划分[22]、城市活力测度[23]、土地利用评价[24]等城市研究。当前,联合运用遥感影像和POI数据来分析城市用地类型及空间特征,已经成为城市功能区识别研究的流行范式[25⇓-27]。然而,一方面遥感影像具有显著的空间尺度依赖性,不同空间分辨率下城市地理单元土地利用解译结果存在差异;另一方面,POI数据也随着城市地理单元尺度的变化呈现不同的空间集聚特征[28]。随着城市土地利用的研究从大尺度粗糙单元向街区精细化单元的转变[10],遥感影像分辨率的差异和POI数据的空间异质性,必然会对用地类型识别结果带来不同程度的误差影响,而且在数量大小和空间分布上呈现出较大差异;更为严重的是,这些误差在精细化模拟过程中会不断积累和传播,使得城市用地研究产生极大的不确定性。因此,如何降低不同粒度的数据给精细化模拟带来的空间尺度效应,值得深入研究。
在城市土地利用变化精细化模拟过程中,空间尺度效应不仅仅表现在使用的数据源方面,也体现在研究所采用的模拟方法上[29-30]。据文献统计[30⇓⇓⇓⇓⇓-36],现有城市土地利用变化元胞自动机模拟尺度问题的研究,主要从元胞大小、邻域大小、邻域类型等角度,探索这些单一因素或交互作用在不同空间尺度上对模拟精度的影响,这些研究成果能够为土地利用精细化模拟中的空间尺度效应研究提供重要的参考,然而也存在一定的局限性。上述研究仅仅基于遥感影像解译出较为宏观的土地利用类型来展开,未考虑城市中心土地类型所具有的显著社会功能特征。但是,城市中心更为精细化的土地利用类型在元胞自动机模拟过程中所产生的空间尺度效应,其对模拟结果的影响规律与现有研究结论是否相同,尚未明确。
本文面向城市土地利用变化精细化模拟的需求,在联合遥感影像与POI数据识别城市土地利用自然属性与社会用地功能基础上,结合CA-Markov(Cellular Automata Markov)模型,提出了一种基于响应面法的最优空间尺度参数率定方法,有效地控制了城市土地利用变化精细化模拟过程的空间尺度不确定性,确保精细化模拟用地变化趋势的可靠性,有助于精准掌握城市土地利用空间格局的变化规律。
2 研究区概况与数据来源
2.1 研究区概况
武汉是中国重要的工业基地、科教基地和综合交通枢纽,总面积为8569 km2,2020年常住人口1232万,在中国特大型城市排名中位居第4。自20世纪80年代以来,武汉市城市化规模急剧扩张,中心城区格局在不断扩大与细化,从最初的武昌、汉口、汉阳三镇逐渐发展为江岸、江汉、硚口、汉阳、武昌、青山、洪山共7个主城区。该区域承载着武汉建设国家中心城市和国际化大都市的核心生产功能与生活服务功能,未来土地开发利用密度将进一步提高。在高强度的人类活动影响下,城市用地将表现出功能超细分、变化高动态、分布互为交织等显著特点,对城市土地的节约集约利用带来了严峻挑战。因此,本文选取武汉市中心城区作为研究区(图1),其地理位置为30°19′N~30°44′N、114°01′E~114°34′E,对其2010—2020年期间建设用地扩张驱动下土地利用精细化特征及演化规律进行研究,有利于城市科学开展土地资源的优化配置。
图1
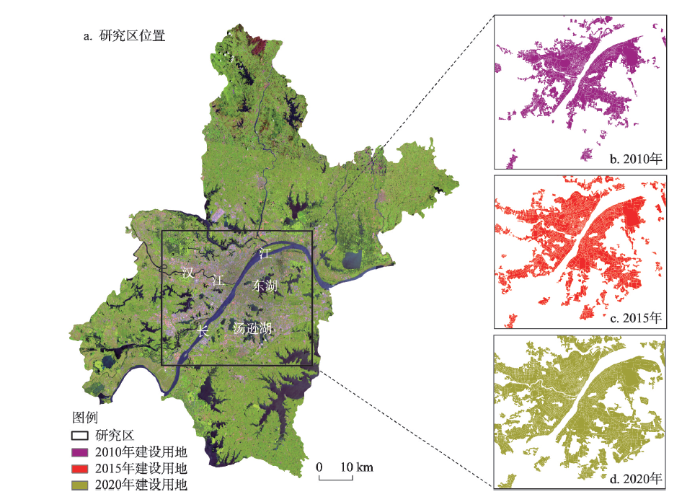
图1
研究区位置及其2010年、2015年与2020年建设用地范围
注:图a源于地理空间数据云(
Fig. 1
Location of the study area and its construction land scope in 2010, 2015, and 2020
2.2 数据来源及处理
研究数据主要包括:① 遥感影像,源于地理空间数据云(
首先,采用监督分类方法对上述3期遥感影像进行土地利用信息提取,将武汉市土地分为耕地、林地、草地、水域和建设用地共5种用地类型。其次,利用多时相路网数据切割中心城区建设用地得到城市街区单元。然后,参照2015年和2020年POI数据,对2010年POI数据中研究区典型地标的地理位置和标签进行核查,并检索同期运用国内互联网地图POI数据开展科学研究的文献[20,37],确保POI数据的可信度。针对POI数据属性标签不统一的问题,在遵循《城市用地分类与规划建设用地标准(GB50137-2011)》统一标准对城市街区单元进行重分类(表1)的基础上,对不符合分类标准的数据,结合其实际用地性质进行用地功能的判定。最后,从自然地形、交通运输、商业网点、公共服务等方面重点选取影响土地利用变化的13个驱动因子,制作土地利用变化模拟所需的适宜性图集。
表1 基于POI数据的城市用地重分类
Tab. 1
| 编号 | 重分类结果 | 原始POI一级分类 | 原始POI二级分类 |
|---|---|---|---|
| 1 | 居住用地 | 商务住宅、地产小区 | 住宅小区、商务住宅相关、楼宇、别墅、社区中心等 |
| 2 | 公共用地 | 政府机构及社会团体、医疗保健服务、科教文化服务、体育休闲服务、公共设施 | 政府机关、公检法机构、工商税务机构、社会团体、医院、诊所、医药保健销售店、急救中心、学校、科研机构、培训机构、运动场馆、休闲场所等 |
| 3 | 商服用地 | 餐饮服务、购物服务、金融保险服务、摩托车服务、汽车服务、汽车维修、汽车销售、生活服务、住宿服务 | 中外餐厅、快餐厅、综合市场、购物相关场所、商场、便利店、综合市场、金融保险服务机构、银行、保险证券公司、各类汽车维修销售场所、电讯营业厅、中介机构、美容美发店、宾馆酒店、旅馆招待所、娱乐场所等 |
| 4 | 工业用地 | 公司企业、商务住宅 | 公司、知名企业、工厂、产业园区、农林牧渔基地等 |
| 5 | 交通用地 | 交通设施服务、道路附属设施 | 火车站、港口码头、汽车站、地铁站、收费站、服务区、加油站、其他能源站、加气站等 |
| 6 | 绿地和广场用地 | 风景名胜、地名地址信息 | 风景名胜相关、公园广场、旅游景点、自然地名、山、河流、湖泊等 |
3 研究方法
3.1 技术路线
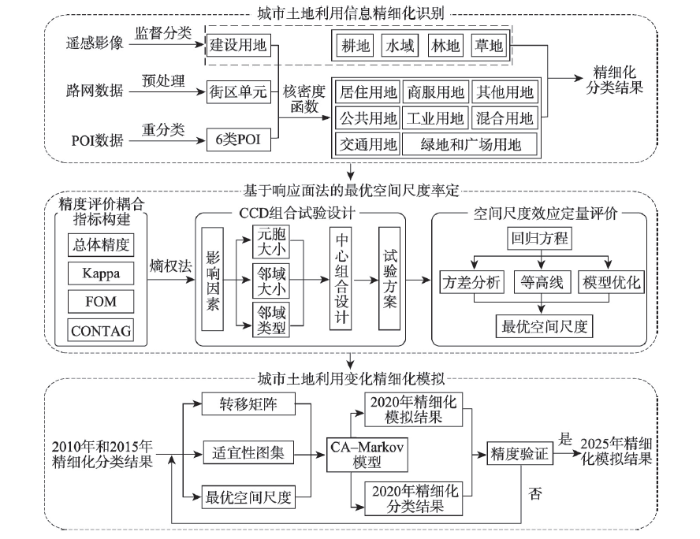
本文在遥感影像基础上引入POI和基础地理信息等多源时空数据,综合运用监督分类、核密度函数等方法进行城市土地利用信息精细化识别;为了控制空间尺度效应引起的城市土地利用变化精细化模拟不确定性,利用总体精度(Overall Accuracy, OA)、Kappa系数、FOM指数和CONTAG指数,提出了一种基于熵权法的模拟精度评价耦合指标,通过响应面法开展不同空间尺度的中心组合试验,率定出用于精细化模拟的最优空间尺度;在此基础上,采用经典的CA-Markov模型完成研究区的土地利用变化精细化模拟。技术路线如图2所示。
图2
3.2 基于POI 的城市土地利用精细化识别方法
3.2.1 核密度函数
核密度函数源于地理学第一定律,作为一种非参数估计方法常用于地理数据空间分布形态的研究[1]。它利用搜索半径内某点到中心点的距离,表征该点密度值随距离衰减的特点,能够有效描述POI数据的分布密度及其对城市用地功能的影响程度,计算公式为:
式中:
3.2.2 用地类型精细化识别规则
式中:
3.3 基于CA-Markov的城市土地利用变化精细化模拟方法
3.3.1 精细化适宜性图集的构建
适宜性图集主要用来约束CA模拟中土地利用类型的转换,是提高CA模拟精度的重要因素。本文借鉴摆万奇等[39]和史培军等[40]提出的方法,结合研究区精细化土地利用类型信息,从自然地形、交通运输、商业网点、公共服务等方面分析土地利用变化的驱动因子。根据各因子的特征,利用欧式距离、栅格标准化和核密度函数等方法进行因子的空间化处理,分别得到距铁路的距离、距高速公路的距离、距市内主干道的距离、高程、坡度、餐厅POI的核密度、超市POI的核密度、商场POI的核密度、公交站POI的核密度、公园POI的核密度、学校POI的核密度、银行POI的核密度和医院POI的核密度,共计13个驱动因子量化指标。在此基础上,采用多准则评价方法分别建立不同土地利用类型转移的精细化适宜性图集。
3.3.2 CA-Markov模拟方法
式中:
CA模型计算公式如下:
式中:
3.3.3 土地利用精细化模拟精度评价的耦合指标
式中:
3.4 精细化模拟过程的空间尺度效应控制方法
3.4.1 空间尺度效应量化
空间尺度效应的量化是减弱和控制城市土地利用变化精细化模拟结果不确定性的重要前提。空间尺度效应主要与数据源以及CA模型中的元胞大小、邻域大小和邻域类型等因素有关[35]。其中,元胞大小的量化可以通过调整数据源的空间分辨率来实现;邻域大小和邻域类型共同决定了中心元胞周围的元胞数量及空间分布;邻域大小为奇数,其量化形式一般为3×3、5×5和7×7等,常见的邻域类型有摩尔(Moore)和冯诺依曼(Von Neumann)。为此,本文选择元胞大小、邻域大小和邻域类型作为空间尺度效应的影响因素,采用30 m空间分辨率的数据源,设置元胞大小间隔为30 m,利用5水平中心组合设计(Central Composite Design, CCD)试验方法,对精细化模拟的方案进行量化设计(表2)。
表2 中心组合试验设计中因素及水平对应关系
Tab. 2
| 因素 | 水平 | ||||
|---|---|---|---|---|---|
| -1.41 | -1 | 0 | 1 | 1.41 | |
| 元胞大小X1 | 30 | 60 | 90 | 120 | 150 |
| 邻域大小X2 | 3×3 | 5×5 | 7×7 | 9×9 | 11×11 |
| 邻域类型X3 | - | Moore | - | Von | - |
3.4.2 最优空间尺度的率定方法
为将空间尺度效应对模拟精度的影响降到最低,提出了一种基于响应面法(Response Surface Method, RSM)的最优空间尺度率定方法,通过以最少的实验次数高效计算出元胞大小、邻域大小和邻域类型3个影响因素的最优空间尺度组合,有效控制城市土地利用变化精细化模拟过程的不确定性。响应面法主要通过试验设计、函数模型构建、模型优化以及综合指标评价等流程,快速选出最优影响因素组合[43]。本文需要同时考虑单一影响因素及因素间的交互作用对空间尺度效应的影响,采用的四阶模型计算公式如下:
式中:Y是目标响应值,也代表模拟精度;a0是截距系数;ai、bij、cijk和dijk分别代表一次项、二次项、三次性和四次项的回归系数;xi、xj和xk代表影响因素;n为影响因素的个数。
利用响应面法率定最优空间尺度的方法如下:首先,基于表2所述的因素及水平对应关系,在Design-Expert软件中得到不同尺度参数的中心组合试验设计方案,并依据该方案进行CA-Markov模拟实验;其次,通过式(5)对试验设计方案模拟结果进行精度评价,计算得到相应的耦合值
4 结果分析
4.1 土地利用精细化分类结果及变化特征
4.1.1 土地利用信息精细化识别结果
依据精细化识别方法中式(1)和式(2),计算各土地利用类型POI的核密度值及占比;参照薛冰等[38]的研究,设置阈值T为50%,识别出研究区建设用地范围内土地利用的精细化类别。结合武汉市土地利用规划图,对街区的功能进行局部修正,通过与土地利用宏观分类信息叠加后,分别得到2010年、2015年和2020年武汉市中心城区精细化土地利用图(图3)。为验证土地利用精细化分类的准确性,本文首先对宏观分类结果精度进行评价,将分类结果同GlobeLand 30(
图3
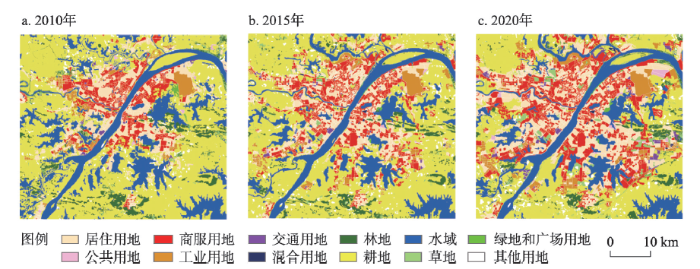
图3
2010年、2015年和2020年武汉市中心城区精细化土地利用图
Fig. 3
The refined land use maps of Wuhan core urban area in 2010, 2015 and 2020
从图3可以看出,2010—2020年武汉市中心城区建设用地扩张特征显著,土地利用整体布局由规则连片逐渐转变为破碎交织。在12类土地利用类型中,耕地和水域的面积呈现减少趋势,尤其是耕地面积缩减程度最大,而商服用地和居住用地面积明显增加,两者在空间上镶嵌交错,沿长江、汉江等江河向外扩张,并围绕东湖、汤逊湖等片区聚集。分析其原因,一方面武汉市中心城区发展过程中土地利用强度逐渐提高,往往需要占用城市内部的水域和城乡结合部的耕地,用来满足城市居民生活服务配套设施的建设需求。另一方面,武汉市得天独厚的水资源条件能够为居民营造良好的宜居环境,也促进居住用地和商服用地向水域周边聚集。
4.1.2 土地利用变化特征分析
表3 2010—2020年武汉市中心城区土地利用转移矩阵(km2)
Tab. 3
| 2010年 | 2020年 | ||||||||||||
|---|---|---|---|---|---|---|---|---|---|---|---|---|---|
| 居住 | 公共 | 商服 | 工业 | 交通 | 绿地 | 混合 | 耕地 | 林地 | 草地 | 水域 | 其他 | 转出 | |
| 居住 | 162.50 | 2.00 | 128.06 | 17.02 | 7.32 | 4.50 | 1.92 | 5.62 | 0.35 | 3.34 | 5.49 | 30.97 | 206.59 |
| 公共 | 3.77 | 0.03 | 7.12 | 1.46 | 1.70 | 0.00 | 0.05 | 1.43 | 0.01 | 0.03 | 0.10 | 1.04 | 16.71 |
| 商服 | 136.32 | 1.55 | 194.56 | 3.43 | 2.37 | 5.47 | 1.52 | 1.75 | 0.11 | 4.97 | 7.05 | 30.91 | 195.45 |
| 工业 | 19.93 | 0.10 | 36.23 | 40.77 | 0.99 | 0.06 | 0.86 | 0.69 | 0.05 | 0.97 | 0.98 | 5.64 | 66.50 |
| 交通 | 5.88 | 0.00 | 7.70 | 0.50 | 4.16 | 1.12 | 0.17 | 0.18 | 0.01 | 0.01 | 0.49 | 1.85 | 17.91 |
| 绿地 | 3.10 | 0.00 | 3.79 | 0.04 | 0.87 | 0.00 | 0.00 | 0.19 | 0.00 | 0.00 | 0.00 | 1.22 | 9.21 |
| 混合 | 0.39 | 0.00 | 1.51 | 0.00 | 0.00 | 0.00 | 1.86 | 0.00 | 0.00 | 0.00 | 0.00 | 0.27 | 2.17 |
| 耕地 | 106.34 | 8.95 | 113.54 | 43.56 | 8.66 | 2.24 | 1.05 | 323.42 | 16.93 | 32.10 | 30.37 | 54.55 | 418.29 |
| 林地 | 4.93 | 0.48 | 2.80 | 0.58 | 0.51 | 0.24 | 0.02 | 24.66 | 26.32 | 7.02 | 1.67 | 1.88 | 44.79 |
| 草地 | 10.48 | 0.63 | 7.17 | 2.33 | 1.53 | 0.00 | 0.20 | 19.6 | 4.94 | 17.13 | 2.13 | 6.42 | 55.43 |
| 水域 | 19.80 | 0.95 | 21.85 | 3.77 | 0.57 | 1.08 | 0.00 | 82.05 | 2.17 | 6.13 | 244.46 | 7.83 | 146.20 |
| 其他 | 38.63 | 1.49 | 33.52 | 8.76 | 0.70 | 0.55 | 0.17 | 13.28 | 0.41 | 2.71 | 4.49 | 63.43 | 104.71 |
| 转入 | 349.57 | 16.15 | 363.29 | 81.45 | 25.22 | 15.26 | 5.96 | 149.45 | 24.98 | 57.28 | 52.77 | 142.58 | 1283.96 |
2010—2020年武汉市中心城区12类土地利用类型均发生了不同程度的转换,变化的总面积达1283.96 km2,占研究区面积的54.35%。其中,以耕地、商服用地、水域、居住用地和其他用地的面积变化特征最为显著。耕地转出面积约是转入面积的2.80倍,且作为主要贡献者分别流向商服用地、居住用地、其他用地、工业用地和草地,该现象在一定程度上说明研究区由于经济发展占用了大量的耕地,可能存在城市扩张用地不合理问题。商服用地是面积增加最显著的用地类型,主要来自于耕地和居住用地的转入,其中,有128.06 km2的转入面积来自居住用地。居住用地转入面积是转出面积的1.70倍,主要得益于商服用地的转入,其转入面积达136.32 km2,占居住用地转入面积的39.00%,由此可见,商服用地和居住用地存在积极的相互转换现象。究其原因,一方面由于新一轮城市规划中旧房屋拆迁后土地使用性质的变更,另一方面目前市面上大量住宅商用一体的建筑形式也促进了二者的转换和融合。水域转出面积远大于转入面积,其转出面积的56.12%流向耕地,占耕地转入面积的54.90%,与GlobeLand 30同期土地利用产品数据的统计结果(水域转出面积的59.36%流向耕地,占耕地转入面积的56.42%)高度吻合,这种土地利用类型转换现象可能主要是由近年来人类生产活动带来大量水土流失造成的。同时,武汉市自2011年开启的全市沿湖沿江沿库的绿道建设,将绿道外围区域划定一定范围的生态敏感区或农业生产用地作为城市生态廊道/组团隔离带的城市建设活动,也促进了水域向耕地的转换。
4.2 土地利用变化精细化模拟的最优空间尺度率定结果
4.2.1 不同空间尺度的精细化模拟结果
图4
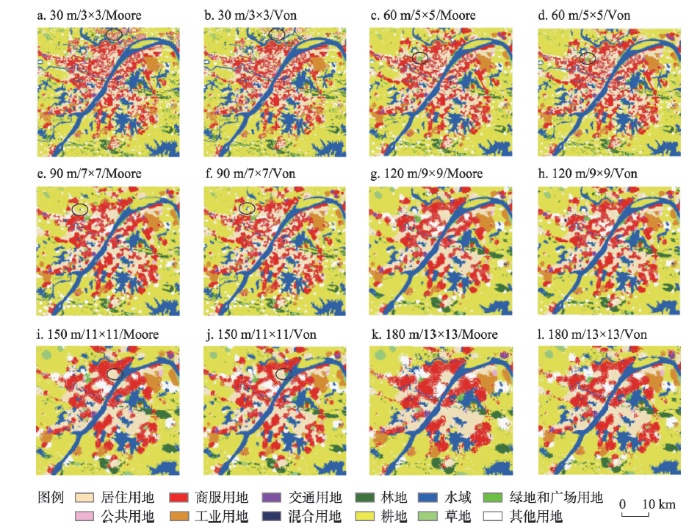
图4
2020年不同空间尺度组合下的武汉市中心城区精细化模拟结果
Fig. 4
The refined simulation results of Wuhan core urban area in 2020 based on different spatial scale combinations
在不同空间尺度下,精细化模拟结果中各类型用地所占面积及空间布局均发生变化。随着元胞大小和邻域大小尺度的增加,模拟结果中相邻土地类型可区分度呈现逐渐降低趋势,精细化特征愈发不够显著。特别是采用大空间尺度组合时,不论采用Moore还是Von邻域类型,其模拟结果均存在较为明显的不同类型用地混合、用地边界缺失或模糊不清等现象,导致各类型用地区分度较低(图4i~4l)。这意味着不同空间尺度组合下精细化模拟的结果会存在较大的差异,小尺度组合在土地利用变化模拟中对精细化特征的刻画要优于大尺度组合。然而需要注意的是,对于元胞为30 m、邻域为3×3的模拟结果(图4a、4b),其边缘区域存在较为明显的用地类型混杂不清现象(黑色椭圆标记处),这表明并非尺度组合越小,精细化模拟结果越理想,其原因主要是由于小尺度组合容易产生严重的边缘尺度效应,从而对模拟结果的准确性带来一定的影响。
这种尺度效应对模拟结果的影响,不仅仅来自于上述的元胞大小和邻域大小的变化,也同邻域的结构差异有关。例如,当元胞为60 m、邻域为5×5(图4c、4d)时,模拟结果中存在两处明显差异(黑色椭圆标记处),采用Moore邻域类型时为绿地和广场用地,而采用Von邻域类型时为商服用地。同样的现象,也存在于元胞为90 m、邻域为7×7(图4e、4f)和元胞为150 m、邻域为11×11(图4i、4j)这两种尺度组合。由此说明在元胞大小和邻域大小保持不变时,不同邻域类型也可能会导致精细化模拟结果局部的差异。因此,空间尺度效应是真实存在于城市土地利用变化CA-Markov精细化模拟过程中,不同空间尺度的元胞大小、邻域大小和邻域类型的组合会造成土地利用精细化模拟结果的不确定性。
4.2.2 精细化模拟过程中空间尺度效应来源的定量分析
表4 中心组合设计试验的22组空间尺度组合及其元胞自动机模拟精度评价指标
Tab. 4
| 序号 | 元胞大小 (m) | 邻域大小 | 邻域类型 | Kappa | FOM | OA | CONTAG | 精度评价耦合指标 |
|---|---|---|---|---|---|---|---|---|
| 1 | 150 | 7 | Moore | 0.5999 | 0.1408 | 0.6762 | 19.9489 | 4.8387 |
| 2 | 120 | 9 | Moore | 0.5962 | 0.1419 | 0.6679 | 21.9321 | 5.2831 |
| 3 | 30 | 7 | Moore | 0.6702 | 0.1685 | 0.7262 | 38.7375 | 9.1090 |
| 4 | 60 | 9 | Moore | 0.6231 | 0.1568 | 0.7011 | 29.6043 | 7.0296 |
| 5 | 90 | 7 | Moore | 0.6156 | 0.1511 | 0.7011 | 25.5459 | 6.1115 |
| 6 | 60 | 5 | Moore | 0.6443 | 0.1661 | 0.7156 | 30.1066 | 7.1545 |
| 7 | 120 | 9 | Von | 0.6114 | 0.1490 | 0.6789 | 18.0032 | 4.4068 |
| 8 | 90 | 7 | Von | 0.6320 | 0.1579 | 0.7148 | 26.4189 | 6.3176 |
| 9 | 90 | 7 | Moore | 0.6156 | 0.1511 | 0.7011 | 25.5459 | 6.1115 |
| 10 | 90 | 11 | Moore | 0.5983 | 0.1420 | 0.6952 | 25.2533 | 6.0366 |
| 11 | 90 | 7 | Von | 0.6320 | 0.1579 | 0.7148 | 26.4189 | 6.3176 |
| 12 | 150 | 7 | Von | 0.6169 | 0.1468 | 0.7010 | 20.7983 | 5.0414 |
| 13 | 90 | 3 | Von | 0.6373 | 0.1445 | 0.7113 | 26.2416 | 6.2748 |
| 14 | 60 | 5 | Von | 0.6671 | 0.1711 | 0.7327 | 31.8350 | 7.5553 |
| 15 | 60 | 9 | Von | 0.6336 | 0.1614 | 0.7036 | 29.5241 | 7.0165 |
| 16 | 90 | 7 | Moore | 0.6156 | 0.1511 | 0.7011 | 25.5459 | 6.1115 |
| 17 | 120 | 5 | Von | 0.6353 | 0.1541 | 0.7087 | 23.6803 | 5.6996 |
| 18 | 90 | 11 | Von | 0.6133 | 0.1507 | 0.6836 | 25.7892 | 6.1624 |
| 19 | 30 | 7 | Von | 0.6766 | 0.1627 | 0.7368 | 39.0818 | 9.1887 |
| 20 | 90 | 3 | Moore | 0.6541 | 0.1591 | 0.7220 | 27.4946 | 6.5683 |
| 21 | 90 | 7 | Von | 0.6320 | 0.1579 | 0.7148 | 26.4189 | 6.3176 |
| 22 | 120 | 5 | Moore | 0.6219 | 0.1504 | 0.6917 | 23.0649 | 5.5528 |
对22组空间尺度组合精度评价的耦合指标
表5 响应面四次模型的方差分析结果
Tab. 5
| Y | ||||||||||||
|---|---|---|---|---|---|---|---|---|---|---|---|---|
| 51.14 | 349.80 | 2.05 | 0.14 | 1.99 | 1.10 | 0.88 | 32.64 | 0.10 | 2.14 | 20.65 | 15.31 | |
| <0.0001 | <0.0001 | 0.1829 | 0.7186 | 0.1883 | 0.3194 | 0.3705 | 0.0002 | 0.7581 | 0.1747 | 0.0011 | 0.0029 | |
| 0.9825 |
注:表中P值小于0.05表明该项对模型影响显著。
以模拟精度Y作为函数目标响应值,元胞大小X1、邻域大小X2和邻域类型X3为自变量,拟合得到回归方程为:
上述回归方程的复相关系数R2达到0.9825(表5),表明该方程对单一影响因素及交互项的拟合效果较好,各项自变量回归系数的正负代表其与模拟精度的正负相关关系,其绝对值大小则表征对模拟精度的影响程度。
由式(7)可知,单一因素对模拟精度的影响力排序为X1>X12>X2>X22>X3,但是通过显著性检验的仅有X1和X12。从式(7)可以看出,一方面X1与模拟精度Y呈线性负相关:元胞大小从30 m到150 m,由表2可知X1将会从-1.41增加到1.41,在这个过程中,随着元胞增大模拟精度逐渐降低。另一方面,
在多因素交互作用中,X1X2、X1X22、X12X2、X12X22的作用强度远大于X2X3和X1X3,说明元胞大小和邻域大小的交互作用对于模拟精度的影响表现最为强烈。值得注意的是,通过显著性检验的仅有X1X22和X12X22。考虑到元胞单元的有效区间为30~90 m,由表2可知X1将会从-1.41增加到0,三次项0.51X1X22和四次项-0.44X12X22的数值都≤ 0,说明它们的交互将降低模拟的精度。其中,在三次交互项中,X1X22对模拟精度的影响程度最大,且与模拟精度呈正相关,表明邻域周长越大,越有利于提升模拟的精度。四次项X1X22对模拟精度的影响程度仅次于X1X22,与模拟精度呈负相关,说明邻域元胞面积越大,模拟结果精度越低。这提示我们在选择空间尺度参数组合时,需要综合考虑邻域周长与邻域元胞面积的相对关系,寻求一个最优空间尺度组合,才能真正提高模拟结果的可靠性。
4.2.3 土地利用变化精细化模拟的最优空间尺度计算结果
根据回归方程和方差分析的结果,分别按照Moore和Von两种邻域类型,利用等值线图来描述不同空间尺度组合下模拟精度的分布情况(图5)。其中,响应值Y越大,代表精度越高,其数值大小可以通过颜色的差异来直观表示:蓝色向红色过渡,代表模拟精度逐渐增大。
图5
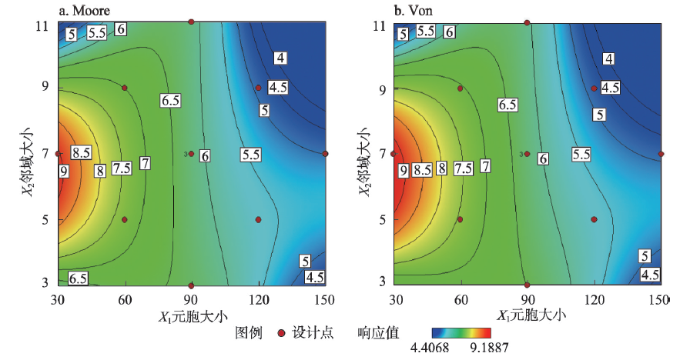
图5
Moore和Von邻域类型下不同元胞大小和邻域大小对应的模拟精度等值线图
Fig. 5
Contour plots of simulation accuracy for different cell sizes and neighborhood sizes in Moore and Von neighborhood types
从图5a和图5b中等值线走向趋势及一致性可以看出,Von和Moore邻域类型对模拟精度的影响差异不大。元胞大小为30~90 m、邻域大小为3~9的覆盖范围内,两种邻域类型下的等值线均呈现向高值区收敛的状态,而超出这个范围的尺度组合则向低值区过渡,说明精细化模拟存在一个明显的空间尺度界限[44],超出这个界限,模拟将失去意义。两幅图中模拟精度较好的区域均集中在元胞大小为30~60 m、邻域大小为3~9的组合附近,预示着最优空间尺度组合很可能存在于这个空间范围内。值得注意的是,Von邻域类型比Moore邻域类型红色覆盖的范围大,这说明在元胞大小和邻域大小相同的情况下,Von邻域类型相对Moore邻域类型在最优空间尺度参数组合寻优中更有优势。基于上述分析,以响应值Y最大为优化目标对式(7)进行求解,得到最优空间尺度组合为:元胞大小30 m、邻域大小7×7,邻域类型Von,此时模拟精度达到最高,响应值为9.1887。
4.3 最优空间尺度下的土地利用变化精细化模拟结果
4.3.1 精细化模拟结果的精度验证
在土地利用变化精细化模拟最优空间尺度率定的基础上,以2015年精细化土地利用数据为基期数据,结合2010—2015年土地利用面积转移矩阵与适宜性图集,利用CA-Markov模型得到2020年武汉市中心城区精细化土地利用模拟结果,并同2020年武汉市中心城区精细化土地利用分类结果进行对比。
从图6可以看出,模拟结果与分类结果整体空间布局较为接近。其中,研究区中部的用地类型空间分布表现出较高的准确性,而研究区四周都市发展区域的用地类型多涉及建设用地和非建设用地的交织分布,各类型用地的转换不可避免会受到当地政策的影响从而产生不确定性,因此模拟结果差异相对较大。
图6
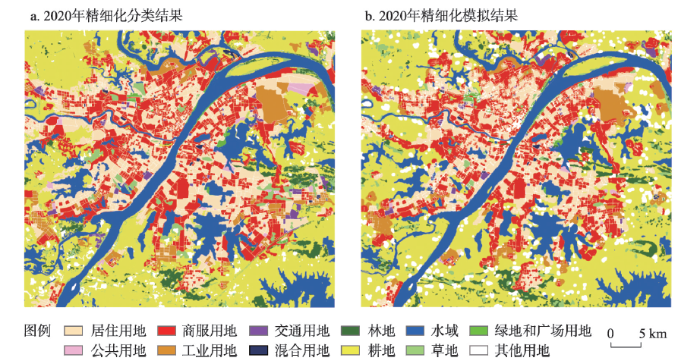
图6
2020年武汉市中心城区分类与模拟的精细化土地利用对比图
Fig. 6
Comparison of classified and simulated refined land use of Wuhan core urban area in 2020
为了从定量的角度说明模拟结果的准确程度,首先,在ArcGIS 10.4中将模拟结果与分类结果进行叠加,统计并计算出用地类型存在差异的区域所占比例为26.24%,说明二者之间具有较高的吻合度。进而采用标准Kappa、随机Kappa、位置Kappa与分区Kappa,从模拟结果的整体性、随机采样和空间位置一致性等多个角度开展精度验证。利用IDRISI软件的VALIDATE工具,将2020年土地利用分类结果和模拟结果进行交叉验证,计算标准Kappa、随机Kappa、位置Kappa与分区Kappa的数值分别为0.677、0.717、0.742和0.742,如表6所示。说明在最优空间尺度组合下,土地利用精细化模拟结果不仅整体精度较高,而且与分类结果具有较高的数量一致性与位置一致性,表明基于最优空间尺度开展的土地利用变化精细化模拟是可靠的。
表6 精度验证采用的4种Kappa系数
Tab. 6
| 参数 | 随机Kappa系数 | 位置Kappa系数 | 分区Kappa系数 | 标准Kappa系数 |
|---|---|---|---|---|
| 数值 | 0.717 | 0.742 | 0.742 | 0.677 |
4.3.2 2025年土地利用精细化模拟结果及分析
图7
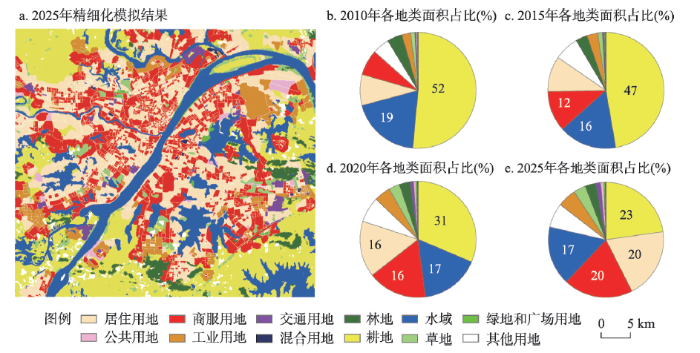
图7
2025年武汉市中心城区土地利用精细化模拟结果及2010—2025年各地类面积占比
Fig. 7
The refined simulation results of land use for Wuhan core urban area in 2025 and its proportion of land use area in 2010, 2015, 2020, and 2025
由图7a可以看出,2025年武汉市中心城区土地利用格局整体表现为更加破碎化、零散化的形态,各类型用地之间互为交织,具有显著的空间分布不均匀性特点。其中,以居住用地和商服用地等为代表的建设用地,将继续由中心向外围扩张,而耕地、草地和林地等在研究区中心分布极少。结合2010—2025年各类型用地的面积占比(图7b~7e)及变化情况来看,研究区15年期间用地类型均以耕地、水域、商服用地和居住用地为主。其中耕地持续减少,其面积占比由52%减少为23%,但依然是2025年第一大用地类型;居住用地和商服用地持续增加,到2025年其用地面积占比均约为20%,超过了水域面积占比17%,二者表现出均衡增长的特征;水域呈现先减小而后维持不变的趋势。
为进一步分析2025年武汉市中心城区土地利用格局的变化,计算2020—2025年各土地利用类型的面积变化及占比,结果如表7所示。相比于2020年,2025年的居住用地、公共用地、商服用地、工业用地和交通用地等5类城市核心功能建设用地面积占比均呈增长趋势。其中居住用地的面积增长99.41 km2,其增长占比最大,将成为2025年武汉市中心城区第二大用地类型;其次是商服用地,面积增加70.80 km2,占比涨幅位于第二位;城市建设用地中混合用地、绿地和广场用地虽有减少趋势,但相对较少,整体面积基本与2020年保持不变。上述现象表明武汉市中心城区的发展是以居住用地和商服用地的快速扩张为主要特征,公共用地、工业用地和交通用地等作为城市中占比较少的用地类型通常伴随居住和商服用地配套建设,增加幅度较小,这符合大中型城市经济发展及建设用地规模扩张的规律。在非建设用地中,耕地面积减少204.64 km2,减少幅度最大。结合图6a和图7a中耕地的空间分布位置可知,减少的耕地主要集中在中心城区与远城区交界的都市发展区地带;其他用地减少幅度相对较小,草地、林地、水域面积基本与2020年保持不变。因此,整体来看,未来武汉市中心城区建设用地范围将继续扩大,其土地利用格局变化主要表现为耕地和其他用地向建设用地中核心功能用地类型的转化。
表7 2020—2025年武汉市中心城区土地利用格局变化
Tab. 7
| 类型 | 2020年 | 2025年 | 2020—2025年变化 | |||||
|---|---|---|---|---|---|---|---|---|
| 面积(km2) | 占比(%) | 面积(km2) | 占比(%) | 面积(km2) | 占比(%) | |||
| 居住 | 369.10 | 15.62 | 468.50 | 19.83 | 99.41 | 4.21 | ||
| 公共 | 16.74 | 0.71 | 22.22 | 0.94 | 5.48 | 0.23 | ||
| 商服 | 389.94 | 16.51 | 460.74 | 19.50 | 70.80 | 3.00 | ||
| 工业 | 107.28 | 4.54 | 124.09 | 5.25 | 16.81 | 0.71 | ||
| 交通 | 22.06 | 0.93 | 32.62 | 1.38 | 10.56 | 0.45 | ||
| 绿地 | 9.20 | 0.39 | 8.85 | 0.37 | -0.35 | -0.01 | ||
| 混合 | 4.03 | 0.17 | 3.87 | 0.16 | -0.15 | -0.01 | ||
| 耕地 | 741.76 | 31.40 | 537.12 | 22.73 | -204.64 | -8.66 | ||
| 林地 | 71.13 | 3.01 | 69.71 | 2.95 | -1.42 | -0.06 | ||
| 草地 | 72.50 | 3.07 | 81.69 | 3.46 | 9.19 | 0.39 | ||
| 水域 | 390.63 | 16.53 | 390.68 | 16.54 | 0.05 | 0.00 | ||
| 其他 | 168.18 | 7.12 | 162.44 | 6.88 | -5.74 | -0.24 | ||
5 结论与讨论
5.1 结论
(1)与传统基于遥感影像的土地信息解译方法相比,联合遥感和POI数据的城市土地利用精细化分类在深度解析城市内部土地利用变化方面具有显著的优势。遥感影像土地利用解译方法,偏重于自然要素,类型划分宏观且简单;联合遥感和POI数据开展城市土地利用精细化识别的优点在于以城市街区为分类单元,同时考虑区域宏观土地利用特征和城市内部街区尺度上土地利用的社会功能,能够较好地反映出城市各土地利用类型之间的微观变化及潜在发展问题,因此可以为城市土地利用精细化模拟研究提供良好的基础。
(2)本文利用OA、Kappa系数、FOM指数和CONTAG指数提出的精度评价耦合指标,综合考虑了误差统计属性大小及空间分布,能够更加全面客观的描述模拟结果的效果和准确性。基于响应面法的最优尺度率定方法可以有效区分空间尺度效应影响因素对模拟精度的影响大小和正负效应,得到的武汉市中心城区土地利用元胞自动机精细化模拟最优空间尺度组合为30 m元胞、7×7邻域以及冯诺依曼邻域类型。最优空间尺度组合下2020年武汉市中心城区土地利用精细化模拟结果精度验证显示:标准Kappa、随机Kappa、位置Kappa与分区Kappa的数值分别为0.677、0.717、0.742和0.742,整体精度较高,表明空间尺度效应得到了有效控制。
(3)基于最优空间尺度对未来武汉市中心城区土地利用变化精细化模拟的研究结果表明:预计到2025年,武汉市中心城区居住用地、公共用地、商服用地、工业用地和交通用地面积将继续增加,耕地面积减少最多,其他用地面积减少幅度较小,混合用地、绿地和广场用地、草地、林地和水域面积基本与2020年保持不变。各类型用地之间互为交织,土地利用空间格局将呈更加破碎化趋势。
5.2 讨论与展望
城市快速发展对土地的集约利用提出了新的挑战,识别城市土地利用的精细化特征,并准确预测未来城市土地格局及发生的变化,已经成为政府开展土地利用规划、土地整治和生态保护等一系列城市综合治理工作的迫切需要。本文从研究城市土地利用精细化特征及变化规律的角度出发,以武汉市中心城区作为研究案例,开展城市土地利用精细化用地功能识别及模拟,并对模拟过程中的空间尺度效应来源及作用机理进行深入的剖析和挖掘,有效控制了精细化模拟过程中的空间尺度效应,避免了模拟误差的累计和传播,从而提高了城市土地利用变化精细化模拟的可靠性。本文所提出的城市土地利用精细化识别、基于响应面法的最优空间尺度率定和城市土地利用变化精细化模拟等方法,为当前和未来城市土地利用及变化模拟相关研究提供了一种新型的认知思路,有助于深层次的解析城市发展过程中土地利用演变规律。
当然,城市土地利用变化精细化模拟研究工作还存在一些值得继续探索的方向。① 本文在城市土地利用精细化功能识别中,联合运用遥感和POI数据,既提取了城市土地自然覆被信息,也实现了城市功能区的细分与表达。随着越来越多的众源地理信息数据涌入到公众视野中,如手机信令、车辆轨迹、社交媒介、公交刷卡数据等,可以将其与城市地区土地变更调查数据进行融合分析,开展土地利用精细化分类,提升结果的可靠性和动态性。② 对于精细化模拟过程中空间尺度效应的控制研究,本文主要从多源数据的应用和元胞自动机模型的尺度不确定性两个角度进行了深入分析,将来可以考虑从本文采用的Markov扩展到集成学习[45]、深度学习[46]、群集智能算法[11]等新型元胞自动机模型转换规则挖掘方法,更加深入理解元胞自动机模型不确定性的来源及影响程度,进一步提高精细化模拟结果的准确性。③ 如何利用精细化的土地利用数据,服务于城市国土空间治理与国土空间规划,也是本文进一步深化研究的方向。
参考文献
The characteristics and patterns of spatially aggregated elements in urban areas of Wuhan
DOI:10.11821/dlxb201708008
[本文引用: 3]

Different urban elements may exhibit various aggregation patterns. It is of great significance to quantitatively investigate the disparity and connection among various aggregation patterns of urban elements for understanding the mechanism of urban development and supporting urban planning. Taking Wuhan city, Central China, as a case, we collected five types of urban elements, namely, impervious surface, population density, Point of Interest (POI), plot ratio, and road network, to explore their spatial distribution and characteristics of aggregation patterns. We first used Kernel Density Estimation (KDE) method to identify city centers and we found that there is one major center and seven sub-centers in Wuhan. Then we partitioned the study area by gradient analysis, and calculated the densities of urban elements. The density of urban element decreases outward from the centers, which is fitted well using "Inverse S-shaped" function. We used Concentration Degree Index (CDI) to reflect the aggregation degree of urban elements. The results indicate that the degrees of the aggregation of urban elements are: Commercial POI > population > plot ratio > road. Commercial POI and population are highly aggregated in the urban core area, while plot ratio and road are moderately aggregated in the urban core area. The spatial patterns of highly aggregated commercial POI and population are the combination of point pattern and zonal pattern, while the spatial patterns of moderately aggregated road network and plot ratio are the combination of point pattern, ring pattern and axial pattern. As for the lowly aggregated impervious surface, it shows a ring pattern. The attraction effect of city centers and vertical development promote the center-oriented agglomeration of urban elements. At the same time, the transportation lines and corridor effects of the scarce landscape resources reshape the spatial distribution pattern of urban elements.
武汉市城市空间集聚要素的分布特征与模式
DOI:10.11821/dlxb201708008
[本文引用: 3]
不同城市要素的集聚现象具有不同的空间模式,定量化研究城市要素集聚模式的差异和联系对于理解城市发展机理、合理制定城市规划具有重要意义。本文以武汉市为例,获取不透水表面、商业服务业网点(POI)、人口、容积率、城市道路等城市要素数据;采用核密度估计法识别城市主次中心,从城市要素的分布形态、集聚程度、集聚模式等来研究城市要素的空间分布格局特征。研究发现,武汉市呈现“一主七副”的多中心结构,各城市要素从城市中心向外呈反S型的圈层递减。采用集聚度指数衡量城市要素的集聚水平,结果显示商业POI、人口密度的集聚程度最大,其次是容积率、道路密度、不透水表面占比。高度集聚的商业POI、人口密度呈现出点状模式与带状模式相结合的分布模式,中度集聚的道路密度、容积率呈现点状模式、环状模式与轴状模式相结合的分布模式,低度集聚的不透水表面密度主要表现为环状模式。城市中心的吸引、立体空间开发等促进了城市要素的向心集聚,交通干线、稀缺景观资源的廊道效应等重塑了城市要素的空间分布形态。
Analysis on spatial and temporal changes of regional habitat quality based on the spatial pattern reconstruction of land use
DOI:10.11821/dlxb202001012
[本文引用: 1]
Habitat quality determines the status of regional biodiversity which is an important reflection of ecosystem service function and health. Research on the habitat quality change is of great significance for regional ecological security. The reconstruction of regional spatial pattern of habitat quality can restore the background of ecological environment in historical periods and provide scientific support for revealing the evolution law of regional ecological environment quality. This study selected ten driving factors (elevation, slope, aspect, GDP, population, temperature, rainfall, river distance, urban distance and coastline distance) to build CA-Markov model parameters and simulate the historical land use data. The spatial pattern of habitat quality was rebuilt by InVEST model, and the classification and statistics of habitat degradation and habitat quality were examined. The results showed that: (1) The Kappa coefficient is 0.88, which proves that the land use spatial pattern reconstruction method is feasible. On this basis, the simulation of habitat quality is valid. (2) During 1975-2010, the degree of habitat degradation increased gradually and the spatial distribution of it showed a regular pattern of circle layer change. The habitat quality decreased steadily. The high-value areas were mainly distributed in mountainous areas, while the low-value areas were mostly distributed across built-up areas. In this period, the low-value areas gradually engulfed the high-value areas around, and the habitats of the high-value areas tended to be fragmented. (3) In 1975-2010, the spatio-temporal variations of habitat quality indicated that the region with the worst habitat quality were difficult to recover; the regions with the poor habitat quality accounted for 6.40% of the total area, which were prone to deteriorate and occur around the built-up areas; the areas with the best or better habitat quality grades accounted for 5.68% of the total area, which could be easily transformed into the poor and worst habitat grades, making the habitat more scattered. (4) There was a marked change with land use of study areas during 1975-2010, which had a huge impact on the quality of the habitat. The above results show that the habitat quality of the study area decreases gradually. More than 60% of the regions have poor or even worst habitat quality. Construction land is the biggest factor threatening the habitat quality.
基于土地利用格局重建的区域生境质量时空变化分析
DOI:10.11821/dlxb202001012
[本文引用: 1]
区域生境质量决定了区域内生物多样性状况,是生态系统服务功能和生态系统健康程度的重要体现,生境质量变化研究对区域生态安全具有重要的意义,重建区域生境质量空间格局可以还原历史时期的生态环境本底,为揭示区域生态环境质量演变规律提供科学支撑。选取高程、坡度、坡向、GDP、人口、温度、降雨量、河流距离、城市距离和海岸线距离10个土地利用变化驱动因子,构建CA-Markov模型参数,模拟得到历史土地利用空间数据。在此基础上,运用InVEST模型重建泛长三角地区生境质量空间格局,并对计算得到的生境退化度指数和生境质量指数进行等级划分与统计分析。结果表明:① 土地利用模拟精度验证结果显示Kappa系数为0.88,土地利用空间格局重建方法可行,可以在此基础上开展生境质量模拟研究。② 泛长三角地区1975—2010年生境退化度逐期上升,生境退化等级在空间分布上呈圈层递变分布规律。生境质量则表现为逐期下降,高值区主要分布于山区,低值区大部分位于建成区;1975—2010年期间,低值区逐渐向周边高值区域演变,生境高值区域趋于破碎化。③ 1975—2010年生境质量时空变化特征表明:生境质量差等级区域,其生境难以修复,维持原状居多;生境质量较差等级区域易继续恶化,且易发生在建成区周边区域,占比为研究区总面积的6.40%;生境等级为良好和优等的区域,其生境等级易转换为差等和较差等级,使得该区域的生境破碎化,该类型的面积占比为研究区总面积的5.68%。④ 1975—2010年期间,研究区土地利用变化显著,对生境质量造成了巨大的影响;研究区生境质量逐期变差,其生境质量等级位于较差及以下区域面积占比均达到了60%以上,建设用地为生境质量最大的威胁因子。
LUCC simulation based on the cellular automata simulation: A case study of Dalian Economic and Technological Development Zone
DOI:10.11821/dlxb201503009
[本文引用: 2]
China has been experiencing the exceptionally drastic land-use/cover changes (LUCC) in the last decades. Many techniques focused on the simulation of the single type of land-use change. However, simulating changes between different types of land-use is much more difficult than simulating change for a single type of land-use. The key to simulations based on the Cellular Automata (CA) model is how to define the transition rules. This paper built a localized land-use competition CA model to examine land-use change rules for several land-use candidates under different localized land-use patterns. By this method, the potential transformation amount of each land-use type was calculated and an optimum transition rule was used to balance the amount of land-use changes of complicated types during the simulation period. The total area of each land-use type was predicted by Markov analysis as the global variable during the whole simulation period. This CA-Markov method was adopted to simulate LUCC in Dalian Economic and Technological Development Zone in 1998 and 2009, followed by a comparative experiment. The results show that: (1) The established test method is feasible for exploring the interaction between various land-use classes; (2) This model had high simulation precision, and the Kappa coefficients in urban area, agricultural area and undeveloped area were 0.762, 0.634 and 0.678, respectively; (3) The model proposed in this paper shows a symbolic way to studying the conversion among different land-use types, which could be used to improve the interactive relationship of LUCC.
基于元胞自动机模型的土地利用变化模拟: 以大连经济技术开发区为例
DOI:10.11821/dlxb201503009
[本文引用: 2]
元胞自动机模型已经成为模拟土地利用变化的重要方法。传统土地模拟方法中侧重于通过分析影响土地利用变化的因素来构建预测模型,较少从土地利用类型变化及其相互作用的空间角度来关注模型构建。本文以1998年、2004年和2009年1:10000土地利用数据,利用Python语言结合GDAL与Numpy类库实现局部土地利用竞争的元胞自动机模型原型开发,并用于模拟大连市经济技术开发区1998-2009年土地利用变化模拟。研究结果:① 建立了发掘多地类之间相互作用关系的试验方法,研究适用于具有明确物理意义的多地类元胞自动机模拟模型;② 该模型具有好的模拟精度,对建设用地、农用地和林地等3种不同类型用地进行同时模拟,其对应Kappa系数分别为0.762,0.634和0.678;③ 该模型建立了研究不同种地类协调作用的基本方法,可以用于进一步研究土地利用变化地类之间驱动原理。
Land-use simulation and decision-support system (LandSDS): Seamlessly integrating system dynamics, agent-based model, and cellular automata
Agent-based model of residential location
DOI:10.11821/xb201006007
[本文引用: 1]
Multi-agent system (MAS) is a powerful tool capable of analyzing and simulating complex systems, and has been extensively applied in the regime of social sciences. In this paper we present an agent-based model of residential location (ABMRL) and apply this model to study the dynamic changes of residential location and land price, aiming to explore and simulate the complicated spatial decision-making behaviors in residential location as well as the evolution process of urban residential segregation, which is resulted from interactions among residents and between residents and geographical environment. The ABMRL model consists of agent layer representing various classes of residents and cell automata layer representing geographical environment, which correspond to the two basic elements in man-earth relationship, i.e., human being and natural environment. In this model, psychological concepts were introduced for study of the behaviors of residential location, as it is generally considered that residential relocation is facilitated by internal social and economic pressure and external residential environment. ABMRL model was used to simulate and validate a series of classic urban theories such as residential segregation, concentric urban space structure, gentrification, etc., and to simulate the evolution of residential segregation and dynamic changes in land price in Haizhu District of Guangzhou City, which was taken as a test example for the study.
基于多智能体的居住区位空间选择模型
Integration of logistic regression, Markov chain and cellular automata models to simulate urban expansion
DOI:10.1016/j.jag.2011.12.014 URL [本文引用: 1]
Multi- agent systems for simulating and planning land use development
基于多智能体的土地利用模拟与规划模型
Model construction of urban agglomeration expansion simulation considering urban flow and hierarchical characteristics
DOI:10.11821/dlxb202112010
[本文引用: 1]
Since the launch of China's reform and opening up policy, the process of urbanization in China has been accelerated. With the development of cities, inter-city interactions have become increasingly close, and urban agglomerations tend to be integrated. Urban agglomerations are regional spaces with network relationships and hierarchies, and have always been the main units for China to promote urbanization and coordinated regional development. In this paper, we comprehensively consider the network and hierarchical characteristics of an urban agglomeration, while using urban flow to describe the interactions of the inter-city networks and the hierarchical generalized linear model (HGLM) to reveal the hierarchical driving mechanism of the urban agglomeration. By coupling the HGLM with a cellular automata (CA) model, we introduce the HGLM-CA model for the simulation of the spatial expansion of an urban agglomeration, and compare the simulation results with those of the logistic-CA model and the biogeography-based optimization CA (BBO-CA) model. According to the results, we further analyze the advantages and disadvantages of the proposed HGLM-CA model. We selected the middle reaches of the Yangtze River in China as the research area to conduct this empirical research, and simulated the spatial expansion of the urban agglomeration in 2017 on the basis of urban land-use data from 2007 and 2012. The results indicate that the spatial expansion of the urban agglomeration can be attributed to various driving factors. As a driving factor at the urban level, urban flow promotes the evolution of land use in the urban agglomeration, and also plays an important role in regulating cell-level factors, therefore, the cell-level factors of different cities show different driving effects. The HGLM-CA model can obtain a higher simulation accuracy than the logistic-CA model, which indicates that the simulation results for urban agglomeration expansion considering urban flow and hierarchical characteristics are more accurate. Compared with the intelligent algorithm model, i.e., BBO-CA, the HGLM-CA model obtains a lower simulation accuracy, but it can analyze the interaction of the various driving factors from a hierarchical perspective. It also has a strong explanatory effect for the spatial expansion mechanism of urban agglomerations.
基于城市流和层级性的城市群扩展模型构建
DOI:10.11821/dlxb202112010
[本文引用: 1]
城市群是具有网络关系与层级性的区域空间,一直是中国推进城镇化与区域协调发展的主体单元。本文综合考虑城市群的网络与层级性特征,运用城市流刻画城际网络交互作用,采用分层广义线性模型(HGLM)揭示城市群分层驱动机制。同时,选取长江中游城市群开展实证研究,通过与元胞自动机(CA)耦合,构建HGLM-CA模型模拟城市群空间扩展。将模拟结果与Logistic-CA模型、BBO-CA模型进行比对,据此评析HGLM-CA模型的优劣与改进方向。实证结果表明:城市群空间扩展是多层驱动因素共同作用的结果,城市流不仅会推动城市群空间扩展,而且对元胞层因素起到重要的调节作用,使之具有城际分异性;HGLM-CA模型相比Logistic-CA模型模拟精度更高,说明顾及城市流与层级性的城市群空间扩展模拟结果更为精准;与智能模型BBO-CA相比,HGLM-CA模型模拟精度较低,但其便于从层级性角度把握城市群空间扩展机制。
Synchronized simulation of urban diffusional and aggregational process based on the affinity propagation cellular automata: A case study of Wuhan city
DOI:10.11821/dlxb202110013
[本文引用: 1]
Cellular automata (CA) has been widely recognized as an effective approach in the simulation of spatiotemporal dynamics of metropolitan areas, particularly for infilling and edge urban expansion processes. However, the traditional Logistics-CA has its severe drawbacks in simulating outlying expansion, since it evolves primarily according to the status of a set of neighboring cells, failing to identify other potential seeds that could also stimulate urban expansion in a significant way. This paper develops an advanced CA, called APCA, by using Affinity Propagation (AP) to comprehensively search for urban expansion seed points, as well as by realizing a synchronous simulation of diffusional and aggregational processes of urban cell. This paper uses the data of Wuhan, the largest provincial capital in central China, to validate the effectiveness of APCA. By simulating Wuhan's urban expansion dynamics between 1995 and 2025, the APCA (1) identifies that the total areas of outlying expansion amount to 8.67 km2, accounting for 6.30% of added urban land of the city; and (2) successfully simulates a process of "first diffusion and then aggregation" in Wuhan, which is in harmony with the Phase Theory of urban expansion. Compared with the traditional Logistics-CA, the overall accuracy of APCA remains higher regardless of the number of seed points as long as they are within 1-8, while the accuracy of APCA reaches its highest (0.5217) when the seed point is set as 6. The APCA contributes to the two-dimensional CA framework by expanding surface-dimension simulation to point-dimension simulation, and thereby facilitates effective and accurate simulations of urban expansion patterns.
基于近邻传播聚类元胞自动机模型的武汉城市扩散和聚合过程同步模拟
DOI:10.11821/dlxb202110013
[本文引用: 1]
元胞自动机(CA)作为城市时空动态模拟应用最广泛的模型,可以有效模拟填充式和边缘式城市扩张过程,但是在飞地式扩张模拟方面稍显不足。本文提出一种改进CA模型—APCA,在传统CA基础上利用近邻传播聚类(AP)搜寻城市扩散增长的“种子点”,实现城市增长扩散过程和聚合过程的同步模拟。以武汉市为研究区域,使用APCA模拟其在2005—2025年间城市扩张的时空过程。结果显示:① APCA在设置“种子点”数量为1~8个时模拟总体精度均高于Logistics-CA,当“种子点”数量为6时,模拟新增部分精度最高,达到0.5217;② 2015—2025年武汉市飞地型增长面积约为8.67 km<sup>2</sup>,占新增城市用地总面积比例为6.30%;③ 武汉市1995—2025年间“先扩散后聚合”的城市扩张过程符合城市增长相位理论。APCA在一定程度上了完善了传统二维平面CA框架,将城市扩张模拟维度由面维扩展到点维,为准确展现城市用地空间扩展规律提供参考。
Theoretical and methodological perspectives of fine scale urban expansion cellular automata for the large regions
大尺度和精细化城市扩展CA的理论与方法探讨
Modeling dynamic urban growth using cellular automata and particle swarm optimization rules
DOI:10.1016/j.landurbplan.2011.04.004 URL [本文引用: 2]
Land use change simulation model based on MCDM and CA and its application
DOI:10.11821/xb200802006
[本文引用: 1]
<p>A macro-micro integrated land use change model, Grey-Cellular automata (CA) -Multi-Criterion Decision-Making (MCDM)-Geographic Information System (GIS) based model (GCMG for short) which can simulate human decision making process was proposed. The GCMG model borrows the theoretical hypothesis of CLUE-S model which supposes that regional land use change is driven by its land use requirement and the land use distribution is in dynamic balance with land use demands and regional natural resources and socio-economic conditions. The GCMG model consists of both non-spatial and spatial part. The non-spatial part, so called macro model, calculates the changes of land use demand in the future based on experiential relationship of land use and its dominating drivers using the grey model. The spatial part, also called micro model, completes the land use allocation process whose total quantity is calculated by the non-spatial part with a combined method of MCDM, GIS and CA model. In the spatial part, firstly MCDM method was used to simulate the human decision making process for land use change considering socio-economic and bio-physical conditions; the results of which was brought into conversion rule of CA model; and the integration was finally implemented in GIS to model the land use allocation. To illustrate the functioning of GCMG model and its validation, it is applied in Longhai County to simulate land use change in 2010. As one of the typical counties at coastal area of Fujian Province, great changes in land use have taken place in Longhai County over the past decades, including the garden plots expansion, town land for urban and rural housing, and land for industrial and mining purpose. Firstly the GCMG simulation results are compared with map of the actual distribution of land use in 2000 for validation. The Kappa equals to 0.93 in the simulation at 10 m×10 m grid level and has gained satisfactory results. Then the validated model is applied to simulate the land use conversion probabilities under different decision-making scenarios. The results show that the basic farmland protection policy will determine the future land use change pattern. The application of GCMG model indicated that it can both simulate the land use demand at macro level and land suitability at micro level, thus possessing the ability of studying the multi-level land use system.</p>
基于多目标决策和CA模型的土地利用变化预测模型及其应用
Modeling of multilevel vector cellular automata and its simulation of land use change
DOI:10.11821/dlxb202010009
[本文引用: 1]
Urban planning plays an important guiding role in land use change. The planning at all levels supports and complements each other, and influences the evolution of land-use pattern from top to bottom. Vector cellular automata, which takes irregular geographical entities as its basic units, can express the objective and complicated urban land use structure in a more realistic way, and has become one of the focus in the land use change research. However, when we face urban planning with the characteristics of hierarchical synergy, spatial guidance and controlled conductivity, some key issues are highlighted, such as the establishment of CA hierarchical system, the construction of hierarchical synergy and the acquisition of transition rules. After constructing the multilevel vector CA model, we chose Jiangyin City as the study area and its land use data covering the years 2007, 2012 and 2017 as the basic data to simulate the land use changes from 2012 to 2017. On the basis of multilevel vector cellular automata model, through the comparative analysis between the simulation results and the current situation of land use in 2017, the individual parameters of the model were modified to further improve the feasibility and applicability of the model, and then the urban land use pattern in 2022 was predicted. The simulation results indicated that the development of construction land in Central District has become saturated, while the expansions of construction land in Chengnan District, Chengdongnan District and Chengdong District were obvious. From an overall perspective, there was a tendency to gradually form a three-level urban-rural spatial settlement system "central city area-urban agglomeration-village". Using FoM index, we concluded that the simulation results had great simulation precision and the model had high feasibility and applicability, because the FoM values of the whole city and each district were almost greater than or close to 0.21. This shows that the simulation results are more accurate and the model is more effective in the simulation of land use change based on urban planning.
多层次矢量元胞自动机建模及土地利用变化模拟
DOI:10.11821/dlxb202010009
[本文引用: 1]
城市规划对土地利用变化起着重要的引导作用,各层次规划相互支撑、互为补充,自上而下影响着土地利用格局的演变。矢量元胞自动机以不规则的地理实体作为基本单元,可以更逼真地表达客观复杂的城市用地空间结构。然而,当面向具有层次协同性、空间引导性和管控传导性等特征的城市规划时,其元胞多层次体系构造、层次间协同方法和转换规则获取等关键问题凸显出来。本文以江阴市2007年、2012年、2017年3期土地利用现状数据为基础,在多层次矢量元胞自动机建模基础上,模拟了2017年土地利用变化,通过模拟结果与用地现状对比分析,对模型个别参数进行了修正,进一步提高了模型的可行性与适用性,进而预测了2022年城市土地利用格局。模拟结果显示,中心城片区建设用地发展已经趋于饱和,澄南、澄东南和澄东片区建设用地扩张较为明显,有逐步形成“中心城区—城镇组团—村庄”三级城乡空间聚落体系的趋势。最后利用FoM指标对模拟结果进行了评价,得到整体和各片区的精度基本都大于或接近于0.21,表明模拟结果精度较高,其构建的模型在面向多层次规划的用地变化模拟方面具有更好的效果。
Scenario simulation and landscape pattern dynamic changes of land use in the poverty belt around Beijing and Tianjin: A case study of Zhangjiakou city, Hebei province
DOI:10.1007/s11442-016-1268-1 URL [本文引用: 1]
Integrating OpenStreetMap crowdsourced data and Landsat time series imagery for rapid land use/land cover (LULC) mapping: Case study of the Laguna de Bay area of the Philippines
DOI:10.1016/j.apgeog.2015.12.006 URL [本文引用: 1]
Remote sensing-based analysis of the spatiotemporal characteristics of built-up area across China based on the plan for major function-oriented zones
基于主体功能区规划的中国城乡建设用地扩张时空特征遥感分析
Land use driving forces and its future scenario simulation in the Three Gorges Reservoir area using CLUE-S model
DOI:10.11821/dlxb201611009
[本文引用: 1]
Model simulation and scenarios change analysis are the core contents of the future land use change study. In this paper, land use status data of the Three Gorge Reservoir Area (TGRA) in 1990 were used as base data. The relationship between driving factors and land use was analyzed by using binary logistic stepwise regression analysis, based on which land use in 2010 was simulated by CLUE-S model. After the inspection and determination of main parameters impacting driving factors of land use in the TGRA, land use of the TGRA in 2030 was simulated based on four scenarios, including natural growth, food security, emigrant construction and ecological protection. The results were shown as follows: (1) The areas under ROC curves of land use types were both greater than 0.8 under the analysis and inspection of binary logistic model. These land use types include paddy field, dry land, forestland, grassland, construction land and water area. Therefore, it has a strong interpretation ability of driving factors on land use, which can be used in the estimation of land use probability distribution. (2) The Kappa coefficients, verified from the result of land use simulation in 2010, were showed of paddy field 0.9, dry land 0.95, forestland 0.97, grassland 0.84, construction land 0.85 and water area 0.77. So the results of simulation could meet the needs of future simulation and prediction. (3) The results of multi-scenarios simulation show a spatial competition relationship between different land use types, and an influence on food security, emigrant construction and ecological protection in the TGRA, including some land use change such as the large-scale conversion from paddy field to dry land, the occupation of cultivated land, rapid expansion of construction land from forestland and grassland, the reclamation of cultivated land to forestland and grassland, the conversion of forestland and grassland to cultivated land. Therefore, it is necessary to balance the needs of various aspects in land use optimization, so as to achieve the coordination between social economy and ecological environment.
多因素耦合下三峡库区土地利用未来情景模拟
DOI:10.11821/dlxb201611009
[本文引用: 1]
模型模拟和情景变化分析是未来土地利用变化研究的核心内容,本文以2000年三峡库区土地利用现状为基期数据,利用Binary Logistic模型回归分析驱动因子与土地利用间的关系,利用CLUE-S模型对2010年土地利用进行模拟,校验并确定影响库区土地利用驱动因素的主要参数后,基于自然增长、粮食安全、移民建设和生态保护对2020年、2030年库区土地利用情景予以模拟。结果表明:① 通过Binary Logistic模型分析和检验,水田、旱地、林地、草地、建设用地和水域的ROC曲线下面积值均大于0.8,表明所选驱动因子对土地利用的解释能力较强,可用来估算土地利用概率分布;② 2010年各地类模拟结果经验证得Kappa系数分别为水田0.9、旱地0.92、林地0.97、草地0.84、建设用地0.85和水域0.77,总体上能满足模拟与预测需求;③ 多情景模拟显示库区不同土地利用类型在空间上的竞争关系,以及所带来的对库区粮食安全、移民建设、生态保护的影响,包括水田大量转换为旱地(“水改旱”)、耕地与林草地被建设占用、林草地开垦为耕地、陡坡耕地退为林草地等行为,需要在土地利用优化中平衡各方面的需求;④ 多因素、多情景模拟能为库区土地利用提供更为清晰的、可供抉择的政策调控思路。
Identifying core driving factors of urban land use change from global land cover products and POI data using the random forest method
Mining point-of-interest data from social networks for urban land use classification and disaggregation
DOI:10.1016/j.compenvurbsys.2014.12.001 URL [本文引用: 1]
Extracting hierarchical landmarks from urban POI data
利用城市POI数据提取分层地标
Spatial distribution and interaction analysis of urban functional areas based on multi-source data
基于多源数据的城市功能区识别及相互作用分析
Identification and evaluation of urban functional land based on POI data: A case study of five districts in Jinan
DOI:10.3969/j.issn.1004-9479.2020.04.2019186
[本文引用: 2]
Making full use of big data to identify urban land use function can help to grasp the urban spatial structure and promote the rational layout of urban interior space. POI data is a kind of easily available and representative spatial point-like data in the era of big data, which can effectively determine the actual function of urban land. Based on 185,126 POI data in five districts of jinan, this paper deleted duplicates, corrected deviations and reclassified the obtained data, constructed a functional classification system of urban land, and used frequency density, type ratio and kernel density estimation to identify and evaluate the urban land functions in five districts of jinan, and use the error matrix to test the recognition results.The results show that: (1) mixed functional land and single functional land presents the regional distribution characteristics of the circle, the "core-periphery" distinction is obvious; (2) from the inward to the outward, the concentration trend of single functional land is weakened, the diversity of mixed functional land is reduced, and different land shows different spatial distribution patterns; (3) Through the error matrix and the actual land use of the planned land and electronic map in the land use plan, the overall accuracy is 75.67%, and the recognition result is more accurate.
基于POI数据的城市用地功能识别与评价研究: 以济南市内五区为例
DOI:10.3969/j.issn.1004-9479.2020.04.2019186
[本文引用: 2]
充分利用大数据开展城市用地功能识别,有助于把握城市空间结构,推动城市内部空间合理布局。POI数据是大数据时代一种较易获得且极具代表性的空间点状数据,能够有效地确定城市用地的实际功能。以济南市内五区的185126条POI数据为基础,对所得数据进行去重、纠偏、重分类,构建城市用地功能分类体系,运用频数密度、类型比例及核密度估计,识别济南市内五区城市用地功能并利用误差矩阵对识别结果进行检验。结果表明:①混合功能用地与单一功能用地呈现圈层化地域分布特征,“核心-外围”分异明显;②由内向外单一功能用地集聚趋势减弱,混合功能用地多样性降低,不同用地表现出不同的空间分布模式;③通过误差矩阵及与用地规划图中规划用地及电子地图的实际用地对比,识别总体精度为75.67%,识别结果较为准确。
Spatial features of urban vitality and the impact of built environment on them based on multi-source data: A case study of Shenzhen
DOI:10.13284/j.cnki.rddl.003406
[本文引用: 1]
As a key index to evaluate whether a city is attractive or has a healthy, comprehensive, and sustainable development potential, urban vitality is critical to the future development and construction of a city. Exploring the mechanism of how the built environment influences urban vitality from the perspective of urban morphology can be conducive to future urban space planning and design and can provide city planners with quantitative and scientific decision-making support. This study uses urban POI, cellular signaling, and nighttime light remote sensing data from Shenzhen to measure its cultural, social, and economic vitality, which constitutes a comprehensive vitality assessment of the city. Spatial features of these urban vitalities were then analyzed to further illustrate their distribution patterns. Using Bivariate Moran's I method, the spatial autocorrelations between economic, social, and cultural vitality were calculated. From the five dimensions of Density, Design, Diversity, Distance to Transit, and Destination Accessibility, the 5D detection index system was constructed to measure the urban built environment. This study also used GeoDetector to detect and analyze the spatial differentiation between various built environmental factors and comprehensive, economic, social, and cultural vitality and to explore the mechanism of the influence of the built environment on urban vitality. The results show that: 1) The spatial distribution of comprehensive vitality is extremely uneven in Shenzhen, with a higher vitality in the southern and western regions of Shenzhen city and a lower vitality in the northern and eastern regions. Areas with higher comprehensive vitality usually developed along the main roads and metro lines and are distributed in strips along the coastline of central-southern and western Shenzhen. The high-value areas of the urban comprehensive vitality center are primarily concentrated in city- or district-level commercial centers, and employment centers. Comprehensive vitality in Shenzhen reflects social vitality. 2) Urban comprehensive, economic, social, and cultural vitality are significantly affected by the built environment, as indicated by the 5D system. High POI and building density, average building floors, and land use entropy, have significant positive impacts on urban vitality. However, residential population density did not have a significant impact on each aspect of urban vitality. 3) Some interactions between built environment factors had a greater impact on urban comprehensive vitality, such as residential population density, road network density, land use entropy, and road network density. Overall, the interaction between building density, average building floors, land use entropy, and other factors, have a more positive impact on each aspect of urban vitality. 4) The presentation of urban comprehensive vitality is the result of multiple dimensions and factors. In the influencing mechanism of urban comprehensive vitality, building density and average building floors were the fundamental factors. POI density and land use entropy were the direct driving factors. Residential population density was an inducing factor. Distance from the administrative center, intersection density, road network density, metro station density, and bus station density were adjustive factors. The research results therefore provide valuable suggestions for the optimal allocation of resources and the rational layout of urban functional facilities in Shenzhen.
基于多源数据的城市活力空间特征及建成环境对其影响机制研究: 以深圳市为例
DOI:10.13284/j.cnki.rddl.003406
[本文引用: 1]
采用城市POI、手机信令数据及夜间灯光遥感数据,以深圳市为例,构建城市活力度量指标分析城市活力的空间特征。构建“5D”指标体系度量城市建成环境,并运用地理探测器,探究建成环境对城市活力的影响机制。结果表明:1)深圳市城市综合活力显示出“南强北弱,西强东弱”的空间分异特征,空间分布极不均衡。城市综合活力最主要反映的是社会活力。2)城市综合活力、经济活力、社会活力、文化活力均受到建成环境的显著影响。高POI密度、高建筑密度、高平均建筑层数和高土地利用混合度对城市活力具有显著促进作用。3)居住人口密度与路网密度、土地利用混合度与路网密度等交互作用对城市活力产生更为积极的影响。4)在影响机制中,建筑密度、平均建筑层数为底层支撑因素,POI密度、土地利用混合度为直接驱动因素,居住人口密度为诱发因素,距行政区中心距离、交叉口密度、路网密度、地铁站点密度和公交站点密度为调节因素。
Assessment on urban mixed land use and analysis of its influencing factors based on POI data: A case of the main districts of Hangzhou city
基于POI数据的城市土地混合利用评价及影响因素分析: 以杭州市主城区为例
Identifying urban building function by integrating remote sensing imagery and POI data, Hebei Province
DOI:10.1109/JSTARS.2021.3107543 URL [本文引用: 1]
Modeling urban residential land price distribution using multi-source data and ensemble learning: A case of Wuhan city
DOI:10.18306/dlkxjz.2021.10.005
[本文引用: 1]
Characterizing the spatial distribution of urban residential land prices (RLPs) is essential for timely improving urban planning and management, as well as for effectively realizing urban smart growth. However, mapping urban RLPs at a fine scale remains challenging, due to the complex nonlinear relationship between RLPs and their potential determinants. This study developed a grid-level urban RLP mapping method based on big geo-data and ensemble learning technology to meet the needs of rapid and accurate monitoring of urban RLP dynamics. Using ensemble learning technology, combined with predictor variables extracted from points of interest (POIs) and NPP-VIIRS nighttime light images, the fine-scale RLPs in Wuhan City in 2018 were mapped through the following steps. First, the kernel density of POIs and the intensity of nighttime lights were extracted and aggregated at the 500 m×500 m grid level as the predictor variables of RLPs. Second, several RLP prediction models were established using four individual machine learning algorithms (MLAs) and bagging and stacking ensemble methods. Finally, the prediction accuracy or errors of different models were evaluated and compared, and the best performing model was selected to estimate the RLPs of the grids with no observations in Wuhan City. The results show that: 1) Among all the individual MLAs, the support vector regression (SVR) algorithm has the best prediction performance, followed by the k-nearest neighbor algorithm (k-NN), Gaussian process regression (GPR), and back propagation neural network (BP-NN) algorithms. 2) In terms of improving the prediction accuracy of individual MLAs, the performance of the stacking method is better than that of the bagging method. The stacking #1 model that integrates the SVR and k-NN algorithms has the smallest prediction error, with %MAE of 8.29%, and R2 of 0.814. 3) The RLP map generated by the proposed methodological framework can effectively reveal the circular characteristics and local singularity of the RLP distribution. This study provides new ideas, methods, and technical means for rapidly and accurately mapping urban RLPs, which is conducive to the improvement of urban RLP monitoring systems in the era of big data.
基于多源数据和集成学习的城市住宅地价分布模拟: 以武汉市为例
DOI:10.18306/dlkxjz.2021.10.005
[本文引用: 1]
精准刻画城市住宅地价分布特征,对于科学引导城市空间布局规划、有效实现城市精明增长等具有重要意义。而城市住宅地价与其潜在影响因素之间的复杂非线性关系,给地价分布精细模拟带来了挑战。论文旨在探索基于地理大数据和集成学习的城市住宅地价分布模拟方法体系,以满足快速、精准监测地价动态变化的需要。选取武汉市为典型区,以住宅用地交易样点、兴趣点(points of interest, POI)和夜间灯光影像为数据源,以500 m分辨率网格为估价单元,提取POI核密度和夜间灯光强度作为住宅地价预测变量,采用机器学习算法和bagging、stacking集成方法构建住宅地价预测模型,并对比分析其精度。研究发现:① 单个机器学习算法中,支持向量回归(support vector regression, SVR)预测精度最高,接下来依次是k最近邻算法(k-nearest neighbor algorithm, k-NN)、高斯过程回归(Gaussian process regression, GPR)和BP神经网络(back propagation neural networks, BP-NN);② 在提升单个算法预测精度方面,stacking方法的性能优于bagging方法,使用stacking集成SVR和k-NN的地价预测模型精度最高,其平均绝对百分误差仅为8.29%,拟合优度R<sup>2</sup>达0.814;③ 基于论文所构建模型生成的城市住宅地价分布图能有效表征价格圈层分布特征和局部奇异性。研究结果可为城市住宅地价评估提供新的思路和方法借鉴。
Analyzing spatial characteristics of urban resource and environment carrying capacity based on covert-resilient-overt: A case study of Wuhan city
DOI:10.11821/dlxb202110008
[本文引用: 1]
The resources and environment carrying capacity (RECC) is a barometer of the development of urban territory space, so exploring the spatial characteristics of RECC is greatly significant for optimizing the territory spatial pattern. In this context, this paper uses new urban geographic information data, such as night-time lights and atmospheric remote sensing, points of interest, historical traffic situation and social media, on the basis of relevant procedures and guidelines. Furthermore, a theoretical framework based on the covert-resilient-overt analysis of the spatial characteristics of urban RECC is proposed, and a method combining spatial autocorrelation and fractal geometry is developed for spatial characteristics mining of RECC. Taking Wuhan as an example to carry out research, the results show that: (1) The distribution of RECC in Wuhan has significant spatial heterogeneity. Areas with higher covert carrying capacity are concentrated in the Huangpi District and Xinzhou District with superior ecological environment in the northern periphery of the city, areas with high resilient carrying capacity are concentrated in the central urban area with strong comprehensive risk response capabilities, and areas with high overt carrying capacity are located in the sub-center of the city with sound basic functions. (2) The RECC in Wuhan has positive spatial aggregation, and it shows significant radius-centripetal fractal and circle characteristics. The areas of high covert carrying capacity spread radially around, and the areas with high resilient carrying capacity are concentrated in the core of the city in a centripetal shape, the areas with high overt carrying capacity are between the areas with high values of covert and resilient carrying capacity. In conclusion, the spatial characteristics analysis and mining method system of urban RECC constructed in this paper make up for the shortcomings of the low dynamics of traditional data by introducing multi-source spatial temporal data, and improves the theoretical and technical paradigm of urban RECC research. The research provides a new way of thinking for the carrying capacity of urban resources and environment.
基于隐性—韧性—显性的武汉城市资源环境承载力空间特征
DOI:10.11821/dlxb202110008
[本文引用: 1]
资源环境承载力是衡量城市国土空间发展状况的晴雨表,深入揭示资源环境承载力系统要素的相互作用机理对城市国土空间格局优化具有重大意义。本文在双评价指南的基础上引入夜光/大气遥感、兴趣点、交通态势、社交媒体等多源时空数据,建立了基于隐性—韧性—显性的城市资源环境承载力空间特征分析理论框架,提出了空间自相关和分形几何相结合的承载力空间特征挖掘方法。以武汉市为例开展研究,结果表明:① 武汉市资源环境承载力呈显著空间异质性,隐性承载力指数高值区分布于城市外围生态环境优越的区域,韧性承载力指数高值区集中于综合风险应对能力较强的中心城区,显性承载力指数高值区位于各项基础功能均较为健全的城市次中心一带;② 武汉市资源环境承载力存在正向空间聚集性,并呈显著半径向心分形特征,隐性承载力指数高值区呈放射状向四周扩散,韧性承载力指数高值区呈向心状聚集在城市核心圈层,显性承载力指数高值区分布于则介于二者之间。本文构建的城市资源环境承载力空间特征分析与挖掘方法体系,通过引入多源时空数据弥补了传统数据现势性的不足,完善了城市资源环境承载力研究的理论和技术范式,可为新时期城市资源环境承载力研究提供一种新思路。
Spatial characteristics of land use based on POI and urban rail transit passenger flow
DOI:10.11821/dlxb202102015
[本文引用: 1]
The integrated development of urban rail transit and land use nearby is one of the most important issues for sustainable development of cities. To improve the sustainability of urban rail transit and the rationality of land resource allocation, it is of great importance to understand the dependence relationship between passenger flow of urban rail transit and functions of land use. Regression analysis is the main method to study this relationship. However, the descriptions of land use in existing research are mostly based on sketchy data such as land area, which is difficult to reveal the impact mechanism and spatial effects of land use of various attributes on passenger flow. To this end, this study utilizes Point of Interest (POI) data of Baidu Map to describe land use information, and proposes a fine-grained description method of land use function within the attraction scope of urban rail transit station. Based on the case of Beijing Subway, global regression models with constant parameters and local regression model with variable parameters are employed to study the dependence relationship and spatial effects of coarse and fine-grained land use with outbound passenger flow at morning peak. The case study of Beijing Subway shows that comprehensively considering the tradeoff between the explanatory power and complexity of models, and the effect of dealing with spatial dependence and heterogeneity, the geographically weighted regression (GWR) model with variable parameters has the best estimation compared with the global model with constant parameter. Its interpretation ability is 84%, and Moran's I index of residuals is 0.0001, which can describe the spatial heterogeneity of the dependence of station outbound passenger flow and POI. The results also display that the Beijing's urban rail transit station basically covers the social and economic center of the central city. These areas are usually developed in a high-intensity hybrid manner for land development. Moreover, the impact and spatial characteristics of land use with different attributes and functions on the morning peak outbound passenger flow are significantly different. For example, the morning peak outbound passenger flow is closely related with the land for commercial and business facilities, administration and public services, which are related to housing and employment, and the commuter between the two places. At the fine-grained level, the outbound passenger flow is more dependent on POI of office buildings and government agencies, which are significantly distributed in the central city functional areas and urban core areas with dense employment. The local model with variable parameters based on fine-grained POI can better identify the impact and spatial heterogeneity of various types of land use on station passenger flow. The case study indicates that the dependence of station passenger flow and land use is the superposition of impacts and spatial effects of various attribute functions of land use.
基于POI的土地利用与轨道交通客流的空间特征
DOI:10.11821/dlxb202102015
[本文引用: 1]
城市轨道交通及其沿线土地一体化发展是城市可持续发展的关键问题。提高城市轨道交通可持续性和土地资源配置合理性的关键需掌握轨道交通客流与土地功能之间的依赖关系,而回归分析是研究二者关系的主要方法。既有研究对于土地利用的描述多基于用地面积等概略数据,难以揭示各类属性的用地对客流的影响机理及其空间效应。采用百度地图POI数据以刻画用地信息,提出城市轨道交通车站吸引范围内用地功能的细粒度描述方法,基于全局常参数和局部变参数的回归模型研究车站早高峰出站客流与粗细粒度土地利用的相互依赖关系及其空间效应。针对北京地铁的案例研究表明:车站出站客流与不同功能用地及POI的依赖程度和空间特征存在显著差异。早高峰出站客流更多地受到与就业通勤相关的商业服务业设施用地、公共管理与公共服务用地的影响。在细粒度层面上,出站客流对写字楼和政府机构的依赖性更大,二者显著分布在就业岗位密集的中心城区功能分区和城市核心区。基于细粒度POI的局部变参数模型能较好地识别各类土地利用对车站客流的影响及其空间异质性,案例研究表明车站客流与土地利用的依赖关系是各类属性功能用地影响及其空间效应的叠加。
Scale sensitive analysis of cellular automata model
元胞自动机模型的尺度敏感性分析
Spatial scale sensitivity of CA-Markov model
DOI:10.13249/j.cnki.sgs.2011.08.897
[本文引用: 3]
Cellular Automata (CA) model is an efficient model to simulate land use/cover change (LUCC) process. However, the majority of geographic cellular automata researches now focus more on transition rules than on spatial scale selection. As a result, the spatial scale decisions of geographic cellular automata are often made arbitrarily. When using CA model in geographic context, nontrivial questions have to be answered about the choice of spatial scale and neighborhood configuration. This article takes Huadu district,Guangzhou City as the study area, to investigate the effect of changing spatial scale and neighborhood configuration on the result prediction accuracy of the CA-Markov model and the morphology of land use change simulation result. The result shows that (1)the spatial scale has great impact on the simulation results of CA-Markov model. Coarse cell size will reduce the result prediction accuracy of the model. There is a threshold of cell size in the model. When the cell size exceeds this threshold, the result prediction accuracy dropped rapidly. (2) Neighborhood configuration also has impact on the simulation results of CA-Markov model. The patch number and patch density of simulation result using 3?3 Von Neumann neighborhood are higher than simulation result using 3?3 and 5?5 Moore neighborhood, but there is little difference of Kappa coefficients of the simulation results.
CA-Markov模型的空间尺度敏感性研究
Scale sensitivity and its causality for geo-cellular automata modelling
DOI:10.11821/yj2010050010
[本文引用: 1]
<p>Geographical Cellular Automata (GeoCA) is an efficient model to simulate dynamic geographical process, which has been illustrated by a great number of researches. Surprisingly, there are few researches discussed in detail on the scale sensitivity of cell size during the geo-cellular automata modelling process. Among existing researches using GeoCA, cell size is always decided by the resolution of geographical data source. Whether cell size will affect the simulation results of GeoCA or not is a hotspot. If it does, what is the causality of scale sensitivity of GeoCA? How does cell size affect simulation result of GeoCA? And how can we choose a suitable cell size during geo-cellular automata modelling? Few researches have achieved answers for these questions. In order to figure out effects on simulation result of GeoCA caused by cell size and its mechanism, and to provide a principle to choose cell size for GeoCA, we take land use change simulation of Hangzhou City as a case, and choose cell sizes of 50m×50m, 100m×100m, 150m×150m and 200m×200m to analyze the scale sensitivity of GeoCA. And then, by analyzing transfer rule, causality of scale sensitivity is discussed in this paper. The research result shows that (1) simulation results of GeoCA are sensitive to cell size, and the more fine the cell sizes are, the higher the accuracy of the simulation results; (2) scale sensitivity of GeoCA is not uniform in all cellular sizes, it is sensitive in some range of cellular size while it is insensitive in other ranges; (3) scale sensitivity of GeoCA simulation results is by large caused by increasing isolated cells. These isolated cells and cells around them have lower neighborhood function value, and then their transfer probabilities are also lower. With the increase of cell sizes, the number of isolated cells in cellular automata space increases. Because of lower transfer probability of these isolated cells, these increasing isolated cells caused higher error rate of simulation results of GeoCA. So, the number of isolated cells is the main cause for scale sensitivity of cell sizes when we do the geo-cellular automata modelling.</p>
地理元胞自动机模型的尺度敏感性及原因
Effects of cell size and configuration in cellular automata based prey-predator modelling
DOI:10.1016/j.simpat.2003.08.006 URL [本文引用: 1]
Examining the sensitivity of spatial scale in cellular automata Markov chain simulation of land use change
DOI:10.1080/13658816.2019.1568441 URL [本文引用: 2]
Spatial autocorrelation analysis of multi-scale land-use changes: A case study in Ongniud Banner, Inner Mongolia
DOI:10.11821/xb200604006
[本文引用: 1]
A prerequisite in using conventional statistical methods, like regression models in land-use changes model, is that the data analyzed with these methods should be statistically independent and identically distributed. But spatial data, like land-use data, have a tendency to be dependent (spatial autocorrelation), which means that when using spatial models, a part of the variance may be explained by neighbouring values. In other words, values over distance may be more similar or less similar than expected for randomly associated pairs of observations. This indicates that standard multiple regression models cannot capture all the spatial autocorrelative characteristics in the data. Spatial dependency contains useful information but the appropriate methods have to be used to deal with it. To overcome this defect, correlograms of the Moran's I are used to describe the spatial autocorrelation for data of Ongniud Banner. And in this paper, mixed regressive-spatial autoregressive models (spatial lag models), which incorporate both regression and spatial autocorrelation, were constructed. The following results were obtained: (1) Positive spatial autocorrelation was detected not only between dependent variables but also between independent variables, indicating that the occurrence of spatial autocorrelation was highly dependent on the aggregation scale. (2) The Moran's I decreased with the increase of the aggregation levels, a result of the non-linear smoothing character between Moran's I and distance. (3) The residuals of the standard regression model also showed positive autocorrelation,indicating that the standard multiple linear regression model failed to consider all the spatial dependencies in the land use data. (4) The mixed regressive-spatial autoregressive models (spatial lag models) yielded residuals without spatial autocorrelation but with a better goodness-of-fit. (5) The mixed regressive-spatial autoregressive model was statistically sound in the presence of spatially dependent data, in contrast with the standard linear model.
土地利用变化的多尺度空间自相关分析: 以内蒙古翁牛特旗为例
Scale sensitive of cellular automata model for the simulation of land use change based on orthogonal experiment
DOI:10.13249/j.cnki.sgs.2013.010.1252
[本文引用: 2]
Land use change is a core field of the global environmental change and it has turned into worldwide research focus. Accurate prediction of land use change is of great importance from the standpoint of theory and practice. Cellular Automata (CA) model has unexampled advantages in creating spatial modeling approaches for simulating land use changes, which has been applied and proved by a great number of researches for decades and all achieved satisfactory effects. However, along with the attention of scale effect in geoscience, it is found that the scale effect in CA model is reflected on the transition rule, the cell size, the neighborhood size and the neighborhood type. That is to say, CA model is sensitive to these four factors. Different scales of these four factors work together and remarkably impact the accuracy of the results simulated by CA model. Among those existing researches analyzing the sensitivity of CA model in land use change simulation, single factor is always the research priority. But they are just far from comprehensive and the research results are not very precise since all these factors, without question, will affect directly to the performance of CA model. What is more, the complex relationships between those factors need to explore as well. To cure the above problems, an orthogonal experiment design method is proposed to analyze the scale sensitivity of CA model to these influential factors. What is more, the existing problems of the correlation between these factors were proved for the first time in the article. Under this scheme, Wuhan, the capital of Hubei Province was taken as an example to analyze the sensitivity of CA model by comparing the difference of the simulated results. Using the special method of range analysis in orthogonal experiment design, it helped to find the influence of different factors to the Cellular Automata model and the optimum combination of factors and also test whether there exist some correlation between any two factors of the cellular automata model. Specifically, when it comes to the sensitivity with which CA model reflects those factors, the sequence decreasingly was the transition rule, the cell size, the neighborhood size and the neighborhood type. In addition, these factors and their respective optimum level together make up the optimum combination of factors to CA model. Besides, the results also revealed that there existed remarkable interactions between the transition rule and the cell size, and between the transition rule and the neighborhood size. In general, this study provides a comprehensive basis for scale sensitivity analysis of CA model in land use change simulation and fills the gaps of the existing methods in exploring this problem.
基于正交试验设计的土地利用变化元胞自动机模拟过程的尺度敏感性分析
DOI:10.13249/j.cnki.sgs.2013.010.1252
[本文引用: 2]
采用正交试验设计,提出一种探测土地利用变化元胞自动机模拟过程中的尺度敏感性分析方法,系统地分析了元胞自动机模型各尺度因素之间的关系以及尺度组合对模拟精度的影响,并检验了模型中不同尺度因素相互之间存在的相关性。结果表明在利用元胞自动机来模拟土地利用变化过程中,模拟结果对各因素的尺度敏感性由大到小依次为转换规则、元胞大小、邻域大小和邻域形状,且转换规则同元胞大小之间、以及同邻域大小之间都存在明显的尺度交互影响。
Analysis of error propagation and uncertainties in urban cellular automata
DOI:10.11821/yj2007030003
[本文引用: 2]
The issues of data errors, error propagation and model uncertainties are important but often neglected in urban CA models.This paper has examined and addressed some of these issues by carrying out experiments with GIS data. Many model errors are related to model configurations, i.e. how to define a proper model to reflect the real process of urban development. This study demonstrates that some of them, however, are quite unique to CA: 1) data source errors will be reduced during simulation because of the averaging effects of neighborhood functions; 2) simulation errors will decrease with time because the availability of land suitable for urban development will be decreased in constrained urban CA as the urban areas grow in size; 3) the number of time steps (iterations) can cause different spatial patterns and simulation closer to actual development can be achieved with the increase in time steps; and 4) the major uncertainties of simulation are mainly found at the edge of simulated urban areas. These characteristics are quite different from those of general GIS modeling. The study shows that errors and uncertainties of urban CA are less severe than what one would normally expect from a simulation model. The uncertainties of the simulation will be reduced if more amounts of land are developed and the uncertainties are mainly located at the urban fringe. The findings of the study can help urban modelers and planners to understand more clearly the characteristics of errors and uncertainties in urban CA so that they can be used more effectively in urban planning.
元胞自动机在城市模拟中的误差传递与不确定性的特征分析
Urban spatial structure based on point pattern analysis: Taking Beijing metropolitan area as a case
基于点模式分析的城市空间结构研究: 以北京都市区为例
A POI data-based study on urban functional areas of the resources based city: A case study of Benxi, Liaoning
基于POI大数据的资源型城市功能区识别方法与实证: 以辽宁省本溪市为例
Land use/land cover change and driving forces in the region of upper reaches of the Dadu River
DOI:10.11820/dlkxjz.2004.01.008
[本文引用: 1]
Based on remote sensing imageries of 1967,1987 and 2000, and a digital elevation model with a scale of 1∶250000, the land use/ land cover change and driving forces in an area of 18665 km2 in the region of upper reaches of the Dadu river are examined. The results show that the dominant land type in research area changed from forest land to grassland between 1967 and 2000. This was mainly decrease of 319774 hm2 and its proportion to total area dropped from 30.92% to 13.78%. Landscape pattern analysis finds out that forest patches had an increasing regularity with fragmentation process,which indicates that the decreased forest was an outcome of a planed cutting by state-owned forestry enterprises, rather than of blind cutting by local people. This point has been approved by historical documents. Therefore, it is concluded that governmental policies played a dominant role in land use/land cover change of this region. For analyzing various bio-physical and socio-economic driving forces, the method of Logistic stepwise regression is applied in our study. Through spatial analysis, the most significant drivers and their relative importance for cultivated land, forest land, grassland, water area, built-up land and unused land are founded out from such factors as terrain, elevation, roads, water system, urban and rural residential areas.
大渡河上游地区土地利用/土地覆被变化与驱动力分析
Landuse change mechanism in Shenzhen city
DOI:10.11821/xb200002003
[本文引用: 1]
Based on remote sensing images in 1980, 1988 and 1994, the Shenzhen citi’s land use was conducted through methods of maximum like and probabilistie relaxation. Which revealed the city’s spatial process during 15 years. The conclusions may be distingnished as follows: (1) The results of the detection are reasonable and it is feasibility to calculate the transfer matrix of landuse to show spatial pattern of landuse distribution as unit of image pixel. (2) The main characteristics of the city’s landuse change are the obvious reduction of the existing farm and orchard lands and subsequent rapid increase of urban landuse along the coast and several major roads which are controlled by the opening policies of establishing the special economic zone in this city. (3) The characteristics of the city’s landuse changes are mainly demonstrated as follows: The urban landuse increases rapidly at the expense of occupying great amounts of farmland, showing the patterns of belt distribution along the main transportation lines and of spreading outside the Special Economic Zone. In the primary landuse such as farmland and woodland, etc, the tendency from the lower benefit landuse pattern transforming to the higher benefit one has taken place due to the influence of urbanization. Furthermore, the city’s landuse changes also demonstrate the characteristics of bare land enlargement and farmland split up, which is one of important factors recently led to serious soil erosion and no point source pollution in the city. (4) Under the policy of the special economic region produced by the central goverment of China, the external driving forces of landuse changes in Shenzhen City are the rapid growth of population, foreign investment and development of the tertiary industry which was based upon the real estate. The counter force of landuse changes in Shenzhen City are the transportation issue, topography, landuse patterns, the most importent factor is the transportation.
深圳市土地利用变化机制分析
DOI:10.11821/xb200002003
[本文引用: 1]
利用1980、1988、1994年的遥感影像,通过应用最大似然法和概率松弛法对深圳市土地利用进行了测量。在此基础上,运用分类结果比较法求得研究区土地利用变化的转移矩阵,据此分析了深圳市15年来土地利用变化的空间过程。结果表明:深圳市土地利用变化主要表现为原有农田、果园用地显著减少,城镇用地沿海岸和主要公路干线迅速增加。
Impacts of climate and land use/cover changes on runoff in the Hanjiang River basin
DOI:10.11821/dlxb202011003
[本文引用: 1]
As a link between the atmosphere and the geosphere, the hydrological cycle is affected by both climate change and Land Use/Cover Change (LUCC). However, most existing research on runoff response focused mainly on the impact of the projected climate variation, neglecting the influence of future LUCC variability. Therefore, the objective of this study is to examine the co-impacts of both projected climate change and LUCC on runoff generation. Firstly, the future climate scenarios under BCC-CSM1.1 and BNU-ESM are both downscaled and corrected by the Daily Bias Correction (DBC) model. Secondly, the LUCC scenarios are predicted based on the Cellular Automaton-Markov (CA-Markov) model. Finally, the Soil and Water Assessment Tool (SWAT) model is used to simulate the hydrological process under different combinations of climate and LUCC scenarios, with the attempt to quantitatively evaluate the impacts of climate change and LUCC on runoff generation. In this study, the Hanjiang River basin is used as the case study area. The results show that: (1) compared with the base period (1966-2005), the annual rainfall, daily maximum and minimum air temperatures during 2021-2060 will have an increase of 4.0%, 1.8 ℃, 1.6 ℃ in RCP4.5 scenario, respectively, while 3.7%, 2.5 ℃, 2.3 ℃ in RCP8.5 scenario, respectively. (2) During 2010-2050, the area proportions of forest land and construction land in the study area will increase by 2.8% and 1.2%, respectively, while those of farmland and grassland will decrease by 1.5% and 2.5%, respectively. (3) Compared with the single climate change or LUCC scenario, the variation range of future runoff under both climate and LUCC is the largest, and the influence of climate change on future runoff is significantly greater than that of LUCC. This study is helpful to maintain the future water resources planning and management of the Hanjiang River basin under future climate and LUCC scenarios.
气候与土地利用变化对汉江流域径流的影响
DOI:10.11821/dlxb202011003
[本文引用: 1]
作为联结大气圈和地圈的纽带,水文循环同时承受气候变化和土地利用/覆被变化(LUCC)的双重影响,然而大多数的水文响应研究主要关注未来气候变化对径流的影响,忽略了未来LUCC的作用。因此,本文的研究目的是评估未来气候变化和LUCC对径流的共同影响。首先采用2种全球气候模式(BCC-CSM1.1和BNU-ESM)输出,基于DBC降尺度模型得到未来气候变化情景;然后,利用CA-Markov模型预测未来LUCC情景;最后,通过设置不同的气候和LUCC情景组合,采用SWAT模型模拟汉江流域的未来径流过程,定量评估气候变化和LUCC对径流的影响。结果表明:① 未来时期汉江流域的年降水量、日最高、最低气温相较于基准期(1966—2005年),在RCP 4.5和RCP 8.5浓度路径下,分别增加4.0%、1.8 ℃、1.6 ℃和3.7%、2.5 ℃、2.3 ℃;② 2010—2050年间,流域内林地和建设用地的面积占比将分别增加2.8%和1.2%,而耕地和草地面积占比将分别减少1.5%和2.5%;③ 与单一气候变化或LUCC情景相比,气候变化和LUCC共同影响下的径流变化幅度最大,在RCP 4.5和RCP 8.5浓度路径下未来时期年平均径流分别增加5.10%、2.67%,且气候变化对径流的影响显著大于LUCC。本文的研究结果将有助于维护未来气候变化和LUCC共同影响下汉江流域的水资源规划与管理。
Cellular automata and Markov Chain (CA-Markov) model-based predictions of future land use and land cover scenarios (2015-2033) in Raya, northern Ethiopia
DOI:10.1007/s40808-017-0397-6 URL [本文引用: 1]
Use of response surface methods and path of steepest ascent to optimize ligand-binding assay sensitivity
DOI:10.1016/j.jim.2013.02.019 URL [本文引用: 2]
Simulation of land development through the integration of cellular automata and multi-criteria evaluation
DOI:10.1068/b250103 URL [本文引用: 1]
Calibrating a Land Parcel Cellular Automaton (LP-CA) for urban growth simulation based on ensemble learning
DOI:10.1080/13658816.2017.1367004 URL [本文引用: 1]
Mining transition rules of cellular automata for simulating urban expansion by using the deep learning techniques
DOI:10.1080/13658816.2018.1480783 URL [本文引用: 1]
