

1 引言
粮食安全是关系到国计民生安全保障的重要基础[1]。城镇化、工业化的快速发展蚕食了中国大量耕地,而粮食作物种植效益低下导致了较为严重的耕地“非粮化”[2],威胁着粮食安全,农业结构调整与农产品结构性需求失衡成为需要迫切解决的重要问题[3],然而部分地区为追求更高的作物经济收益,把农业结构调整简易解读为压减粮食生产,将种粮耕地大幅改种高收益经济作物,仅2019年中国粮食播种面积便减少9.70×10⁵ hm2,任其发展,耕地“非粮化”必将影响国家粮食安全。与此同时,2020年国家提出的新发展格局明确要求以国内大循环为主体、扩大内需为重点[4],在农业生产发展环节中要求国内自给自足的前提下保障粮食安全[5]。但多年数据表明,中国粮食作物供给呈现结构性不足,突出表现为玉米、大豆等需求缺口持续扩大,自给自足面临威胁。因此,防止耕地“非粮化”与调整粮食结构需同步推进,确保粮食生产自给能力和经济收益同步提升,故亟需重视研究粮食种植结构与价值之间的关系,防治耕地“非粮化”,解决粮食结构性需求问题。
近年来耕地“非粮化”“非农化”对粮食安全所造成的影响引发社会各界高度关注,学者们多从耕地多功能评价与时空演变特征[6⇓-8]、耕地利用转型[9-10]及其驱动机制[11]、耕地利用与粮食生产[12-13]等方面探究耕地粮食安全问题。迄今为止,国外学界暂无明确的耕地“非粮化”概念,其主要从经济作物快速扩张对人类社会和生态环境带来的负面影响等问题展开研究[14-15]。国内学者则从粮食安全视角探究耕地“非粮化”的空间分异与影响因素[16],而耕地生态服务功能及其价值,以及“非粮化”空间异质性研究[17⇓-19],在一定程度上弱化了对耕地粮食生产与经济产出等基础功能的研究[20],因而应对耕地“非粮化”现象的基础功能价值开展研究[21]。此外,现阶段相关研究均以粮食作物或非粮作物种植面积比例衡量耕地“非粮化”水平,缺乏对“非粮化”溯源分析,即缺乏通过量化值反映“非粮化”程度及影响。耕地经济价值即为与耕地经济功能对应的价值,由耕地上谷类、薯类及豆类作物等粮食作物总产值与油料、棉花、麻类及糖类等经济作物总产值共同构成。本文借鉴粮经比[22]概念内涵,将粮食作物产值与耕地经济价值的比例定义为粮耕价值比,该比值一定程度上可反映耕地利用中粮食种植的经济效益,揭示耕地“非粮化”的总态势。
在耕地作物种植结构方面,国外学者倾向于借助遥感数据分析耕地上农作物的种植空间分布特征[23],多聚焦于全球范围[24]和亚洲[25]等大尺度区域;国内学者则主要针对农作物种植结构的时空特征及演化[26⇓⇓-29]展开研究,对单一粮食作物的种植结构[30]、面积[31]、分布[32-33]等也有探索,但具体到粮食作物种植结构的研究相对较少。以上文献表明,鲜有将耕地“非粮化”和粮食结构问题进行关联性探讨,而粮耕价值比与粮食种植结构的耦合协调同二者关系密切,并关乎粮食安全保障与粮食品质提升。鉴于此,本文基于Simpson指数模型,以中国省级行政单位为单元,借鉴农作物种植结构分析方法[34]量化省域层面稻谷、小麦、玉米、薯类、大豆等主要粮食作物种植结构多样性程度,以反映粮食作物种植结构的丰富性,可为粮食结构性需求短缺问题论证提供依据;采用耦合协调度模型和空间自相关分析等方法,综合探讨2004—2020年研究区粮耕价值比和粮食作物种植结构时空耦合特征,以此解构中国面临的粮食形势,为中国耕地“非粮化”管控策略的制定提供科学依据,并为提高粮食种植比较效益、优化粮食结构布局提供参考建议。
2 数据来源与方法
2.1 数据来源
2003年4月农村税费改革试点工作在全国推开,其中“粮食增产、农业增效和农民增收”被确定为农业和农村经济工作的主要目标,且《农业法》和《农村土地承包法》于当年3月1日起同时实施,故研究选择2004年为研究基期,5年为间隔,即选取2004年、2009年、2014年、2020年时间截面省域尺度的稻谷、小麦、玉米、薯类、大豆等粮食作物播种面积,谷类、薯类及豆类等粮食作物产值,油料、棉花、麻类、糖料、烟草及蔬菜等经济作物产值。本文中粮食作物播种面积主要通过《中国统计年鉴》(2005—2021年)获取,粮食作物和经济作物产值通过中国三农数据库获取,中国行政区边界数据来自中国科学院资源环境科学与数据中心(www.resdc.cn/),最终形成2004—2020年中国省份面板数据,受数据获取限制,数据暂未包含港澳台地区。
2.2 研究方法
2.2.1 Simpson指数模型
为研究粮食作物种植结构类型在省级尺度上的演变趋势,引入生态学中的优势度指数(Simpson多样性指数)。该指数指从一个群落中连续两次抽样所得到的个体数属于同一种的概率,表征各省份当年粮食作物种植结构类型的多样性特征,指数越大,表明种植类型越丰富,各类粮食作物分布越均匀[35]。公式表示如下:
式中:SIDI表示区域粮食作物种植结构类型的多样性指数,其值域为[0, 1),值越大则区域种植结构类型多样性程度越高;S表示研究时段内粮食作物的类型数量,
2.2.2 耦合协调度模型
耦合协调度是在耦合度和协调度的基础上,描述系统或要素彼此相互作用、协调一致的程度,体现系统之间相互关联程度强弱与协调状况好坏。粮耕价值比与粮食作物种植结构之间的耦合协调表现为综合性和协调性的发展,以耦合协调度衡量较为科学。耦合协调度D的计算公式为:
式中:T为粮耕价值比与种植结构两系统的耦合度;C为粮耕价值比与种植结构两系统的协调度。
式中:f(x)与g(x)分别对应粮耕价值比与种植结构Simpson多样性指数;a和b表征待定系数,体现二者在总系统中的重要性,鉴于其处于同等重要的地位,取a = b = 0.5。
表1 耦合协调度的划分标准及其类型
Tab. 1
| D值 | 耦合类型 | D值 | 耦合类型 |
|---|---|---|---|
| (0, 0.2] | 勉强耦合协调 | (0.6, 0.8] | 高度耦合协调 |
| (0.2, 0.4] | 低度耦合协调 | (0.8, 1.0] | 极度耦合协调 |
| (0.4, 0.6] | 中度耦合协调 |
2.2.3 空间自相关分析
空间自相关分析可反映一个区域单元上的某一属性值与邻近区域单元上同一属性值的关联程度。为了避免空值单元的影响,本文将数据暂缺地区剔除后进行空间自相关分析,分别采用Global Moran's I、Local Moran's I衡量粮耕价值比与粮食作物种植结构耦合协调度的全局和局部空间自相关情况。
依据Global Moran's I反映空间邻近单元属性值在整体上的空间关联程度,以此分析中国各省份粮耕价值比与种植结构耦合协调度在空间上的整体聚集特征,其值域为[-1, 1]。Moran's I > 0表示空间正相关性,其值越大,空间相关性越明显;Moran's I < 0表示空间负相关性,其值越小,空间差异越大;Moran's I = 0,空间呈随机性。
局域空间自相关表示各空间单元与其邻近空间单元属性值之间的关联程度,常用的度量指标为局域Moran's I。计算公式如下:
式(5)和式(6)中:
根据Local Moran's I指数的计算结果,通常Ii > 0时,以HH/LL表示该空间单元相较周围省份的属性值均较高/较低,且综合空间差异较小;Ii < 0时,以LH/HL表示属性值较低/较高的空间单元相较周边省份较高/较低,且综合空间差异较大。
3 研究结果与分析
3.1 粮耕价值比时空格局演化分析
采用自然断点法(Jenks),对2004—2020年中国各省份粮耕价值比进行统一分区,由基期年得到5个中断值依次为0.23、0.40、0.56、0.74、0.90,据此划分为:低、较低、中等、较高、高(下同),分析耕地粮食作物与经济作物的种植比较效益时空格局特征。
2004—2020年中国耕地经济价值、粮食作物价值和经济作物价值三者均逐渐增加(图1),粮耕价值比却呈现阶梯式下降态势,比值由0.510降至0.362,降幅为29.02%,表明种粮比较效益逐渐降低。空间上,各省份粮耕价值比呈现“由北向南”“由西向东”双重递减的空间特征(图2)。从地理分区角度看,2004—2009年中国粮耕价值比处于中等及以上值区的省份主要分布于东北、华北、华中和西部地区,少部分低值区(低和较低两类)则分布于东南沿海地区。2010—2014年粮耕价值比中等及以上类型的区域数量明显减少,低值区的数量逐渐增加。2015—2020年各省份粮耕价值比的主导类型由中等及以上向中等及以下转变,高值区范围缩减至东北地区和内蒙古、山西、西藏等个别地区;低值区则主要广泛分布于华东、华中和西南地区。
图1

图1
2004—2020年中国粮耕价值比变化趋势
Fig. 1
Changes of the grain-to-arable value ratio in China from 2004 to 2020
图2
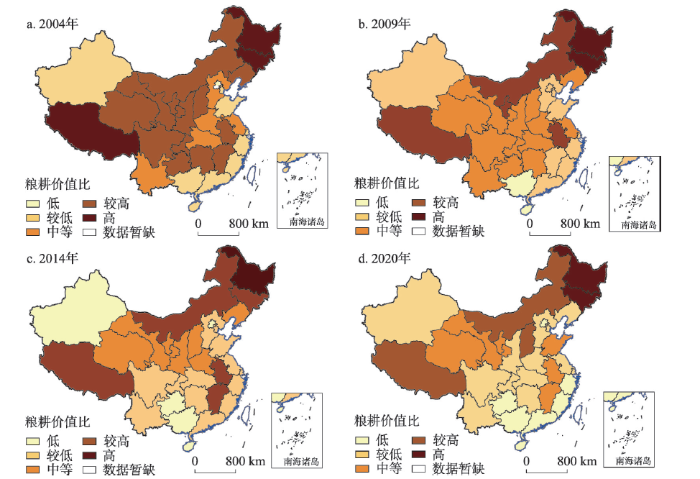
图2
2004—2020中国各省粮耕价值比时空格局
注:基于自然资源部标准地图服务网站GS(2019)1822号标准地图制作,底图边界无修改。
Fig. 2
The spatio-temporal pattern of provincial grain-to-arable value ratio in China from 2004 to 2020
2004—2020年粮耕价值比总体下降,种粮比较效益持续走低,侧面反映农户的粮食作物经营收入比重逐年降低是现阶段耕地“非粮化”问题突出的重要原因。耕地“非粮化”自2009年起便有迹可循(图1),具体表现为经济作物价值的增长幅度开始明显大于粮食作物价值涨幅。此外,空间上可见中国南部和东部地区的耕地“非粮化”现象较北部和西部地区更为严重,其主要原因可能为受自然环境和经济产业发展影响,东南部地区的热带和亚热带季风气候为农作物结构调整提供广阔的适宜空间,在经济发展和比较效益驱动下,农户易将粮食作物改种蔬菜、花卉、橡胶、水果等效益较高的经济作物。
3.2 粮食作物种植结构的时空格局演化分析
3.2.1 播种面积结构时空格局演化分析
2004—2020年中国主要粮食作物播种面积占比变化各有差异(图3),其中稻谷和小麦的播种面积占比相对稳定,稻谷保持在25%~27%之间;小麦保持在20%~23%之间;大豆的播种面积占比在2019年前维持在4%~5%左右,2020年突增至9.93%;玉米播种面积占比逐渐递增,由25.04%增长至35.34%,涨幅为41.13%;薯类播种面积占比先减后增,整体上仍处于减少态势,由9.44%减至6.18%。其他粮食作物播种面积占比由11.78%逐渐递减至2.78%,降幅为76.4%。稻谷和小麦两大主粮播种面积占比呈现细微波动性变化,说明在政策引导下其播种面积基本保持稳定,主粮数量安全得到保障;但其他主粮在逐渐下降,粮食结构多样性减少,粮食结构性安全呈现不稳定状态。
图3
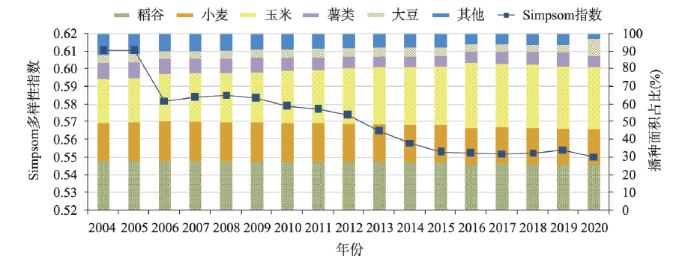
图3
2004—2020年中国粮食作物种植结构及其构成变化
Fig. 3
The cultivation structure of food crops and its composition change in China from 2004 to 2020
通过绘制雷达图分析中国各省份2004—2020年粮食作物、稻谷、小麦、玉米、薯类、豆类和其他粮食作物播种面积变化状况(图4)。2004—2020年中国粮食播种面积总体呈递增趋势,多数省份的粮食总播种面积变化趋势与全国保持一致,其中黑龙江、内蒙古和新疆三地增长率较高,均大于50%;东南沿海及直辖市等经济发达地区受市场需求及经济建设活动影响,粮食播种面积有所下降,但降幅在50%以内;就单一粮食作物而言,2004—2020年中国主要类型粮食作物播种面积变化率多居于0附近,整体表现稳中有增,其中比较特别的是玉米播种面积增幅较大,增长率达62.17%。空间上看,2004—2020年稻谷播种面积增长显著的地区为黑龙江、天津、内蒙古,下降较为明显的地区为陕西、甘肃、新疆和东南沿海等地;小麦播种面积增长较明显的区域为江苏、浙江和安徽等长三角地区,播种面积下降较为明显的是东北三省、东南沿海和西南地区等;玉米播种面积在多数省份均增幅较高,其中,江西、黑龙江等种粮大省的玉米播种面积涨幅均超过100%,值得关注的是,青海2004年玉米播种面积仅有1.60×10³ hm2到2020年扩大到21.24×10³ hm2,增长倍数达12.38(图4中将该数值缩小4倍,以便作图)。薯类、豆类和其他作物播种面积大多数地区均下降,仅有少数地区出现小幅增长,其中薯类仅有贵州和天津出现明显增长;豆类仅有黑龙江和内蒙古出现增长;其他粮食作物类增长区域分布在天津、陕西、内蒙古、贵州、青海。
图4
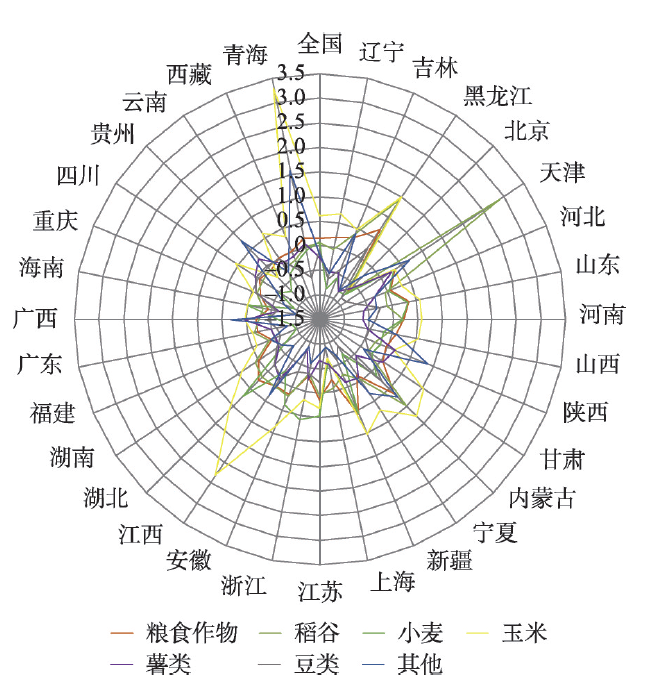
图4
2004—2020年中国各省粮食作物播种面积变化率雷达图
Fig. 4
Radar chart with the comparison of the national and provincial rates of change of the cultivation area of food crops in China from 2004 to 2020
3.2.2 粮食种植结构多样性时空格局演化分析
2004—2020年中国粮食作物种植结构Simpson指数均值整体呈现“先骤降,后缓降至趋于平稳”的变化特征(图3),Simpson指数由最高值0.6105降至0.5504。各省份历年粮食作物种植结构多样性总体上呈现“胡焕庸线”沿线区域高,两侧低的空间特征(图5)。2004年粮食作物种植结构Simpson指数高值区(高、较高)沿“胡焕庸线”分布,即主要分布在中国的北部、华东和西部地区;低值区(低、较低)分布在“江西—湖南—广东”以及西藏。2009年空间格局整体上与2004年保持一致,个别区域Simpson指数下降一个等级,如浙江、福建。2009—2014年,Simpson指数高值区范围缩减至中部和西南部分省份。2020年整体空间格局较2014年没有明显变化。综合而言,粮食作物种植结构多样性递减区域主要分布在东北、华北和华东地区;中西部、西南和东南部分省份多样性结构较为稳定,其中中西部和西南地区多样性稳定在高值区,而东南地区和西藏则稳定在低值区。
图5
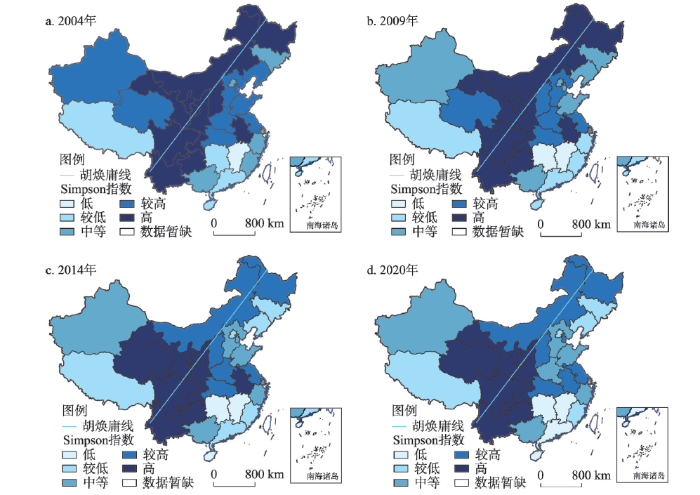
图5
2004—2020中国各省粮食作物种植结构多样性时空格局
注:基于自然资源部标准地图服务网站GS(2019)1822号标准地图制作,底图边界无修改。
Fig. 5
The provincial spatio-temporal pattern of the cultivation-structural diversity of food crops in China from 2004 to 2020
可见,“胡焕庸线”沿线区域粮食作物种植结构与两侧相比,前者更具多样性。“胡焕庸线”由于受气候与地貌等条件作用,成为中国重要的人口地理分界线,其沿线亦是地理环境的过渡梯度线,过渡带上粮食作物种类更为丰富,粮食种植结构也呈现出更为多样化的特征。此外,2014年东北地区粮食作物种植结构多样性递减明显,且一直维持略低于西南地区的状态。相关研究[37]表明东北粮食主产区是作物种植结构调整的重点区域,但研究结果发现其粮食作物种植结构的调整方向可能是多样性递减的模式,表明现阶段部分地区在实施国家种植结构调整的政策时仍存在一定偏差。
3.3 时空耦合演化特征
3.3.1 耦合协调度时空演化特征分析
图6
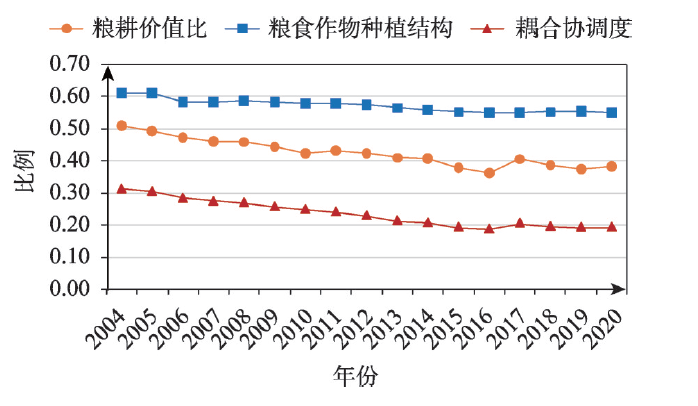
图6
2004—2020年粮耕价值比与种植结构耦合协调度变化趋势
Fig. 6
The coupling and coordination tendency between the grain-to-arable value ratio and the cultivation structure of food crops from 2004 to 2020
图7
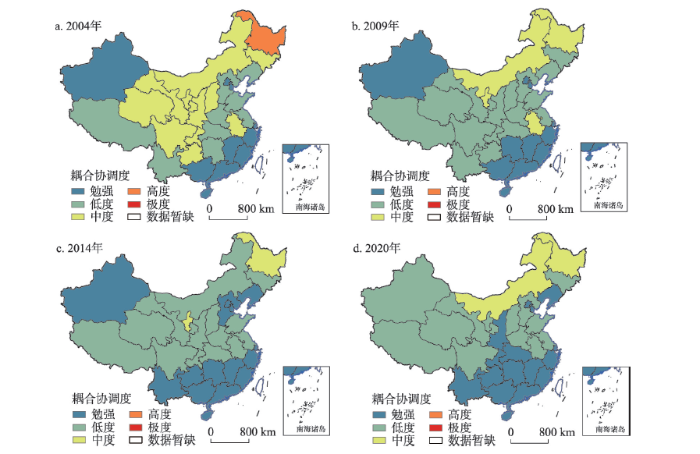
图7
2004—2020年中国各省粮耕价值比与种植结构耦合协调度空间分布
注:基于自然资源部标准地图服务网站GS(2019)1822号标准地图制作,底图边界无修改。
Fig. 7
The provincial spatial distribution of the coupling and coordination degree between the grain-to-arable value ratio and the cultivation structure of food crops in China from 2004 to 2020
2004年各省份耦合协调度出现勉强、低度、中度和高度4种状态。勉强耦合协调主要分布于东南沿海;低度耦合协调区分布在“胡焕庸线”以东、云南及西藏等地;中度耦合协调区大规模分布在“胡焕庸线”以西。高度耦合协调状态仅出现在黑龙江,且其他年份未出现,数据显示黑龙江的粮耕价值比和种植结构多样性均处于较高水平,即当年黑龙江并未出现或暂未显现耕地“非粮化”现象且粮食作物种植结构多样性程度较高。2009年各省份耦合协调度出现勉强、低度、中度3种状态。勉强耦合协调区集中分布于东南沿海并向内陆扩张;低度耦合协调区主要分布于东部沿海、中部、西南沿线;中度耦合协调区迅速缩减至中国北部。2014年各省份耦合协调度仍为3类,勉强耦合协调区扩张至南部及环渤海等地;低度耦合协调区横向分布于中部地区;中度耦合协调区分布于宁夏和黑龙江。2020年耦合协调度类型不变,勉强耦合协调区由南部向内陆延展至中部区域,其余分布于环渤海地区;低度耦合协调区被陕西纵向分成东、西两个片区;中度耦合协调区分布于黑龙江和内蒙古等高纬度地区。
综合而言,2004—2020年中国各省份粮耕价值比与种植结构耦合协调度的时空特征可分为3个阶段,第一阶段为2004—2009年,耦合协调度整体空间格局以“胡焕庸线”为界,由“西高东低”逐步向“北高南低”的特征转变;第二阶段为2010—2014年,耦合协调度的空间分布整体相对稳定,局部区域略有调整,低值区由东南向西南扩张,最终实现由“东西”向“南北”分异的过渡转变。第三阶段为2015—2020年,耦合协调度呈现“北高南低”的纬度阶梯状分异格局,具体为随纬度降低,耦合协调度逐渐减小,中部和南部地区均处于低度及以下耦合协调状态,且低水平耦合协调区有向北继续扩张的趋势,其中陕西受周边区域影响明显,最先由低度耦合协调转变为勉强耦合协调状态。
3.3.2 耦合协调度空间关联格局
2004—2020年中国各省份粮耕价值比与种植结构耦合协调度空间格局呈现“东北和中部高、东南和西北低”特征,具有一定空间集聚效应。因此,有必要分析粮耕价值比与种植结构耦合协调度的空间关联格局。运用全局自相关分析检验2004年、2009年、2014年和2020年耦合协调度空间关联程度的显著性(表2),结果显示
表2 全局自相关指数显著性检验
Tab. 2
| 指标 | 年份 | |||
|---|---|---|---|---|
| 2004 | 2009 | 2014 | 2020 | |
| Moran's I | 0.5118 | 0.4871 | 0.4742 | 0.5037 |
| P值 | 0.001 | 0.001 | 0.001 | 0.001 |
| Z值 | 4.2217 | 4.1528 | 3.9463 | 4.1835 |
图8
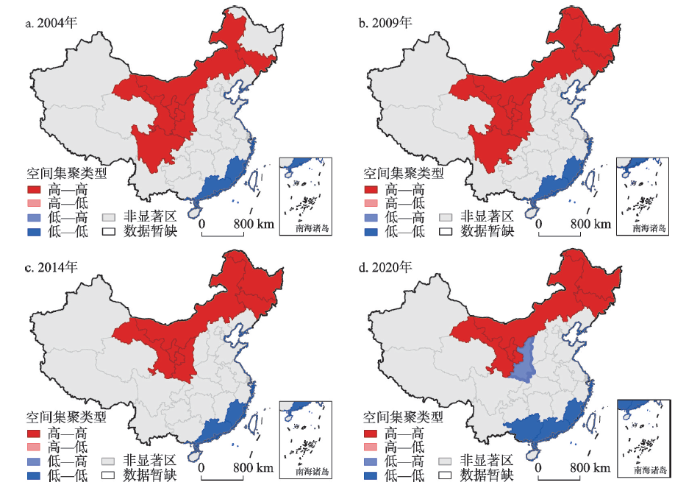
图8
2004—2020年各省粮耕价值比与种植结构耦合协调度局部空间关联
注:基于自然资源部标准地图服务网站GS(2019)1822号标准地图制作,底图边界无修改。
Fig. 8
The local spatial correlation of the coupling and coordination degree between the grain-to-arable value ratio and the cultivation structure of food crops across China’s provinces from 2004 to 2020
4 分区调控
4.1 集聚类型分区
根据中国各省份粮耕价值比与粮食作物种植结构耦合协调度的空间集聚特征类型划分结果,考虑二者耦合协调度受空间相互作用和空间扩散的影响,且空间集聚特征类型区与耦合协调度的空间溢出和辐射息息相关,分别依据高—高型、低—低型、低—高型3种空间集聚类型构建分区,以因地制宜提出差异化管制策略。高—高型和低—低型分别代表的是高/低耦合协调区域的空间集聚与溢出效应,低—高型则代表耦合协调低值区被高值区围绕的异常值。结合前文耦合协调度的空间关联格局,构建分区如下:
东北及西部的部分地区属于高—高型高度耦合,粮耕价值比与粮食作物种植结构耦合协调度较高,地区之间存在高耦合协调对周边区域的辐射与溢出现象,形成高—高型区,划定为“匹配性优势区”。南部沿海地区属于低—低型高度耦合,其耦合协调度较低且向周边地区辐射与溢出,形成低—低型区,划分为“匹配性全面改良区”。2020年陕西耦合协调度为勉强耦合协调,但被较高耦合协调度省域围绕,表现为负向空间相关,形成低—高型区,该类型区受空间极化效应的影响易转化为高—高型,应划为“匹配性局部提升区”。其余地区均为非显著区,主要集中分布于中部、东部及西北部,其自身耦合协调度介于中度水平,且其值的高低对周边相应地区的辐射与溢出现象不显著。
4.2 空间关联机制与管控
“匹配性优势区”在研究时段内粮耕价值比与粮食作物种植结构多样性均处于高水平耦合协调状态,说明其耕地粮食生产与粮食作物种植结构长期处于相辅相成的作用过程,可供其他区域借鉴。“匹配性局部提升区”种粮比较效益低下的负面作用程度更强,种植结构多样性重视程度被相对弱化,该区可通过提高种粮比较效益逐步向高匹配性转变。“匹配性全面改良区”的粮耕价值比和种植结构多样性处于低水平的耦合协调状态,且此类型对周边的负面溢出效益更明显,具体表现为勉强耦合协调区由东南沿海地区向内陆地区迅速延展。可见,随着经济产业发展和城市化建设扩张带来的种粮比较效益降低,东南沿海地区的粮耕价值比降低,粮食种植结构趋向单一化,二者低水平的耦合协调态势随经济产业一同向内陆地区转移,出现低水平空间扩散态势,且扩散速度和规模远高于匹配性优势区。这一现象将进一步导致耕地“非粮化”趋向,威胁国家粮食安全。
在分区基础上构建差异化的管制策略,针对“匹配性优势区”应从优化种粮补贴政策、创新拓宽投入资金渠道、强化技术指导与培育、完善农田基础设施的续建配套、推动数字农业与智慧农业建设等方面稳定相关省区的粮食作物种植结构与种植效益,以激励和引导农户积极种植粮食作物。针对“匹配性全面改良区”应加强粮食品质化与结构多样化结合,从种粮扶持、技术指导、销售渠道、粮食品质等多角度切入,综合提升农民种粮的积极性,全面改良相关省区的粮食种植结构布局及粮食安全保障能力。具体而言,在综合考量该区自然禀赋和经济社会发展水平的基础上,出台细化种粮财政扶持、引导等相关政策,扶持种粮大户与粮食生产经营专业合作组织;引导众筹、“互联网+”等新型融资模式创新粮食产业链发展,按不同粮食作物类型划定差异化培训片区,将种粮技术深入到村、组、田块,以示范、田间观摩等方式提升培训质量;培育新型农业市场主要体现为完善农村电商基础设施建设,简化供应链,降低农产品交易成本;同时,构建分类市场将小农市场与品质市场分离,既保障小农经济又提升品质效应。针对“匹配性局部提升区”,既要助推粮食作物种植结构多样化发展,又要注重品牌产品培育、管理方式选择与维护、标准制订与遵循等,并兼顾种植结构多样化与粮食品质生产规模化,增强农业科技含量,确保土地适度规模化。一方面,农业科技创新可降低粮食对原生种植环境的门槛,例如利用生物科技创新可改善粮食产品生长环境,为培育高产优质丰富的粮食作物提供可行路径。另一方面,高质高效实施土地平整工程可完善农田基础设施及其续建配套,可提升中低产田与坡耕地质量,改善土壤健康水平,为粮食种植结构多样化,粮食产品品质化提供可行路径,引导该区向“匹配性优势区”转变。
5 讨论
5.1 结构性短缺与“非粮化”趋势亟需全面改良
随着新型冠状病毒肺炎疫情在全球扩散蔓延,各国粮食危机风险骤然上升,部分国家试图限制粮食出口以应对不确定性风险[38],面对粮食国际贸易格局的不稳定性,中国必须保证水稻、小麦、玉米、大豆等主粮的自给能力。当前水稻和小麦已实现完全自给,但玉米和大豆等主粮依然存在不同程度的缺口,其中大豆对外依赖度达80%以上,而大豆种植面积仅占粮食种植总面积的6.18%,大豆供应已形成严重的依赖性风险[39]。以此折射出的粮食生产结构化问题是中国当前粮食安全保障的薄弱环节,粮食种植结构优化调整应成为亟待关注的重要问题。另一方面,改革开放带来的经济迅速发展由沿海向内地扩散,尤其是21世纪以来,东南沿海地区经济社会发展已达较高水平,市场需求和比较效益转变促生了较明显的耕地“非粮化”问题,这一现象可被本文佐证。
2004—2020年中国粮耕价值比在整体上呈现下降趋势,而粮食播种面积却逐渐增长,原因主要在于经济作物价格涨幅要远远高于粮食作物价格涨幅,这表明粮食比较效益日趋低下的现实情况,其也成为部分地区耕地非粮化的重要原因。结合本文结果看,2004—2020年经济发达的浙江、福建、海南、广东等东南沿海地区的粮耕价值比一直维持在较低值区间,地区的粮食作物播种面积降幅也较大,其降幅值介于-0.5~0之间。具体看,福建和广东两地所有粮食作物类型的播种面积均在减少,属于耕地“非粮化”的重灾区,这些地区非农经济发展较好,居民收入和生活水平较高,对于农产品的需求更加多元化,市场需求促使耕地“非粮化”不断;同样状况也出现在其他沿海省份,浙江、海南和广西等地在耕地“非粮化”进程中,薯类、豆类等主粮种植面积出现不同程度的减少,粮食作物多样性锐减,结构性问题也较为突出。
在粮耕价值比与粮食作物播种面积双重递减的作用下,东南沿海地区耕地“非粮化”现象日益严重,与此同时受气候地形等条件的影响,区域粮食作物种植结构始终保持较为单一的模式,种粮比较效益无法实现根本提高,致使二者的耦合协调度持续处于低水平状态,且随着经济产业从沿海向内地的转移,耕地“非粮化”现象的空间扩散效应也愈发显著。故该地区需注重当地粮食作物的品质提升,并在区域条件允许的同时丰富粮食结构,以控制其对周边区域的低溢出效应,约束勉强耦合协调区域向内陆的进一步扩张。因此按照“稳定面积,优化结构,提高品质”的原则,此类地区可适度加大种粮补贴力度,在严格划定永久基本农田的基础上,推动土地流转以实现耕地粮食生产规模化经营,降低农业生产成本并提升粮食经营者收益[40];还应因地制宜,发挥南方地域自然优势,推动高标准农田建设,积极发展多样化自然生态有机农业,推广有机农业等高附加值粮食作物[41-42],以优化粮食作物种植结构和比较效益;同时扶持粮食作物产品加工业,有序引导粮食生产向高端领域延伸,促进粮食精度、深度加工,打造高效益的粮食产业链[43],将更多利润留给粮食种植经营者手中,以激发农户的种粮积极性。
5.2 经济建设与种粮效益尚待协同发展
梳理发现,上述区域粮耕价值比在2004—2009年尚且处于中高值状态,随着中西部城市化建设和多元农作物需求市场的兴起,2014—2020年各省份粮耕价值比已降至较低和低值,整体降幅尤为显著。表明2004—2020年中部和西南部地区耕地种粮比较效益低下的状况由轻度显现转为日益严重,尤以城镇化建设快速推进的重庆和农业种植结构转型的贵州等地最为典型。研究时段内,重庆市城镇化率从43.5%提升至69.5%,同时粮食作物播种面积减少20.4%,且各类型粮食作物播种面积均在减少,降幅最高的小麦播种面积减少了93.4%,表明重庆市城镇化建设和非农经济发展带来的多元化市场需求进一步降低了本地的种粮比较效益;此外,贵州粮食作物播种面积减少9.32%,粮耕价值比却从0.5687骤降至0.1583,降幅达72.16%,这与省内农业种植结构调整密不可分,并与其地貌单元复杂、喀斯特地貌发育典型[46]带来的地表崎岖破碎等特征间接相关。贵州作为中国石漠化面积最大、类型最多、程度最深的地区,21世纪以来该省为遏制石漠化持续实施植树造林、退耕还林等治理措施,同时以石漠化治理为依托调整农业产业结构,在耕地上发展茶叶、核桃、油茶、花椒等经济作物种植,有效增加植被覆盖以加强石漠化地区的生态保护与修护[47],可见经济发展和生态建设在一定程度上会加深耕地“非粮化”程度。
因此,上述地区应重点关注区域经济社会发展和自然环境特征对耕地粮食种植造成的直接影响,按照“稳定结构,提升质量,规模经营”的原则,在维系粮食作物种植结构多样性的同时,加大耕地红线管控和基本农田建设力度,并因地制宜推出土地平整和耕地规模化等整治措施,改造现有耕地质量,以提升耕地粮食产能和规模化种植水平;同时充分挖掘区域生态环境优势,开发地方特色粮食产品,打造优势特色农业产业基地,树立高品质生态粮食品牌,促进粮食产业提质增效[48];再者,同步推进农村数字基础设施建设、“农旅产业融合”和“农业+数字经济”等工作[49],借助乡村旅游开发和电子商务等数字化平台搭建农副产品与市场之间的桥梁,开拓特色粮食产品市场空间,延展粮食生产上下游产业链等[50],以提升粮食附加值和种粮比较效益,抑制耕地“非粮化”态势,保障地区粮食安全。
6 研究结论与展望
本文以2004—2020年中国省级行政单位为研究对象,在分析粮耕价值比和粮食作物种植结构二者时空演化特征的基础上,采用耦合协调度模型与空间自相关法研究二者时空耦合演化规律,并构建省级分区。主要结论如下:
(1)2004—2020年中国各省份的粮耕价值比呈现下降趋势,空间上呈现“由北向南”和“由西向东”双重递减特征。粮食作物价值在耕地经济价值中的占比逐渐下降,非粮价值比则逐渐上升,表明粮食作物的产出效益在耕地产出效益的占比逐渐下降,种粮比较效益持续走低。粮耕价值比下降从经济效益视角显化了耕地“非粮化”倾向,切实提高种粮收益是抑制“非粮化”的最有效路径。
(2)2004—2020年中国各省份粮食作物种植结构的空间格局总体呈现“胡焕庸线”沿线区域高的特征,即“东北—西南对角沿线高,西北—东南低”,越靠近该线其种植结构多样性越丰富。分区域上,东北、华北、华东等地的粮食作物种植结构多样性出现明显递减,与近年国家推进的粮食作物种植结构调整政策思路存在一定偏差。加强局部地区粮食安全管控,合理调整耕地粮食结构,一定程度上可抑制中国粮食的结构性短缺。
(3)2004—2020年中国各省份粮耕价值比与粮食作物种植结构的耦合协调度介于勉强耦合协调至高度耦合协调区间,且空间格局呈现“东北及中部高、东南及西北部低”的特征。加强粮耕价值比与种植结构的协调匹配,尤其注重对勉强和低度耦合协调地区的耕地“非粮化”防控与粮食结构合理化改善,并重视中度耦合协调区耕地“非粮化”管控,兼顾各耦合协调类型区同步优化,以有效提升中国粮食安全保障能力。
(4)2004年、2009年、2014年、2020年粮耕价值比与种植结构耦合协调度的Global Moran's I值依次为0.5118、0.4871、0.4742、0.5037,局部看中西部及东北部地区形成高—高型集聚区;南部沿海地区形成低—低型集聚区;陕西省于2020年出现异常值,成为低—高型集聚区。耦合协调度在地域分布上呈现规律性的空间集聚,可将高—高型划定为“匹配性优势区”,低—低型划为“匹配性全面改良区”,低—高型划为“匹配性局部提升区”,并建议在要素空间集聚和扩散状态的基础上构建差异化的管制策略。
囿于省级面板数据的选用,本文仅从省域层面探讨二者的耦合协调度及空间格局演化特征,之后可进一步从市、县级层面展开更为深入地研究,更精准地量化分析中国粮耕价值比的时空演化特征,以更具针对性地提出调控举措。另外,本文仅完成对粮耕价值比和种植结构的时空耦合演化、空间关联格局规律及分区构建等基础性研究,尚未深刻探析二者关系的影响机理等问题,未来可从不同研究视角拓展,更为全面地探讨粮耕价值比与粮食作物种植结构间的互动机制,并提出更为合理的耕地增粮化与粮食结构优化路径。
参考文献
Change in grain production in China and its impacts on spatial supply and demand distributions in recent two decades
DOI:10.31497/zrzyxb.20210605 URL [本文引用: 1]
近20年中国粮食生产变化特征及其对区域粮食供需格局的影响
The non-food question, causesand countermeasures of cropland
耕地“非粮化”问题、成因及对策
Challenges and strategies of the supply security of important agricultural products in China
我国重要农产品供给安全面临的挑战与对策
Strategic coordination and differential design of China's food subsidy policy in the new era
新时期中国粮食补贴政策的战略协同与差异设计
Rethinking agricultural rural development under the new pattern of domestic circulation
国内大循环新格局下农业农村发展的目标再定位与战略选择
Evaluation and spatial characteristics of arable land multifunction in southern Jiangsu
DOI:10.18402/resci.2018.05.11
[本文引用: 1]

Based on the theory of arable land multifunction and development demands of China, we created an analytical framework and classification evaluation system to evaluate arable land multifunction. We also created a spatial grid at a resolution of 1 km × 1 km covering arable land of southern Jiangsu based on survey data of land use change. We quantitatively evaluated arable land multifunction and analyzed spatial characteristics in southern Jiangsu using Fuzzy Optimization Modeling. We found that in the context of the new normalcy of economic development, the connotation of arable land multifunction is richer. Arable land function is not mono-functional (i. e., foundational production function) but composed of multiple functions, containing a production function, living function, ecological function, barrier function and culture function. In southern Jiangsu, grain production guarantee function is generally weak and the social living guarantee function is inferior in the western region. The ecological security maintenance function in southern Jiangsu is generally weak. The urban space barrier function is generally strong. The eastern region is of a high native culture bearing function. The regional differentiation of arable land multifunction was significant in southern Jiangsu. Overall, southern Jiangsu can be divided into five subareas: agricultural production dominance area, urban agriculture demonstration area, characteristic agriculture development area, efficiency agriculture construction area and green agriculture tourism area. These results provide a reference for land use practice, formulating regulatory rules of land use zoning, selecting key areas for land consolidation, and delineating permanent basic farmland.
苏南地区耕地多功能评价与空间特征分析
DOI:10.18402/resci.2018.05.11
[本文引用: 1]
研究从耕地多功能理论和国家发展现实需求出发,构建了耕地多功能解析框架和功能分类评价体系,以土地利用变更调查数据为基础,创建覆盖苏南地区全域耕地的1km×1km空间格网,以此为评价单元,采用模糊优选模型定量评价苏南地区耕地多功能并分析其空间特征。研究结果表明:① 经济发展新常态背景下,耕地功能内涵不断丰富,逐步从基础性的生产功能转向集生产、生活、生态、阻隔、文化功能于一身的多种功能;② 苏南地区耕地农业生产保障功能总体较强,社会生活保障功能西高东低,生态安全维持功能总体偏弱,城镇空间阻隔功能表现突出,苏南地区东部乡土文化承载功能较强;③ 苏南地区耕地多功能区域分异特征显著,具体可分为农业生产主导型、都市农业示范型、特色农业发展型、高效农业建设型、绿色农业观光型5种类型区,各区耕地主导功能均有所差异。研究结果可为推动土地利用分区管制规则制定、土地整治重点区域选择、永久基本农田划定等土地利用实践提供参考。
Spatio-temporal characteristics and dynamic mechanism of farmland functions evolution in the Huang-Huai-Hai Plain
DOI:10.11821/dlxb201803010
[本文引用: 1]
Taking counties as the basic unit, this paper establishes the evaluation index system of farmland functions from the dimensions of economy, society and ecology, adopts the method combining entropy weighting and multiple correlation coefficient weighting to determine the weights, and calculates the farmland function indices of each county. Subsequently, the spatio-temporal characteristics of farmland functions evolution were analyzed and the coupling relationships between the sub-functions were explored based on the coupling coordination model, simultaneously, the dynamic mechanism of farmland functions evolution was quantitatively probed by applying the spatial econometric regression analysis method in this research. Major conclusions were drawn as follows: (1) The farmland economic function generally presented a declining trend during 1990-2010. Especially, the function is strengthened in underdeveloped and agriculture dominated counties, and weakened continuously in developed areas on contrary; 60.29% of the counties decrease in farmland social function, whereas some counties, which are mostly located in the north of Zhengzhou, the west of Dezhou and Cangzhou, Yantai and Weihai, have experienced an obvious increase; The dramatic decline of farmland ecological function has occurred around Beijing, Tianjin and Jinan. Areas located in northern Henan Province and central Shandong Province has witnessed an increase of ecological function. (2) There is a significant spatial difference in the coupling degree and coordination degree of the sub-functions, and the decoupling phenomenon gradually highlights. The changes of social function and ecological function lag behind those of economic function in developed areas, but they are highly coupled in some underdeveloped areas. (3) The evolution of farmland functions in the Huang-Huai-Hai Plain resulted from the comprehensive effects of regional basic conditions and external driving factors. Furthermore, the transition of population and industry in the process of urbanization and industrialization plays a decisive role in evolution intensity and direction of farmland sub-systems including economy, society and ecology. According to the results above mentioned, agricultural modernization, industrialization and promoting the transformation of traditional agriculture should be regarded as an important engine driving the sustainable development of Huang-Huai-Hai Plain. In view of regional differentiation characteristics of farmland functions evolution, differentiated and diversified farmland use and management modes should be implemented from developed urban areas to underdeveloped traditional agricultural areas.
黄淮海平原耕地功能演变的时空特征及其驱动机制
DOI:10.11821/dlxb201803010
[本文引用: 1]
本文以县域为基本研究单元,从经济、社会及生态三个维度构建了耕地功能评价指标体系,分析了黄淮海平原耕地功能演化的时空特征,利用耦合动态度模型探讨了耕地功能间耦合关系的演变。在此基础上,利用空间计量模型,对耕地功能演化的驱动机制进行了定量分析。研究结果表明:① 1990-2010年间,冀中南及豫东地区部分欠发达县市耕地经济功能明显增强,发达的城市群及其腹地受工业化及城镇化影响较大,耕地经济功能持续下降;60.29%的县域单元耕地的社会功能下降,增强区主要集聚于郑州北部、德州及沧州西部、烟台、威海等区域;生态功能变化在空间格局上基本形成了以豫北、山东中部山地丘陵区为核心的增长区以及以环京津、环济南地区为核心的持续下降区。② 黄淮海平原耕地经济、社会及生态功能的耦合度及协调度空间差异显著,且退耦化现象日渐突出;经济发达地区耕地的社会及生态功能演化速率普遍滞后于经济功能。③ 黄淮海平原耕地的功能演化是区域本底因素与外部驱动因素综合作用的结果;城镇化与工业化进程中人口、产业的转型对耕地经济、社会及生态功能演化的强度及方向起决定性作用。并指出:黄淮海平原应激活农业现代化、产业化发展动力,促进传统农业的转型升级,充分考虑耕地功能演化的区域分异特征,实行由发达城市地区到欠发达传统农区的差异化、多元化的耕地多功能利用与管理模式。
Theory building and empirical research of production-living-ecological function of cultivated land based on the elements
DOI:10.11821/dlyj020200400
[本文引用: 1]
The rapid social and economic development led to the gradual emergence of the multi-functionality of cultivated land. However, existing studies mainly evaluate the function of cultivated land from the perspective of a single function, while the comprehensive investigation of the production-living-ecological function of cultivated land based on elements still remained in the exploratory stage. Therefore, the connotations of cultivated land, cultivated land function, and cultivated land production-living-ecological function were defined based on the systematic analysis of the cultivated land system as well as its elements, and the evaluation framework and the zoning conceptual model of the production-living-ecological function of cultivated land were theoretically constructed. The empirical results showed that the production and living functions of more than 80% of cultivated land and the ecological function of more than 60% of cultivated land were medium or above, which indicated that the degree of development and utilization of cultivated land in Nan′an City was at a high level, and there might be overlap, occupation, and agglomeration between different functions. Under the influence of natural production potential and geographical location conditions, arable land reach level and cultivated land dependence, ecological base condition and ecological protection policy, the production-living-ecological function of cultivated land showed evident regional convergence. About 50% of the cultivated land in Nan′an City had a single function, indicating that the comprehensive level of cultivated land function was still low. The area proportions of function combination models indicated that although cultivated land still provided important food security and social security, the development of cultivated land had been endangering regional ecological security. Therefore, it is necessary to take differentiated utilization, protection, and management strategies according to the spatial distribution, combination pattern, and function intensity of cultivated land functional zoning. Our study could provide theoretical and methodological support for the multifunctional utilization and management of cultivated land under the background of rural revitalization strategy and national spatial planning system construction.
基于要素视角的耕地“三生”功能理论建构与实证研究
DOI:10.11821/dlyj020200400
[本文引用: 1]
基于要素视角考察耕地功能还处于探索阶段,并且已有的耕地功能分类体系与国家乡村振兴战略及国土空间规划体系衔接性较弱。论文通过对耕地构成要素的系统分析,界定了耕地、耕地功能及耕地生产-生活-生态功能的内涵,理论上建构了耕地“三生”功能的测评框架及分区概念模型。实证表明,南安市80%的耕地生产与生活功能以及60%的耕地生态功能为中等及以上,说明耕地利用功能强度较高。耕地生产、生活与生态功能分别在自然生产潜力与地理区位条件、耕作可达水平与耕地依赖程度、生态基底条件与生态保护政策等因素的影响下,表现出较为明显的地域趋同性。南安市耕地多功能利用水平较低且耕地开发已经危及区域生态安全,为此需要依据耕地功能分区的空间分布、组合结构及功能强度采取差异化的利用、保护与管理策略。
The spatial-temporal pattern and path of cultivated land use transition from the perspective of rural revitalization: Taking Huaihai Economic Zone as an example
DOI:10.31497/zrzyxb.20200812 URL [本文引用: 1]
乡村振兴视角下耕地利用转型的时空格局及路径分析: 以淮海经济区为例
Theoretical explanation and case study of regional cultivated land use function transition
DOI:10.11821/dlxb201905012
[本文引用: 1]
Changes of cultivated land use structures including type structure, input structure, and plantation structure, could succinctly reveal change of cultivated land use function morphology. Cultivated land use function transition (CLUFT) in the process of socio-economic development, however, is currently an issue to be resolved. Based on the underlying relationship between induced production substitution and cultivated land use structure change, this paper established a comprehensive explanation framework of the CLUFT. Then, the regional CLUFT was studied with Guangdong province as a typical case area. Results show that cultivated land use functional morphology in Guangdong overall entered the interim stage of the transition from socio-economic morphology to ecological and economic morphology. Cultivated land use function in the Pearl River Delta has accomplished the transition from socio-economic morphology to ecological-economic morphology. The rest of districts of Guangdong, however, accomplished the transition from socio-ecological morphology to socio-economic morphology. Both socio-economic and institutional forces drove the CLUFT in Guangdong. Mechanism of the CLUFT behaves as cascading effects of interactions among urbanization, socio-economic development, induced production substitution, changes of cultivated land use structures, and transformation of cultivated land use function morphologies. The positive analysis above justified the comprehensive explanation framework presented in this paper. That is, changes of cultivated land use structures could effectively denote cultivated land use function transition. With socio-economic development from its primary stage to an advanced one, changes of cultivated land use structures will drive transition of cultivated land use function morphology from socio-ecological morphology to socio-economic morphology, and to ecological and economic morphology under the direct force of induced production substitution. This paper presented new knowledges on morphology and transition explanations in land use transition research. Furthermore, new knowledges on the underlying mechanism of cultivated land use transition has been developed based on rethinking of the induced production substitution in agriculture. This study is of significance to bridge the knowledge gap of cultivated land use transition among scholars, the public, and policy makers and to deepen further research on land use transition. Finally, suggestions on transformation from dryland to paddy filed in southern China and control of socio-ecological effects of cultivated land use function transition were discussed.
区域耕地利用功能转型的理论解释与实证
DOI:10.11821/dlxb201905012
[本文引用: 1]
随着经济社会发展,由耕地利用类型结构、投入结构和种植结构决定的区域耕地利用功能究竟如何转型,至今悬而未决。通过分析诱致性生产替代与3种结构演变的内在联系,构建耕地利用功能转型综合解释框架及量化方法,选取广东省为典型地区,研究区域耕地利用功能转型。结果表明:① 广东省耕地利用功能处于从经济社会型转向生态经济型转型的过渡期,但区域差异明显。其中,珠江三角洲耕地利用功能实现了从经济社会型向生态经济型的转型,东翼、西翼、山区实现了从社会生态型向经济社会型的转型;② 广东省耕地利用功能转型的人文驱动机理表现为,经济—社会和社会—体制两方面的驱动力沿“城镇化发展—经济发展水平提高—诱致性生产替代—耕地利用结构演变—耕地利用功能形态转变”的级联驱动效应;③ 耕地利用结构演变分析是耕地利用功能转型研究的有效视角。随着经济社会从初级发展阶段经历中高级到高级阶段,在诱致性生产替代作用下,耕地利用类型结构、投入结构和种植结构演变将决定耕地利用功能从社会生态型向经济社会型、生态经济型转型;④ 对土地利用转型中“型”的内涵做出了新的阐释。在诱致性生产替代理论认知基础上,对耕地利用功能“型”之转变的深层机理进行了新的探索。这对缩小学术界与公众、决策层在耕地利用转型方面的认知鸿沟,以及推动土地利用转型深入研究具有重要意义。此外,提出了中国“旱改水”及耕地利用功能转型的社会生态效应管控建议。
Transformation and driving forces of cultivated land utilization function from a multi-scale perspective in Gansu Province
DOI:10.13249/j.cnki.sgs.2021.05.018
[本文引用: 1]
Based on the theory of induced production substitution, a theoretical analysis framework of cultivated land use function transformation was constructed, and the characteristics and rules of cultivated land use function transformation in Gansu were revealed by using the comprehensive analysis method of cultivated land use function transformation at the provincial, regional and county scales. The results showed that: 1) The function of cultivated land use in Gansu Province was in the transition period from economic society type to eco-economic type. The cultivated land use function of the five regions had been transformed and presented two states. The results of the transformation of cultivated land use function in 86 counties showed four states with great differences, but the spatial distribution had certain regularity. 2) The results of functional transition of cultivated land use were significantly different at different scales, showing obvious spatial scale effect, and the smaller the scale, the more complex the differences were. 3) The driving force of cultivated land use function transformation was mainly reflected in the urbanization rate and economic level, social development and technological progress, etc. It is possible to increase income, consumption levels and improve diet structure by increasing the urbanization rate and economic development level. At the same time, rely on technological progress and policy adjustments to ensure the rational transformation of the function of cultivated land use. Finally, the paper puts forward some suggestions on the transformation management of cultivated land use function from two aspects of benefit allocation and evaluation.
多尺度视角下耕地利用功能转型及驱动力分析: 以甘肃省为例
DOI:10.13249/j.cnki.sgs.2021.05.018
[本文引用: 1]
根据诱致性生产替代理论,构建耕地利用功能转型的理论分析框架,并运用其综合分析方法从省域、区域、县域尺度揭示了甘肃耕地利用功能转型的特征与规律。结果表明:① 甘肃省耕地利用功能正处于从经济社会型向生态经济型转型的过渡期;5大区域耕地利用功能均已转型并呈现出两种状态;86个县区耕地利用功能转型结果呈现出4种状态、差异较大,但空间分布具有一定的规律性。② 耕地利用功能转型结果在不同尺度上呈现出较大的差异,空间尺度效应显著,且尺度越小其转型结果的差异越复杂。③ 耕地利用功能转型的驱动力主要体现在城镇化率与经济水平、社会发展与技术进步等方面。可以通过提高城镇化率与经济发展水平来增加收入、提升消费水平和改善饮食结构,同时,依靠技术进步、政策调节来保障耕地利用功能的合理转型。最后,从利益调配和考核评价两方面提出了耕地利用功能转型管理的建议。
Theoretical explanation and research framework of cultivated land use system
DOI:10.18306/dlkxjz.2022.07.012
[本文引用: 1]
Cultivated land use system has a great impact on global change and human well-being. This study used the theories and methods of system science to explore the concept, composition, operation, functions, and characteristics of cultivated land use system and constructed the research framework of cultivated land use system, in order to promote the deepening of land system research and solve various problems. The main conclusions are as follows: 1) Cultivated land use system is a compound natural-human system in which agricultural producers and operators invest an appropriate amount of production factors in a certain amount and quality of cultivated land to plant crops, and obtain agricultural products and corresponding benefits. Cultivated land use system consists of cultivated land subsystem, economic subsystem, and social subsystem. It has explicit and implicit structures. 2) The operation and evolution of cultivated land use system is the result of natural ecological processes, economic development processes, and social evolution processes. It also has compound, open, resilient, and multi-level characteristics. 3) The study of cultivated land use system should follow the theoretical framework of element-structure-function-mechanism-regulation. This study revealed the action mechanism of different elements from the composition and influence relationship of various elements; analyzed the structure and transformation of cultivated land use from two aspects of explicit and implicit structure; revealed the impact of functions on structure from three aspects of economic, social, and ecological functions; analyzed the operation mechanism of cultivated land use system from the adaptation and adjustment mechanism of the system to the changes of external environment, the interaction and competition substitution mechanism of system elements, the information transmission mechanism of system operation, the coordination and organization operation mechanism of cultivated land use subjects at different levels, and the emergence mechanism of cultivated land use functions; and used scenario simulation method, multi-objective optimization method, and comprehensive regulation balance method to explore regulation strategies of cultivated land use.
耕地利用系统的理论解析与研究框架
DOI:10.18306/dlkxjz.2022.07.012
[本文引用: 1]
耕地利用系统对全球变化和人类福祉具有巨大影响。论文运用系统科学的理论与方法,探究耕地利用系统的概念、构成、运行、功能和特点,并构建耕地利用系统研究框架,对于深化土地系统科学、解决耕地利用中存在的各种问题具有重要的理论和现实意义。主要结论有:① 耕地利用系统是农业生产经营者在一定数量和质量的耕地上投入适量生产要素种植农作物,进而获得农产品及相应效益的自然—人工复合系统,由耕地子系统、经济子系统及社会子系统构成,具有显性和隐性双重结构。② 耕地利用系统运行及演化是自然生态过程、经济发展过程、社会演化过程耦合行进的结果,并涌现出经济、社会、生态功能,具有复合性、开放性、韧性和多等级性等特征。 ③ 耕地利用系统研究应遵循要素—结构—功能—机制—调控的理论框架,从各要素组成、作用关系及变化特征揭示不同要素的演化特征;从显性与隐性结构2个方面探索耕地利用系统结构及其转型规律;从经济、社会和生态功能3个方面探索功能演化及其对于结构转型的响应特征;从系统对外界环境变化的适应与调整机制、系统要素的相互影响与竞争替代机制、系统运行的信息传导机制、不同等级耕地利用主体协同与组织运行机制、耕地利用功能的涌现机制剖析耕地利用系统运行机制;针对不同情景、不同目标、不同主体,运用情景模拟法、多目标优化法、综合调控平衡法探究耕地利用调控策略。
Pattern and coupling relationship between grain yield and agricultural labor changes at county level in China
DOI:10.11821/dlxb201706009
[本文引用: 1]
This paper establishes a model of coupling relationship between grain yield and agricultural labor changes, and preliminarily discusses the coupling process of the changes of grain yield and agricultural labor proportion at county level. Using county-level statistical data of farmland and agricultural labor in 1991, 2000 and 2010, two coefficients were developed to analyze the coupling relationship between grain yield and agricultural labor changes, one is grain-labor elasticity coefficient (GLEC), and the other is agricultural labor-transfer effect coefficient (ALTEC). Results showed that: (1) During the process of agricultural development transformation in China, different types of coupling relationship modes between grain yield and agricultural labor changes coexist at the same time. During 1991-2010, the number of counties with three different coupling modes, i.e., grain yield increasing and agricultural labor decreasing, both increasing of grain yield and agricultural labor and both decreasing of grain yield and agricultural labor, account for 48.85%, 29.11% and 19.74% of the total counties in the study area, respectively. Interestingly, the coupling mode of grain yield increasing and agricultural labor decreasing is mainly found in the traditional farming area of China. The coupling mode of both increasing of grain yield and agricultural labor is located in the pastoral areas and agro-pastoral ecotone in the underdeveloped western China, while the coupling mode of both decreasing of grain yield and agricultural labor is distributed in the areas experiencing rapid agricultural development transition, especially in the developed southeastern coastal China. (2) From 1991 to 2010, the number of counties which experienced a decline of agricultural labor proportion was 1961, among which 1452 counties with an increasing of grain yield, accounting for 72.38% of the total number of counties. The coupling curve between grain yield and agricultural labor proportion changes showed a stepped fluctuation, and the discrete trend of the coupling relationship was continually strengthened. (3) The mean of GLEC and ALTEC increased from -0.25 and -2.93 during 1991-2000 to -0.16 and -1.78 during 2000-2010, respectively. The changes of GLEC and ALTEC illustrated that the influence of agricultural labor changes on increasing grain yield is diminishing gradually. (4) "Hu Huanyong Line" is a significant boundary presenting the coupling relationship between grain yield and agricultural labor changes.
中国县域粮食产量与农业劳动力变化的格局及其耦合关系
DOI:10.11821/dlxb201706009
[本文引用: 1]
本文构建了中国粮食产量与农业劳动力数量变化的耦合关系模式,初步探讨了县域粮食产量与农业劳动力比重变化的耦合过程。利用全国1991年、2000年和2010年3期分县截面数据,分别建立了粮劳弹性系数和农业劳动力转移效应系数用以分析中国县域粮食产量与农业劳动力变化的耦合关系。研究表明:① 中国农业转型发展过程中,县域粮食产量与农业劳动力数量变化的耦合关系呈现多样化并存的格局,1991-2010年中国县域农业劳动力数量减少而粮食产量增加、农业劳动力数量增加而粮食产量也增加和农业劳动力数量减少的同时粮食产量也减少的县域数量占县域总数的比重分别为48.85%、29.11%和19.74%;3种耦合类型分别集中于传统农区、西部欠发达牧区和农牧交错区、东南沿海农业快速转型区。② 中国县域粮食产量与农业劳动力比重的耦合曲线呈现阶梯式波动变化,且二者耦合关系的离散趋势不断加强。③ 粮劳弹性系数和农业劳动力转移效应系数的变化表明农业劳动力变化在促进粮食增产中的作用在不断下降。④ “胡焕庸线”是中国粮食产量与农业劳动力变化耦合特征的重要分界线,塑造了二者耦合格局的主体结构。
Multiple pathways of commodity crop expansion in tropical forest landscapes
Oil palm expansion transforms tropical landscapes and livelihoods
DOI:10.1016/j.gfs.2012.10.003 URL [本文引用: 1]
Analysis of spatial differentiation characteristics and influencing factors of non-grain cultivated land in Shandong province
山东省耕地“非粮化”空间分异特征及其影响因素分析
Spatial-temporal evolution pattern and response of ecosystem service value under land use change in the Yellow River basin: A case study of Shaanxi-Gansu-Ningxia region, Northwest China
DOI:10.13287/j.1001-9332.202111.016
[本文引用: 1]
The Shaanxi-Gansu-Ningxia region is located in the upper and middle reaches of the Yellow River Basin in the Northwestern China, with vulnerable ecosystems. It is important to define the regional pattern of ecological security. The ecological and economic issues in this region deserved more investigation. By integrating land use data and the socio-economic data from 1995 to 2020, and using spatial analysis and geodetector, we investigated the spatial-temporal variations of land use and ecosystem service value (ESV) and the driving forces of spatial variations of ESV in the region. The results showed that the cultivated land and unused land in the study area were decreasing, whereas the construction land and forest land increased from 1995 to 2020. The overall ESV in the region showed a “decrease-increase” trend, which decreased by 1.2% from 1995 to 2000 and increased by 1.0% from 2000 to 2020. Grassland provided the largest ESV, contributing a prominent regulation on function and service. The results of geodetector indicated that NDVI was the dominant driving factor for the spatial variation, while temperature and per capita net income of farmers were the important factors. There were mainly 32 types of the index of driving forces with the spatial difference of ESV (<i>q </i>value) being more than 30%. The <i>q</i> value of NDVI and soil type was nearly 46%. The spatial variation of ESV in Shaanxi-Gansu-Ningxia region was affected by the interactive enhancement among natural, socio-economic factors, and policy factors.
黄河流域土地利用变化下生态系统服务价值时空演变及其响应: 以陕甘宁地区为例
DOI:10.13287/j.1001-9332.202111.016
[本文引用: 1]
黄河流域中上游的陕甘宁地区是西北生态脆弱区,在区域生态安全格局上具有重要作用,其生态经济问题值得重点关注。本研究基于陕甘宁地区1995—2020年土地利用和自然社会经济数据,利用空间分析和地理探测器等方法,研究陕甘宁地区土地利用及生态系统服务价值的时空变化特征以及生态系统服务价值空间分异的驱动机制。结果表明: 1995—2020年,陕甘宁地区耕地、未利用地呈减少趋势,建设用地、林地呈增长趋势。1995—2020年陕甘宁地区生态系统服务价值总量呈下降-上升的变化,1995—2000年减幅约1.2%,2000—2020年增幅约1.0%。草地提供的生态系统服务价值最大,调节功能价值贡献突出。地理探测器结果表明,归一化植被指数(NDVI)是生态系统服务价值空间分异的主导因子,气温和农民人均纯收入是次要影响因子;生态系统服务价值空间分异影响因素探测力(q值)达30%以上的交互组合有32种,其中,NDVI与土壤类型的q值近46%,自然、社会经济、政策因子的交互协同增强效应共同影响了陕甘宁地区生态系统服务价值在空间上的分异效果。
Land use pattern optimization and evaluation based on ESV of agro-pastoral ecotone in Northeast China
DOI:10.31497/zrzyxb.20220710 URL [本文引用: 1]
基于生态系统服务价值的东北农牧交错区土地利用格局优化与评价
Analysis on the change characteristics of ecosystem service value in northwest Hubei province: A case study of Lishan town, Sui county of Hubei province
鄂西北地区生态系统服务价值变化特征分析: 以湖北省随县厉山镇为例
Environment, Resource properties and corresponding cost of arable land resulted from grain production in China
我国粮食生产的耕地资源环境效应特征与代价分析
Spatial-temporal evolution patterns and influencing factors of "Non-grain" utilization of cultivated land in China
中国耕地“非粮化”的时空格局演变及其影响因素
On the comprehensive productive capacity and security of future agricultural resources in China
未来中国的农业资源综合生产能力与食物保障
Climate variability, crop and conflict: Exploring the impacts of spatial concentration in agricultural production
DOI:10.1177/0022343320971020 URL [本文引用: 1]
Global estimation of crop productivity and the impacts of global warming by GIS and EPIC integrations
DOI:10.1016/S0304-3800(03)00146-7 URL [本文引用: 1]
Fourier analysis of historical NOAA time series data to estimate bimodal agriculture
DOI:10.1080/01431160601086043 URL [本文引用: 1]
Evolution of crop planting structure in traditional agricultural areas and its influence factors: A case study in Hunan province
湖南省农作物种植结构演变及影响因素
Spatio-temporal changes in Chinese crop patterns over the past three decades
DOI:10.11821/dlxb201605012
[本文引用: 1]
The study aims to investigate the spatio-temporal changes in crop patterns in China since 1980. In doing so, the analysis methods of time-series trend and spatial cluster were used to cover the major eleven crops at county scale. The results indicate that (1) There are 16 kinds of crop combinations ranking in the China's top 10 during the past 30 years. Yet since 2002, the simplified cropping structure has been gradually replaced by the multiple cropping structure, which suggests an increase in the diversity index of crop patterns. In 1980, about 82.7% of China's counties have a similar crop pattern which is composed of rice, wheat, corn and their combinations, however, this pattern largely changed after 2002 due to the increase in the planting area of fruit and vegetables. (2) In the same period, rice planting area of 47% of the counties, wheat planting area of 61% of the counties of and corn area of 29.6% of the counties experience a significant decrease, while other crops show an increasing trend. As a result, rice-dominated cereal crops in China are slightly adjusted to the coexistence of rice, wheat and maize crops. In particular, maize area proportion shows a significant change, which forms a so-called "corn decreased belt” spanning from northeast to southwest of China. Urbanization had an important impact on crop patterns as fruit and vegetable planting areas rapidly grow so as to meet the increasing demands in urbanized areas. (3) Crop patterns also show an obvious spatial cluster effect in China's 1300 counties. The proportion of high cluster accounts for 2.86%, 5.64%, 6.11%, 4.53%, 1.62%, 7.77%, 8.24%, 12%, 10%, 1.41% and 9.35% of China's counties for rice, wheat, maize, soybean, fibers, cotton, vegetables, potatoes, fruits, sugars and oils, respectively. These crops are distributed in Northeast China, Xinjiang, Northern Shaanxi Plateau, Yunnan-Guizhou Plateau and the metropolis areas. This finding of this study can support the decision making in agricultural restructuring and adaptation to climate change.
近30年中国农作物种植结构时空变化分析
DOI:10.11821/dlxb201605012
[本文引用: 1]
综合运用时序变化趋势、空间集聚分析等方法,从种植结构类型和种植比例变化趋势分析了1980年以来中国县域种植结构的时空特征。结果表明:① 近30年来中国前10位的种植结构类型有16种,2002年后多元种植结构逐步替代单一型种植结构。粮食作物占优的单一种植结构类型呈逐年递减趋势,其中1980年全国82.7%的县级农业种植结构是水稻、小麦、玉米及其组合种植类型,2002年后的果蔬类型增加改变了种植结构格局。② 全国种植县中有47%的水稻、61%的小麦和29.6%的玉米的种植比例显著减少,其他作物呈现增加趋势。粮食作物由以水稻为主的格局调整为水稻、小麦和玉米共存格局,其中玉米种植面积比例在空间上变化最为显著,在中国形成北东—西南向的“玉米减少带”。种植结构调整热点的城市地区,城市化对种植结构变化影响显著,水果和蔬菜类种植比例在城市化地区快速增加。③ 种植结构变化趋势在1300个县形成空间集聚效应,水稻的高高聚集占全国县数的2.86%、小麦占5.64%、玉米占6.11%、大豆为4.53%、麻类为1.62%、棉花占7.77%、蔬菜占8.24%、薯类占12%、水果占10%、糖料占1.41%、油料占9.35%,主要分布于中国东北、新疆和沿海的城市化地区。
Temporal and spatial evolution and optimized countermeasure of crop planting structure in the Changsha-Zhuzhou-Xiangtan area in recent 30 years
DOI:10.2307/142196 URL [本文引用: 1]
近30年来长株潭地区农作物种植结构演变及优化对策
Spatio-temporal changes of crop structure in Heilongjiang province from 2005 to 2015
2005—2015年黑龙江省农作物种植结构时空演变
Spatio-temporal evolution of traditional soybean planting structure in Songnen Plain, China in 1996-2016
DOI:10.13287/j.1001-9332.201810.011
[本文引用: 1]
Under the impacts of genetically modified soybean, the planting area of traditional soybean in China has fallen sharply. Understanding the traditional soybean planting structure and dynamics in the main soybean producing areas is of great significance to China’s soybean import and export trade and safeguarding national food security. With the Landsat TM/OLI remote sensing images from 1996 to 2016, we extracted the spatial distribution information of soybean planting using random forest (RF) method based on remote sensing (RS) and geographic information system (GIS) techniques and analyzed the spatiotemporal evolution characteristics of soybean planting structure in the Songnen Plain using landscape pattern index. The results showed that the soybean planting area in the Songnen Plain was fluctuating during 1996-2016. Among the area conversion with other land-use types, the interchanges between soybean and other crop lands were the most obvious. The proportion of soybean patch area to the total crop area increased first and then decreased, while the patch density index and the resolution index decreased first and then increased. In conclusion, the spatiotemporal evolution of the traditional soybean planting structure in the Songnen Plain showed the characteristics of fluctuation in planting area, increase in fragmentation, and discrete spatial distribution. The domestic and foreign markets as well as policy guidance were the important factors afecting the traditional soybean planting structure.
1996—2016年松嫩平原传统大豆种植结构的时空演变
DOI:10.13287/j.1001-9332.201810.011
[本文引用: 1]
在转基因大豆冲击下,我国传统大豆种植面积大幅下降,研究大豆主产区传统大豆种植结构及其动态变化对我国大豆进出口贸易和保障国家粮食安全意义重大.本研究基于1996—2016年Landsat TM/OLI遥感影像,以遥感、地理信息系统技术为支撑,利用随机森林方法提取大豆空间分布信息,并结合景观格局指数分析松嫩平原大豆种植结构时空演变特征.结果表明: 1996—2016年,松嫩平原大豆种植面积呈波动变化;在与其他地物类型面积转换中,大豆与其他作物面积间的转换最明显;大豆斑块面积占作物总面积的比例呈先增后减特征,而斑块密度指数和分离度指数均呈先减后增趋势.松嫩平原传统大豆种植结构时空演变表现出种植面积波动变化、破碎度增加、空间分布趋于离散的特征;国内外市场及政策导向成为传统大豆种植结构变化的重要影响因素.
Analysis of influencing factors of rice planting area evolution in Dongting Lake Area during 1987-2017
DOI:10.31497/zrzyxb.20201015 URL [本文引用: 1]
近30年来洞庭湖地区水稻种植面积演变的影响因素分析
The spatial and temporal analysis of the comparative advantage of different rice planting pattern in Hubei province
湖北省水稻种植模式结构和比较优势时空变化
Spatio-temporal patterns of wheat and maize production under the evolution of crop planting structures in the Huang-Huai-Hai dry farmland, China
DOI:10.18402/resci.2022.03.02
[本文引用: 1]
Identifying the spatiotemporal characteristics of crop planting structure, as well as the spatiotemporal patterns of major crops production during the evolution of crop planting structure, is of great significance for the optimization of the spatial layout of crop production, and the promotion of sustainable agricultural development. Based on the data from agricultural statistical yearbooks, this study examined the spatiotemporal change characteristics of crop planting structure types in the Huang-Huai-Hai dry farmland during 2002-2018, and used the spatial autocorrelation analysis method and center of gravity model to explore the spatiotemporal patterns of the production of wheat and maize, two main crops in this region, and their changing trends during the evolution of crop planting structure. The results show that: (1) In the study period, the overall planting structure types of crops in the region changed from diversified to specialized, and the abundance of planting structure types generally showed a decreasing trend. The planting structure was dominated by wheat, maize, and their combinations, and the number of covered counties was increasing year by year. Of all counties, 43% experienced a significant increase in the proportion of wheat planting area in total crop planting areas, and the ratio was 81% for maize planting (p<0.05). (2) Traditional agricultural production areas, including the western Hebei Plain and the northwestern Shandong Province, showed significant “high-high” agglomeration characteristics of wheat and maize average yields (p<0.05), and average wheat yield in central and eastern Henan was also relatively high, but average yield of maize in the southern part of the study area was low, showing significantly “low-low” agglomerations. Although the production patterns of wheat and maize in the study area showed geographical differences, the production centers of wheat and maize in the past 20 years have been concentrated at the junction of Hebei, Shandong, and Henan provinces, indicating that in the evolution of crop planting structure, the regional production of wheat and maize had a certain temporal stability. (3) Under the guidance of the goal of “production decided by water” and sustainable use of groundwater, the proportion of wheat planting area in the Hebei Plain has decreased. After 2014, the number of wheat-maize type counties decreased, and the number of maize-wheat type counties increased. In 2018, there were no longer single wheat-type counties. The results of this study may provide data support and decision support for further optimizing crop planting structure at the regional scale in the Huang-Huai-Hai dry farmland.
农作物种植结构演变下的黄淮海旱作区小麦玉米生产时空格局
DOI:10.18402/resci.2022.03.02
[本文引用: 1]
明确农作物种植结构类型的时空演变规律、以及演变过程中主要作物的生产时空格局,对开展农作物生产布局优化工作、促进农业可持续发展具有重要意义。基于农业统计数据,探讨2002—2018年黄淮海旱作区农作物种植结构类型的时空演变特征,同时利用空间自相关、重心模型等方法探讨农作物种植结构变化过程中该区域的两种主要作物——小麦和玉米的生产时空格局及其变化规律。结果发现:①近20年,黄淮海旱作区农作物种植结构类型整体由多样化向专一化发展,种植结构类型丰富度总体呈减小趋势,以小麦和玉米及其组合为主的种植结构占有的县域数目逐年增多,43%的县域小麦种植比例显著增加,81%的县域玉米种植比例显著增加(p<0.05)。②传统农业生产地带,包括河北平原西部、鲁西北等地小麦和玉米单产呈显著“高-高”聚集特征(p<0.05),河南中东部小麦单产也呈显著“高-高”聚集特征,但研究区南部玉米单产呈显著“低-低”聚集特征。尽管旱作区内部小麦和玉米的生产格局表现出一定的地域差异性,但近20年小麦和玉米的生产重心均集中分布在河北、山东、河南三省交界处,表明在农作物种植结构类型演变的过程中,区域尺度小麦和玉米的生产具有一定的时序稳定性。③在“以水定产”和地下水可持续利用的目标导向下,河北平原的小麦种植比例有所减少,2014年以后,小麦玉米型县域数目减少,玉米小麦型增加,2018年已不存在单一小麦型县域。本文可为黄淮海旱作区区域尺度农作物种植结构优化提供数据支撑与决策支持。
Combining richness and abundance into a single diversity index using matrix analogues of Shannon's and Simpson's indices
DOI:10.1111/j.0906-7590.2006.04601.x URL [本文引用: 1]
Numerical index of the discriminatory ability of typing systems: An application of Simpson's index of diversity
DOI:10.1128/jcm.26.11.2465-2466.1988
PMID:3069867
[本文引用: 1]
An index of discrimination for typing methods is described, based on the probability of two unrelated strains being characterized as the same type. This index may be used to compare typing methods and select the most discriminatory system.
Spatial-temporal evolution characteristic of coordination between urbanization and eco-environment in Jilin Province,Northeast China
By building urbanization and eco-environment evaluation index systems, the levels of urbanization and eco-environment, and the degree of their coupling coordination of Jilin Province from 2000 to 2012 were evaluated. The level of comprehensive urbanization showed a continued growth trend, and the economic urbanization contributed the largest share. The eco-environment comprehensive level fluctuated upward. The eco-environment state, response and pressure increased faster since the implementation of the strategy of revitalizing Northeast China and other old industrial regions. Coupling coordination degree between urbanization and eco-environment increased continuously, from uncoordinated status to advanced coordinated status, changing from eco-environment lagged to urbanization lagged. The level of urbanization in central region was higher than east and west regions in Jilin Province, but its eco-environment level was low. Coupling coordination degree in Changchun was the highest, and that of Baishan was the lowest. Coupling coordination degree of Chang-Ji integrated region was always at the leading level, but the level of eco-environment lagged behind was growing since 2000. Coupling coordination degree of Siping, Liaoyuan, Songyuan and Yanbian increased, but that of Baicheng decreased.
吉林省城镇化与生态环境协调发展的时空演变特征
构建城镇化与生态环境评价体系,评价2000—2012年吉林省城镇化和生态环境综合发展水平及两者耦合协调度.结果表明: 研究期间,吉林省城镇化综合水平呈持续增长态势,其中,经济城镇化贡献份额最大;生态环境综合水平呈波动上升趋势,国家实施振兴东北战略以来生态环境状态、响应、压力都增长较快;耦合协调度呈持续增长趋势,从基本不协调发展为高级协调,由城镇化滞后型转化为生态环境滞后型.中部地区城镇化水平较高,东西部地区生态环境水平高于中部地区,长春市城镇化与生态环境耦合协调度最高,白山市最低;2000—2012年,长吉地区耦合协调度在全省一直处于领先水平,但生态环境滞后水平越来越严重,四平、辽源、松原3市和延边朝鲜族自治州的耦合协调度呈上升趋势,白城市呈现下降趋势.
Spatiotemporal differentiation characteristics of cultivated land use from persprctive of growing food crops in major grain production areas in Northeast China
粮食作物种植视角下东北粮食主产区耕地利用的时空分化特征
COVID-19 pandemic is affecting food security: Trends, impacts and recommendations
新冠肺炎疫情冲击粮食安全: 趋势、影响与应对
An analysis of dependence risk and market layout optimization for soybean import of China under the new development pattern
新发展格局下中国大豆进口依赖性风险及市场布局优化分析
China's food security governance: Development trends, challenges and improvements
中国粮食安全治理: 发展趋势、挑战及改进
New tendency of depopulated areas in Japan: Characteristics, policy measures and enlightenment
日本过疏化地区的新动向: 特征、治理措施及启示
Research on the path of coupling development of modern service industry and modern agriculture
现代服务业与现代农业耦合发展路径研究
Models and optimal path of grain industrialization based on the perspective of network organization
DOI:10.31497/zrzyxb.20210619 URL [本文引用: 1]
基于网络组织视角的粮食产业化模式与优化路径
Analysis of coupling relationship between China's urbanization and basic public services in time and space and its driving forces
中国城镇化与基本公共服务时空交互耦合关系及其驱动力分析
Evolution of Chinese industrial geography since reform and opening-up
DOI:10.11821/dlxb201910002
[本文引用: 1]
Looking back on the 40 years of reform and opening-up, Chinese industry has achieved rapid growth and development, and Chinese industrial geography has been profoundly reshaped under the profound institutional evolution environment. Chinese industry has undergone a process of spreading in the inland to agglomeration in the coastal areas and then dispersion towards the inland again. However, the geographical pattern of different types of industries is influenced by different forces, leading to differences in the spatial restructuring process. Since the beginning of reform and opening-up in 1978, Chinese industries have been increasingly more agglomerated at different geographical scales, but still much lower than the European Union and the United States. Industrial agglomeration and decentralization drive industrial migration at different scales. In spite of the heterogeneity of industries, industrial migration has generally changed from a scattered layout to an agglomeration pattern in coastal areas; and in recent years, industrial migration has gradually shifted from developed eastern provinces to central provinces, indicating a new round of industrial migration. Remarkable regional industrial entries and exits have promoted the evolution and diversification of local industries. Overall, Chinese industrial space tends to be more complex and concentrated, the links between industries are further strengthened with a more obvious "path dependence" characteristics of industrial evolution in coastal areas. Theoretically, Chinese economic reform is not only the reform of development mode, but also the reform of institutions in essence. The fundamental triple process of marketization, globalization and decentralization has introduced market forces, local forces, and global forces to reshape Chinese industrial geography. And for the study of Chinese industrial geography, besides continuing to summarize patterns and dynamics from multiple perspectives, it is necessary to reveal the deep-level mechanism of the evolution of industrial geography pattern through phenomena, and evaluate the multiple effects of the reshaping of industrial geographical pattern systematically.
1978年改革开放以来中国工业地理格局演变
DOI:10.11821/dlxb201910002
[本文引用: 1]
回顾改革开放40年,在深刻的制度变革环境下,中国工业实现快速发展,中国工业地理格局也在经济转型中得到重塑。中国工业总体上经历了从内陆扩散到沿海地区集聚,再向内陆转移的过程。但不同类型产业地理格局及变化受制于不同力量,显现出一定的行业差异性。与改革开放之初相比,中国工业在不同地理尺度上呈现出明显的集聚趋势,但集聚程度较欧盟和美国低。产业的聚集与分散驱动不同尺度下的产业迁移,导致区域产业频繁进入和退出,促使地方产业呈现多样化态势,推动中国工业地理格局演变。从经济转型的视角出发,改革开放可概括为市场化、全球化和分权化三个过程,这些过程创造市场力量,激活地方力量,引入全球力量,共同重塑了中国工业地理格局。
Features of soil and water loss and key issues in demonstration areas for combating Karst rocky desertification
DOI:10.11821/xb201207002
[本文引用: 1]
Very little information on water and soil loss in karst areas is available. Moreover, traditional methods of assessing soil loss are difficult to apply to this area. In this paper the authors analyze the features of water and soil loss based on location monitoring during the five years (2006-2010), in demonstration areas for combating karst rocky desertification (KRD). The following conclusions are obtained. (1) Soil erosion showed a decreasing trend after a series of comprehensive treatments in the three study regions, and erosion was macroscopically mitigated in terms of landform types. (2) The slope cropland is distributed extensively in Yachi mountain region and erosion is thus serious. With better natural conditions and ecological economy development, erosion in Hongfenghu basin is relatively weak. Due to the severely poor soil cover, the amount of soil erosion is extremely low in Huajiang gorge. (3) Ecologic rehabilitation is the key to combat KRD. Closing hillsides to facilitate afforestation and water conservation are effective measures for the mitigation of soil and water loss. Grassland and economic forests bring both economic and ecological benefits. (4) KRD degrees differ greatly in slope gradient and soil layer. Further classification for soil erosion in karst areas should be proposed based on KRD degrees. (5) Hazard evaluation of subterranean soil loss is one of the tough tasks at present. However, control of key parts such as sinkholes is the efficient way to prevent subterranean loss.
典型喀斯特石漠化治理区水土流失特征与关键问题
Current situation analysis and countermeasures of rocky desertification control in southwest Karst region: A case study of Qianxinan prefecture in Guizhou province
西南喀斯特地区石漠化治理现状分析与对策研究: 以贵州省黔西南州为例
The opportunity and challenge of China's food security under dual circulation development pattern
“双循环”下我国粮食产业的机遇与挑战
Rural digitalization, human capital and integrated development of rural industries: Empirical evidence based on China provincial panel data
农村数字化、人力资本与农村产业融合发展: 基于中国省域面板数据的经验证据
Digital technology drives high-quality development of agriculture and rural areas: Theoretical interpretation and practical path
数字技术驱动农业农村高质量发展: 理论阐释与实践路径
