

1 引言
农产品是人类食物消费的重要来源[6],与之相关的农业生产[7⇓⇓⇓-11]、农业政策[12-13]、农产品贸易[14-15]等议题是粮食安全研究的重要关切。大量研究显示,农产品贸易的变化可以通过价格、收入、生产等多重渠道对粮食安全的不同维度产生复杂影响[16-17]。首先,进口扩大可以直接增加粮食供应的数量和种类,增强对食物营养的利用能力[18],一部分学者关于贸易开放对粮食安全影响的定量评估支持了这方面的论点[16]。其次,全球供应增加促进粮食价格下降,以及出口增加带来的收入增加、就业等宏观经济效益,有助于提高消费者的购买和获取能力[19]。第三,在稳定性方面,通过进口可以调节供应和价格的季节波动,缓解国内粮食减产等供应风险。Dorosh的研究表明,贸易开放帮助孟加拉国在国内生产短缺后迅速增加粮食供应,稳定了价格水平[20]。除上述积极影响外,部分研究同时观察到贸易对粮食安全的消极作用。短期来看,进口农产品存在因国际市场价格上涨带来的供应和获取的风险,生产和出口则需面对贸易壁垒带来的不利后果。中长期来看,可能带来国内生产和消费结构的不利变化,加剧粮食安全在面对外部冲击时的脆弱性。Moseley等对冈比亚和科特迪瓦的研究发现,两国在20世纪80年代推行贸易自由化改革后,亚洲廉价大米涌入当地市场并逐渐成为主食,导致他们在2007—2008年经历了严重的粮食危机[21]。
可见,农产品进出口的增加或减少会引起国内市场的供需和价格波动,进而通过劳动力、资本、生产和饮食结构的复杂变化,对粮食安全产生或积极或消极的影响。党的“十八大”以来,党中央确立了“以我为主、立足国内、确保产能、适度进口、科技支撑”的国家粮食安全战略;2015年《中华人民共和国国家安全法》将粮食安全上升为国家安全战略;“十四五”规划首次将粮食安全纳入五年规划,强调在保障国内粮食生产的同时积极营造更安全的国际贸易环境,充分利用国内国外两个市场、两种资源。在一系列政策支持下,中国农业快速融入世界市场,农产品贸易规模不断扩大。但近年来中美贸易摩擦、新型冠状病毒肺炎疫情、局部战争、极端天气等不确定事件频发,使中国农产品国际贸易和粮食安全面临重大挑战。因此,在国家层面厘清农产品贸易的动态变化及对粮食安全的影响,对中国制定合理的贸易和农业政策、推动贸易对粮食安全发挥促进而非阻碍作用,具有重要的现实意义。
已有对中国农产品进出口格局与粮食安全的研究发现,农产品贸易规模不断扩大,加入世界贸易组织后逆差持续增长,粮棉油糖等大宗农产品全面净进口[22⇓-24]。大宗农产品等进口的增加被认为在缓解国内农业生产的水、土资源约束方面对粮食安全具有积极作用[25⇓-27],但长期将形成巨大的耕地资源潜在供给缺口[28]。市场格局方面,贸易伙伴国日益增多,市场逐渐多元化[24,29⇓⇓ -32],新近对稻谷、小麦、玉米、大豆进口市场变化的研究认为中国粮食进口渠道的多元化进程加速,规避进口渠道单一带来市场风险的能力增强[33]。在既往文献的观点中,或将农产品划分为谷物、蔬菜等大类,或选择大米、小麦等主粮进行分析,这不利于当前消费多样化转向下对全面的农产品细类进行国际贸易观察,在时间和空间尺度上也尚未形成与全球所有国家进出口关系长期演化的有效表达。此外,现有研究主要关注进口程度大小对粮食安全的影响,关于农产品贸易结构对粮食安全影响的系统探讨较为不足,且主要为描述性分析。基于此,本文运用全球和国家层面的数据,通过对中国农产品国际贸易的产品结构和地理格局的长期演化进行分析,解释其对中国粮食安全所产生的影响。
2 数据与方法
2.1 数据
2.1.1 农产品范围界定
表1 本文的农产品范围
Tab. 1
| 章 | 商品编码 | 章 | 商品编码 | 章 | 商品编码 | 章 | 商品编码 |
|---|---|---|---|---|---|---|---|
| 1 | 0101~0106 | 7 | 0701~0714 | 12 | 1201~1202, 1204~1212 | 19 | 1901~1905 |
| 2 | 0201~0210 | 8 | 0801~0814 | 15 | 1501~1502, 1504, 1506~1517 | 20 | 2001~2009 |
| 3 | 0301~0307 | 9 | 0901~0904, 0906~0910 | 16 | 1601~1605 | 21 | 2101~2106 |
| 4 | 0401~0410 | 10 | 1001, 1003~1008 | 17 | 1701~1704 | 22 | 2201~2209 |
| 5 | 0504 | 11 | 1101~1109 | 18 | 1801, 1803~1806 | 24 | 2401~2403 |
2.1.2 数据来源
研究数据分为两部分(表2):① 农产品贸易结构分析所使用的中国对各国159种农产品的年进/出口额与年进/出口量,研究周期为1992—2020年,暂未含港澳台的数据;② 农产品贸易结构对粮食安全影响分析所使用的各项经济社会数据。
表2 数据及来源
Tab. 2
| 数据名称 | 数据来源 |
|---|---|
| 农产品年进/出口额 | UN Comtrade Database ( |
| 农产品年进/出口量 | UN Comtrade Database ( |
| 人均每日膳食能量供应 | FAOSTAT ( |
| 中国实际GDP年增长率 | PWT10.0 ( |
| 居民消费水平指数 | 国家统计局 ( |
| 消费者价格通胀率 | WDI ( |
| 人均农作物产量 | FAOSTAT ( |
| 谷物单产 | FAOSTAT ( |
| 人均猪肉消费量 | 《中国统计年鉴》,1993—2020年 |
| 人口数 | 《中国统计年鉴》,1993—2020年 |
| 年出栏生猪50头以下的场(户)数 | 《中国畜牧兽医年鉴》,2008—2020年 |
| 农作物播种面积 | 国家统计局 ( |
2.2 农产品贸易结构演化分析
2.2.1 可比净出口指数
式中:NTBit、EVit、IVit分别表示第i种商品在第t年的可比净出口指数值、对世界市场总出口额和总进口额。NTB的值为[-1, 1],当NTB > 0时,表明该国是该商品的净出口国,且其值越大,净出口程度越强;当NTB < 0时,表明该国是该商品的净进口国,且其值越小,净进口程度越强;当NTB = 0时,表明该国在该商品上进出口平衡。
2.2.2 贸易集中度指数
式中:计算产品集中度时,HIt代表第t年农产品进/出口的产品集中度指数;Xit和Xt分别表示第t年第i种农产品的进/出口额和第t年农产品进/出口总额。计算地理集中度时,Xit和Xt分别表示第t年中国对第i国农产品的进/出口额和第t年农产品进/出口总额。HIt的取值范围为[1/
2.2.3 希尔伯特曲线可视化
为有效表达研究结果,本文引入基于希尔伯特曲线和颜色空间的可视化方法帮助分析农产品贸易的产品结构特征[40]。首先分别计算所有农产品1992—2020年NTB的均值及其标准差(Standard Deviation, SD),用以表征农产品进出口的程度和波动情况。根据所得结果,使用相等间隔分类法,将净出口强度分为强进口、弱进口、相对平衡、弱出口和强出口5个等级,同样地,波动水平由低到高分为5级(图1a)。根据分级结果,构造颜色空间,规定红、黄、绿、蓝、紫不同色系分别对应不同的进出口程度;同一色系中色调的饱和度则对应不同的波动水平,颜色越深,波动程度越高。其次,利用希尔伯特曲线将HS编码数据所代表的农产品映射到二维空间中(图1b),表示为159个面积相同的正方形,并根据净出口和波动性分级结果使每一个方形映射到颜色空间中的一个颜色。HS编码相邻的商品在二维空间图中也相邻,据此可依据Hilbert曲线的走向判断每一个方形所代表的农产品的HS编码及其进出口和波动水平。
图1
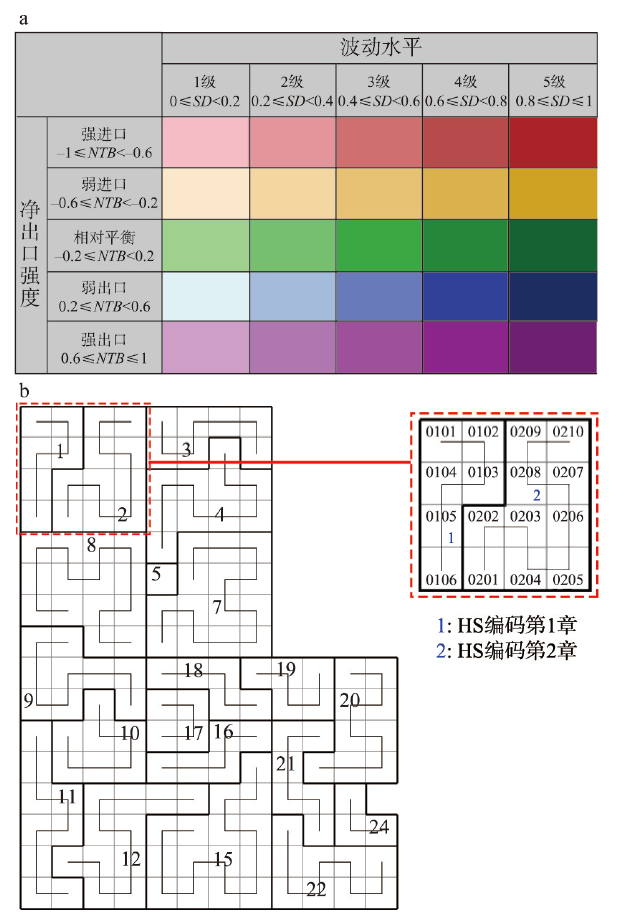
图1
农产品分级结果与颜色空间(a)和希尔伯特曲线(b)
Fig. 1
Classification of agricultural products and color space (a); Hilbert curve (b)
2.2.4 时空多元可视化
时空多元模式可视化系统(A Visualization System for Space-Time and Multivariate Patterns, VIS-STAMP)是一种用于探索和理解包含地理位置、时间序列和多个变量的高维复杂数据集的时空和多元模式的地理视觉分析方法[41-42]。首先,利用自组织映射(Self-Organizing Map, SOM)对高维数据进行降维、聚类,抽象出多元数据模式,继而使用二维配色方案为每个SOM节点(集群)分配一个颜色,相似的集群具有相似的颜色。其次,利用平行坐标图(Parallel Coordinate Plot, PCP)对SOM所确定的数据集群进行可视化表达。PCP在时空多元可视化系统中充当图例,解释SOM中每种颜色的含义,也即每个集群的特征。完成多元变量的可视化后,利用一个可重新排序的地图矩阵来显示多元模式的空间变化。
本文利用该方法分别对重点进口农产品和重点出口农产品市场格局的时间趋势进行分析,时间跨度均为1992—2020年,共29年,空间上包括198个国家/地区,变量值为中国对某个国家/地区某种农产品年进口额/年出口额占中国该种农产品年总进口额/年总出口额的比重。对时间序列进行自组织聚类,抽象出在不同农产品上各国占中国进出口市场份额随时间变化的模式,以此展示中国主要农产品进出口市场的空间格局演变。
2.3 时间序列回归
本文采用时间序列线性回归的方法分析农产品贸易结构对粮食安全的影响。被解释变量为人均每天可获得的膳食能量供应(Y),研究发现人均热量供应的增加与营养不良发生率的降低密切相关[43-44],是粮食安全的核心指标,也是最常用的定量指标之一[18]。解释变量为中国农产品贸易结构,包括总量结构(X1),以总进口额与出口额之比表示,进口产品集中度(X2),出口产品集中度(X3),进口地理集中度(X4),出口地理集中度(X5)。并引入中国实际GDP年增长率(X6)、居民消费水平指数(X7)、消费者价格通胀率(X8)、人均农作物产量(X9)、谷物单产(X10)对粮食安全进行综合解释。X6是国家层面的背景变量,用以捕捉经济增长的变化情况;X7、X8代表居民的消费水平和价格变化,对粮食安全的获得性和稳定性产生影响;X9、X10是国内农业生产力和生产率的指标,是粮食供给水平的重要影响因素。由于Y的最新数据为2018年,因此研究时间取1992—2018年。
为消除异方差的影响,对各时间序列变量取自然对数,建立回归模型为:
表3 平稳性检验结果
Tab. 3
| 变量 | ADF值 | 检验类别 | 1%临界值 | 5%临界值 | P值 | 变量 | ADF值 | 检验类别 | 1%临界值 | P值 |
|---|---|---|---|---|---|---|---|---|---|---|
| LNY | -4.3792 | C, T, 3 | -4.3561 | -3.5950 | 0.0095 | DLNY | -4.6003 | C, 0, 0 | -3.7241 | 0.0013 |
| LNX1 | -4.6902 | C, T, 2 | -4.3743 | -3.6032 | 0.0050 | DLNX1 | -6.7601 | C, T, 0 | -4.3943 | 0.0001 |
| LNX2 | -2.0096 | C, 0, 2 | -3.7115 | -2.9810 | 0.2811 | DLNX2 | -5.3929 | C, 0, 0 | -3.7241 | 0.0002 |
| LNX3 | -5.3789 | C, T, 2 | -4.3561 | -3.5950 | 0.0010 | DLNX3 | -5.3039 | C, 0, 3 | -3.7379 | 0.0003 |
| LNX4 | -2.9468 | C, 0, 2 | -3.7115 | -2.9810 | 0.0536 | DLNX4 | -5.6757 | C, 0, 3 | -3.7241 | 0.0001 |
| LNX5 | -2.3687 | C, T, 2 | -4.4679 | -3.6450 | 0.3833 | DLNX5 | -3.7369 | 0, 0, 0 | -2.6607 | 0.0006 |
| LNX6 | -2.5537 | C, 0, 2 | -3.7115 | -2.9810 | 0.1152 | DLNX6 | -4.9756 | C, 0, 5 | -3.7379 | 0.0006 |
| LNX7 | -1.5690 | C, T, 2 | -4.3561 | -3.5950 | 0.7775 | DLNX7 | -5.4007 | C, 0, 0 | -3.7241 | 0.0002 |
| LNX8 | -2.3496 | C, 0, 3 | -3.7115 | -2.9810 | 0.1651 | DLNX8 | -5.1150 | C, 0, 0 | -3.7241 | 0.0004 |
| LNX9 | -3.7336 | C, T, 4 | -4.4407 | -3.63289 | 0.0412 | DLNX9 | -6.6975 | C, T, 0 | -4.3743 | 0.0001 |
| LNX10 | -3.0024 | C, T, 0 | -4.3561 | -3.5950 | 0.1505 | DLNX10 | -6.5163 | C, T, 3 | -4.3743 | 0.0001 |
表4 协整检验结果
Tab. 4
| 变量 | ADF值 | 检验类别 | 1%临界值 | 5%临界值 |
|---|---|---|---|---|
| ecm | -7.2074 | C, 0, 0 | -8.2664 | -7.1520 |
注:“1%临界值”和“5%临界值”由麦金农响应面函数表(参见文献[
3 农产品贸易结构演化及重点农产品识别
3.1 总量结构变化
中国农产品进口额由1992年的33.60亿美元增长到2020年的1540.67亿美元,出口额由74.80亿美元增长到566.86亿美元,进出口均取得快速发展,但进口增速明显高于出口增速。将1992—2020年中国对世界市场159种农产品的NTB值绘制成箱线图观察农产品进出口的总体趋势。箱线图由上至下5条线分别标示了一组数据的最大值、上四分位数、中位数、下四分位数和最小值。由图2可见,中位数和上下四分位数均呈波动下降的趋势,2008年以后箱体开始由偏最大值转向偏最小值分布,这表明农产品进出口状态虽有年际波动,但总体格局发生转变,越来越多的农产品出口优势减弱甚至转变为进口状态,对国际进口的依赖显著增强。
图2
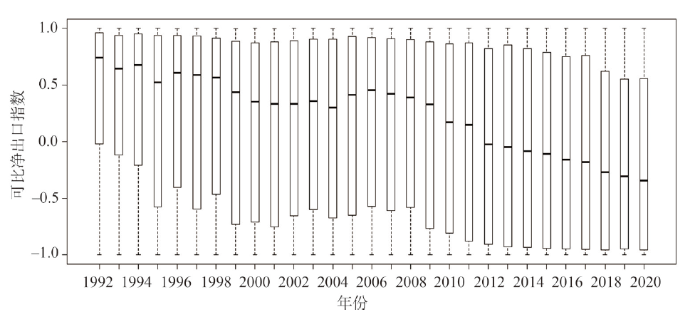
图2
1992—2020年中国农产品可比净出口指数箱线图
Fig. 2
Boxplot of China's agricultural normalized trade balance index in 1992-2020
3.2 产品结构变化
根据产品集中度指数的计算结果(图3)可见,进口产品集中度指数较高,表明农产品进口结构较为单一,主要集中于某几类产品。如2020年进口额前10位的农产品占总进口额的60%,仅大豆与猪肉进口额即占总进口的33%。出口产品集中度指数低于进口集中度,产品结构较进口更加多元化。从时间趋势来看,进口经历了波动上升至2008年以后逐渐下降的过程,表现出多样化的发展趋势;出口集中度平稳中略有下降。
图3
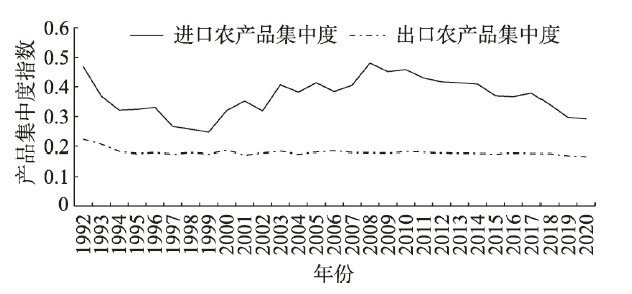
图3
1992—2020年中国农产品进/出口产品集中度
Fig. 3
Concentration of China's agriculture product imports/exports in 1992-2020
农产品进出口程度和波动水平显示(图4),1992—2020年间稳定的进口农产品主要包括:猪、牛、马、驴、骡、家禽等活动物(01)及其肉和杂碎(02),乳品(0401~0406),小麦、大麦、燕麦、大豆(1001,1003~1004,1201),动植物油脂(15),糖、可可及其制品。稳定的出口农产品主要包括:鱼类及其他水生动物(03),蛋品和蜂蜜(0407~0410),蔬菜(07),苹果、梨及柑橘等水果(08),茶及调味香料(09),花生、葵花子等部分油料,肉、鱼及其他水生动物制品(16),谷物和面粉制品(19),蔬菜和水果制品(20),杂项食品(21),烟草(24)。部分谷物如大米,以及咖啡、啤酒等则处于进出口相对平衡的状态。
图4
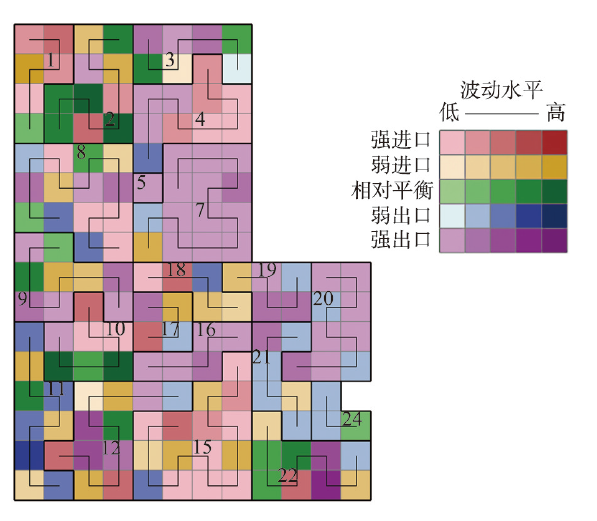
图4
农产品净出口程度与波动水平分级结果
Fig. 4
Net export degree and volatility level of agricultural products
另一类值得关注的是图4中深色方块代表的进出口波动性较高的农产品(SD > 0.6),结合此类产品历年NTB和进/出口额数据分析发现:① 麦芽(1107)前期净进口,后期转变为稳定的强出口产品;② 相反地,部分农产品早期表现为强出口或以出口为主,后期进口额大幅增加,出口额减少,转变为稳定的强进口状态,如猪、牛、家禽肉等主要食用肉类(02),玉米和高粱等谷物(1005,1007),谷物粉(1102~1103),油菜籽等植物油籽(12),花生油、葵花油(1508,1512),部分鱼类(0302),木薯等植物根茎(0714),马黛茶(0903)等(图5);③ 山羊和绵羊(0104),丁香(0907),糖蜜(1703)等多年间净进口和净出口状态交替出现。
图5
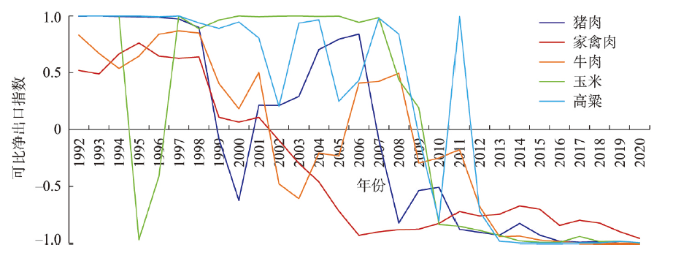
图5
高波动性农产品的可比净出口指数
Fig. 5
Normalized trade balance index of agricultural products with high volatility
3.3 重点农产品识别
根据上述结果,结合农产品进/出口量及虚拟耕地进口量指标识别出11种重点进口型农产品和10种重点出口型农产品[26-27,46],对此类农产品进/出口市场空间格局的时间趋势进行分析(表5)。进口农产品方面,本文将1992—2020年年均进口量大于20万t且虚拟耕地年进口量大于20万hm2的强进口产品(-1 ≤ NTB < -0.6)以及波动性强且由净出口转变为强进口的农产品作为重点关注的产品。这是由于进口程度高的农产品容易受到全球市场波动带来的不利影响,而进口量大、虚拟耕地含量高使得其在面对不利冲击时难以通过国内生产取得缓解。出口农产品方面,出口程度高的农产品既是优势出口农产品,同时对国际市场的依赖也较大。而出口量大的该类农产品在遭遇国际市场的不利变化导致出口受阻时,通过内需或其他渠道分散风险的难度较大,从而给以出口为导向的农业生产部门带来困境[47]。因此,取NTB ≥ 0.6处于强出口状态,年均出口量位于前20的初级农产品为代表,作为重点出口农产品。
表5 重点农产品识别结果
Tab. 5
| 重点进口农产品 | 重点出口农产品 | ||||||
|---|---|---|---|---|---|---|---|
| 商品名称 | NTB均值 | 年均进口量(t) | 虚拟耕地年均进口量(hm2) | 商品名称 | NTB均值 | 年均出口量(t) | |
| 大豆 | -0.7401 | 37672488 | 20118772 | 葱属蔬菜 | 0.9985 | 1579111 | |
| 豆油 | -0.8565 | 1192725 | 1854432 | 梨和苹果 | 0.8695 | 942642 | |
| 棕榈油 | -0.9908 | 3826729 | 1526204 | 鱼肉 | 0.9256 | 608082 | |
| 油菜籽 | -0.7916 | 1778739 | 1004452 | 柑橘类水果 | 0.6065 | 529035 | |
| 小麦 | -0.7014 | 3530148 | 825017 | 萝卜 | 0.9970 | 373055 | |
| 大麦 | -0.9892 | 3045862 | 806210 | 甘蓝类蔬菜 | 0.9938 | 299709 | |
| 猪肉 | -0.0755 | 509081 | 441552 | 花生 | 0.7426 | 274000 | |
| 菜子油 | -0.8997 | 573530 | 523656 | 姜 | 0.9357 | 265043 | |
| 糖 | -0.6215 | 2535251 | 329685 | 茶 | 0.9382 | 255573 | |
| 高粱 | 0.1661 | 1436901 | 270841 | 马铃薯 | 0.9656 | 215228 | |
| 玉米 | 0.0910 | 1695986 | 244663 | ||||
注:虚拟耕地进口量的计算方法参考文献[
4 农产品贸易空间结构的演化
中国农产品出口地理集中度随时间明显下降,多元化趋势显著;农产品进口地理集中度指数变化较小,但2008年以后也经历了一个缓慢的下降过程,进口多元化趋势有所显现(图6)。下文将以重点进/出口农产品为代表对进/出口空间格局进行详细分析。
图6
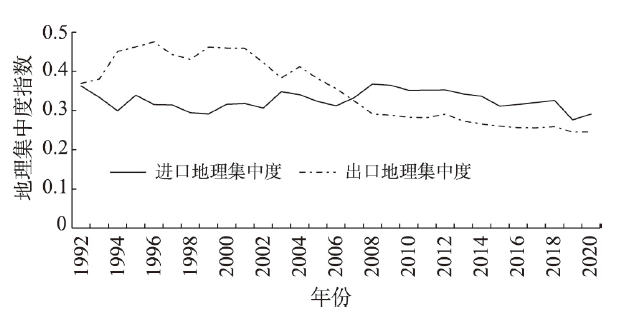
图6
1992—2020年中国农产品进/出口地理集中度
Fig. 6
Import/export spatial concentration of China's agricultural products, 1992-2020
4.1 进口市场高度集中,成长型地区逐渐浮现
图7
图7
1992—2020年中国主要农产品进口市场的演变趋势
Fig. 7
Change of China's agricultural import markets, 1992-2020
图8
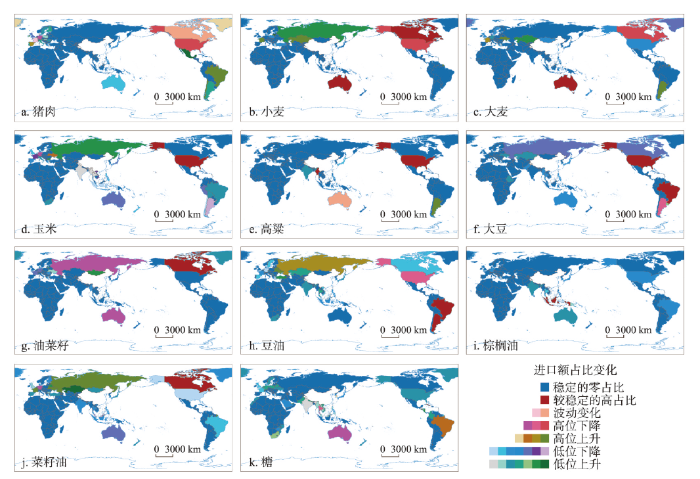
图8
1992—2020年中国主要农产品进口市场的空间格局演变
注:基于自然资源部标准地图服务网站审图号为GS(2016)1665号的标准地图制作,底图边界无修改,后图同。
Fig. 8
Spatial evolution of China's main agricultural import markets, 1992-2020
具体来看,① 猪肉的主要进口市场是美国、加拿大、德国、西班牙,近年来西班牙进口占比超越美国,且对丹麦、法国等其他欧洲国家及巴西的进口也呈上升趋势。② 谷物类农产品方面,小麦的主要进口来源国是加拿大、澳大利亚和美国,三国占中国小麦年进口比例的均值为93.17%,此外,哈萨克斯坦表现出明显的增长之势。大麦的主要进口国是澳大利亚,其次为加拿大,法国、乌克兰占比有所增长。玉米和高粱的最大进口来源地发生了转变,前者由美国转移到乌克兰,并增加对缅甸等东南亚国家的进口;后者首要进口国由缅甸转变为美国,澳大利亚在不同年份的进口占比频繁波动。③ 中国对美国、巴西、阿根廷三国的大豆和豆油占总进口额比例的均值分别达95.58%和90.41%。2012年后大豆最大进口市场由美国转移到巴西;豆油的进口市场格局则展现出更多元化的发展趋势,乌克兰、俄罗斯等欧洲国家所占份额持续增长。④ 油菜籽和菜籽油的最大进口来源国是加拿大,部分欧洲国家所占份额有所上升,但增长极为缓慢。⑤ 棕榈油和食糖进口主要集中在具有相关自然资源禀赋优势的国家,棕榈油进口高度集中于印度尼西亚和马来西亚,食糖主要进口国为巴西和古巴。
4.2 出口市场趋于多元化,“一带一路”带动效应明显
图9
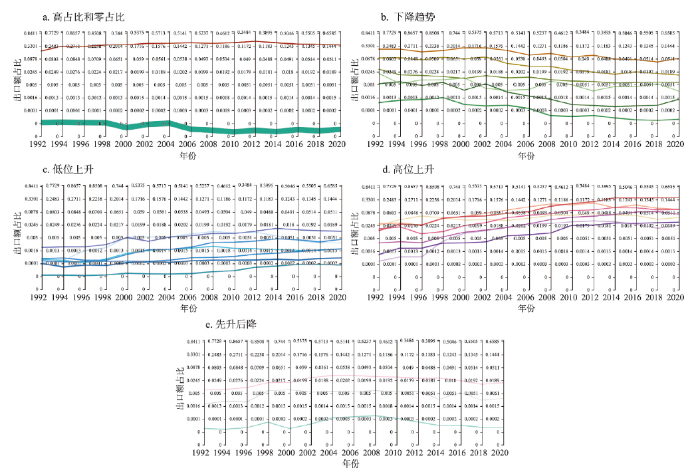
图9
1992—2020年中国主要农产品出口市场的演变趋势
Fig. 9
Change of China's agricultural export markets, 1992-2020
图10
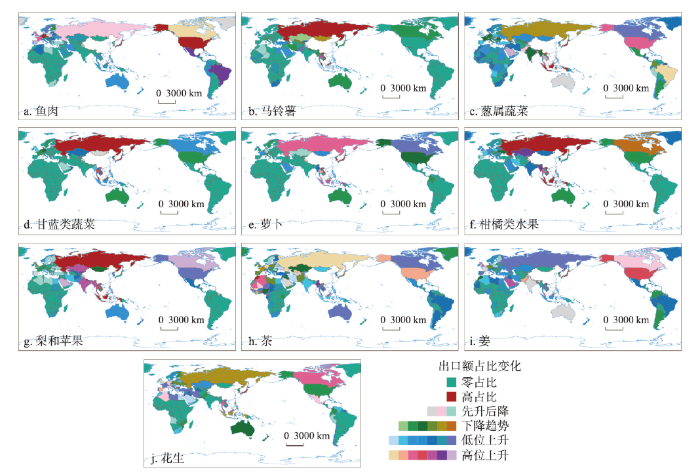
图10
1992—2020年中国主要农产品出口市场的空间格局演变
Fig. 10
Spatial evolution of China's main agricultural export markets, 1992-2020
具体来看,① 鱼肉的主要出口市场分布在日本、韩国以及美国、加拿大、德、英、法等欧美发达国家,此外,巴西、泰国等南美与东盟国家所占比例也有所增长。② 蔬菜类农产品的重要出口目的地国家为俄罗斯以及日、韩、越南、马来西亚等东亚和东南亚国家,其中马铃薯、甘蓝类蔬菜及萝卜的出口市场较为集中的分布在上述区域,而葱属蔬菜还出口到美洲、欧洲、非洲及其他亚洲国家。③ 水果类农产品的出口地主要是俄罗斯,以及印度尼西亚、越南等东盟国家,并在西亚、中亚等地拥有众多快速增长的出口市场。④ 茶和姜的出口市场分布极为广泛,如茶的重要出口市场包括美国、加拿大等北美国家,摩洛哥、阿尔及利亚等北非和西非国家,俄罗斯等欧洲国家,韩国、马来西亚等东亚和东南亚国家,以及澳大利亚、巴西等南美国家也呈持续增长的趋势。⑤ 花生的最大出口市场是日本,加拿大、西班牙、泰国和越南所占比例迅速增加。
5 农产品贸易结构演化对粮食安全的影响
5.1 岭回归结果
由表6可见,贸易结构变量方面,贸易总量结构对粮食安全具有正向作用,且通过5%的显著性水平检验,出口产品集中度具有显著的负向影响。进口产品集中度与进/出口地理集中度虽未通过统计学意义的显著性检验,但根据系数判断,它们对粮食安全具有负向效应。其他社会经济变量中,人均农作物产量、居民消费水平指数、实际GDP年增长率与谷物单产均对人均膳食供应的增加起正向推动作用,其中人均农作物产量、居民消费水平的影响最大。消费者价格通货膨胀率对粮食安全表现为负向影响关系,表明宏观经济价格不稳定对粮食安全的负面效应。
表6 岭回归估计结果
Tab. 6
| 变量 | 系数 | 标准误差 | 标准化系数 | t统计值 | p值 |
|---|---|---|---|---|---|
| 贸易总量结构 | 0.020 | 0.020 | 0.156 | 2.162 | 0.046* |
| 进口产品集中度 | -0.009 | -0.009 | -0.021 | -0.449 | 0.659 |
| 出口产品集中度 | -0.171 | -0.171 | -0.127 | -3.179 | 0.006** |
| 进口地理集中度 | -0.024 | -0.024 | -0.021 | -0.530 | 0.604 |
| 出口地理集中度 | -0.010 | -0.010 | -0.030 | -0.439 | 0.667 |
| 实际GDP年增长率 | 0.087 | 0.087 | 0.041 | 1.424 | 0.174 |
| 居民消费水平指数 | 0.037 | 0.037 | 0.315 | 3.757 | 0.002** |
| 消费者价格通胀率 | -0.004 | -0.004 | -0.043 | -1.496 | 0.154 |
| 人均农作物产量 | 0.207 | 0.207 | 0.430 | 5.555 | 0.000** |
| 谷物单产 | 0.000 | 0.000 | 0.001 | 0.006 | 0.995 |
注:R2 = 0.993,F值= 241.242,sig.(F) = 0;*p < 0.05,**p < 0.01。
5.2 对粮食安全的影响
(1)农产品贸易总量结构以进口的快速增长为特点,促进了粮食安全改善。根据中国农产品贸易的现实情况,贸易总量结构的变化主要表现为进口的快速增长。进口增长一方面可以直接增加国内食物供应的数量,以满足消费需求,从而改善粮食安全。以猪肉为例,本文用格兰杰因果检验考察了国内猪肉需求年增长率与猪肉进口量年增长率的关系,建立VAR模型确定格兰杰因果的滞后阶为1,结果见表7。在5%显著性水平下,猪肉消费量年增长率是猪肉进口量年增长率的格兰杰原因,即国内猪肉消费的变化是导致猪肉进口变化的原因之一,体现了农产品进口在供应国内需求方面的积极作用。同时农产品进口的扩大可以增加国内农产品供应的种类,从而满足居民多样化的膳食需求。
表7 格兰杰因果关系检验
Tab. 7
| 变量 | 单位根检验 | 格兰杰检验 | |||||
|---|---|---|---|---|---|---|---|
| ADF值 | 检验类别 | 1%临界值 | 原假设H | F统计量 | H成立的概率 | ||
| 猪肉消费量年增长率 (CONSUMER) | -7.0970 | C, 0, 0 | -3.7241 | CONSUMER does not Granger Cause TRADE | 5.1380 | 0.0331 | |
| 猪肉进口量年增长率 (TRADE) | -6.1084 | C, T, 0 | -4.3561 | TRADE does not Granger Cause CONSUMER | 0.0081 | 0.9292 | |
注:猪肉消费量数据由“人均猪肉消费量”与“人口数”计算而得,时间取1992—2019年。
(2)中国农产品进口产品与空间分布双集中,不利于粮食安全保障;出口产品和空间多元化的趋势则有助于保障粮食安全的稳定性。贸易产品集中度与地理集中度均对粮食安全存在负向影响关系。根据前文分析可见,中国农产品进口具有产品与空间分布双集中的叠加效应,以大豆为例,2000年、2010年、2020年大豆进口额占农产品总进口额的比例分别为27.68%、44.25%、25.66%,3个时间里对美国、巴西、阿根廷进口占大豆进口总额的比例分别为99.2%、97.46%、97.25%。而南美和美国70%以上的大豆货源被ADM、Bunge、Cargill、和Louis Dreyfus为首的国际粮商控制,其中前三家均为美国企业。这种结构特征使得国内市场稳定性极易受美国、澳大利亚等重点进口国家消极贸易政策变化的不利影响,一旦面对这些国家出口限制等措施,一方面可能直接减少国内食物供应,另一方面通过价格等因素间接影响居民的食物获取能力,从而在短期内对粮食安全保障造成冲击。对于部分成长型地区,从29年来市场份额占比的变化来看,发展速度仍较为缓慢,与主要进口国进口额占比差距显著,分散市场集中带来的风险的能力存疑。相反地,出口产品和空间结构多元化的趋势有助于规避出口贸易壁垒带来的风险,稳定出口的经济效益,保障出口部门农业生产的稳定性。
③ 贸易对生产结构的长期影响与高度集中的进口结构相结合,将使得国内农业生产与粮食安全保障在面对外部冲击时更加脆弱。大量的进口在特定农业部门的涌入,将为国外大型农业生产者或公司带来便利,他们依靠强大的比较优势(如价格优势等)在竞争中排挤国内小型生产商或农户,难以与其竞争的国内生产者可能会压缩生产。如2007年起猪肉由出口优势转变为稳定的强进口状态,伴随这一过程2007—2010年中国年出栏生猪50头以下的场(户)数由80104750下降到59086923,大量小规模生产者退出这个行业,这一数据在2019年继续减少为21445792。观察中国农作物种植结构的变化可以发现(图11),1992—2018年重点进口农产品中大豆、小麦、油菜籽、糖料作物、高粱种植面积占比均呈下降趋势。玉米在2010年由出口转为进口后,近年种植面积占比也出现下降趋势。对大豆进口量与种植面积占比之间的Pearson相关系数进行计算,显示在5%置信水平上,相关系数为-0.445,说明二者具有显著的负相关关系,大豆进口量越大的年份,种植面积占比越低。在同一置信水平上,高粱进口量与种植面积占比之间的相关系数为-0.453。重点农产品国内生产的压缩将进一步加深国内供应对国际市场的依赖,不利于长期的供应安全。
图11
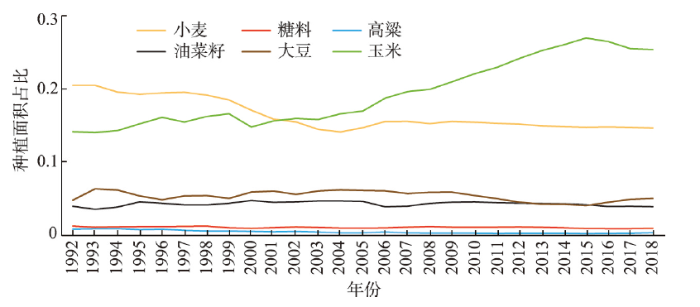
图11
1992—2018年中国农作物种植面积占比变化
Fig. 11
Changes of crops planting area proportion in China, 1992-2018
6 结论与政策建议
6.1 结论
(1)1992—2020年中国农产品贸易总体格局发生转变,包括猪肉、牛肉、玉米、高粱、油菜籽等在内的众多农产品出口优势减弱甚至转变为进口状态,对国际进口的依赖显著增强。进口的快速增长通过直接增加国内食物供应,以满足国内消费需求,对粮食安全改善产生促进作用。
(2)农产品贸易的产品结构和空间结构存在的粮食安全风险主要体现在供给侧进口端,进口产品结构和地理结构双集中的叠加效应,使得重点农产品进口极易受美国、澳大利亚等少数重要进口国家出口限制等贸易政策变化的不利影响,在短期内对粮食的稳定供应造成冲击。相反地,出口产品集中度较小,随着与“一带一路”等国家/地区贸易的发展,地理集中度也显著降低,有利于保障出口的经济效益,减小国家间贸易摩擦所造成的农业生产的不稳定性。
(3)中国农业生产出现部分重点进口产品生产规模压缩,中长期来看,将进一步削弱重要进口农产品的国内自主供应能力。这种趋势与高度集中的进口结构相结合,不利于降低农业生产与粮食安全保障在面对外部冲击时的脆弱性。
已有基于农产品大类划分的观点认为油料、谷物等属于全面净进口,但基于产品细类的分析发现,具体农产品进出口态势存在差异,如油料中花生、葵花籽等长期处于较稳定的出口状态;谷物中稻米进出口长期来看则较为均衡,且谷物制品具有出口优势。在农业生产和贸易策略上,基于细类的分析结果更具有指导的针对性。在空间格局上,进出口市场多元化趋势是共识,但本文从重点农产品市场份额占比变化的角度,认为进口市场的成长型地区发展较为缓慢,与主要进口国进口额占比差距显著,分散单一市场的抗风险能力仍有待进一步提升。此外,既往研究鲜少考虑农产品出口在家庭和个人食物获取能力方面的作用,本文认为出口产品和空间结构多元化的趋势有利于保障出口的经济效益,进而提升从事相关农业生产家庭经济的稳定性。
6.2 政策建议
随着中国农业对外开放程度不断提高,粮食安全越来越受到国际交流、对外贸易政策和全球粮食市场宏观经济的影响。特别是当前世界处于“大发展大变革大调整”的背景下[48],新型冠状病毒肺炎疫情、中美贸易摩擦、俄乌冲突等不确定事件频发,中国粮食安全面临的国际环境日趋复杂,因此建议:
(1)坚持贸易开放的同时优化进口的产品和地理结构。积极探索和利用国际市场资源保障国内粮食供应的数量和丰度,同时需要重点关注进口量大、对国内水土资源利用影响大的农产品。对这类重点农产品进行国际贸易动态和国内生产监测,其中对于小麦等口粮农产品根据国内消费需求划定生产红线,确保国内自给水平;对于其它重点农产品加速推进市场多元化的进口战略,在深度合作中提升进口市场的稳定性。利用“一带一路”等经济发展战略,“区域全面经济伙伴关系协定”等自贸区的有利条件,不断探索拓展进口来源地,如除美国、巴西、阿根廷外,加强与印度、乌克兰、俄罗斯等其他重要大豆生产国的贸易合作。
(2)坚持多元化的出口发展战略,培育更多优势出口农产品,进一步增强农产品贸易的国际竞争力。农产品出口主要通过创造就业、增加收入等途径,提高家庭和个人层面的食物获取能力,以促进粮食安全。因此,① 加强对国际市场农产品消费偏好等信息的跟踪调研,不断进行产品创新,并提高自身的技术标准和产品质量,以增强出口农产品在国际市场上的竞争力。② 对于重点出口农产品,建立农产品贸易壁垒的预警和应急处理机制,在出口面临贸易争端时,为出口方提供咨询和帮助,以减小相关贸易争端带来的损失。③ 继续强化与“一带一路”国家的出口合作,同时积极开拓非洲、拉美地区等潜在出口市场。
(3)积极引导形成合理的农产品种植结构。在保证“谷物基本自给、口粮绝对安全”的底线下,通过政策支持等途径引导生产者种植决策,调控农作物种植结构,适度增加大豆、油菜籽、糖料作物等种植面积,提高重点进口农产品的国内供给和保障水平。
本文对中国农产品贸易产品和市场结构的变迁,及其对粮食安全影响的研究是基于国内进出口状况的单节点分析。但农产品贸易对粮食安全影响的结果不仅取决于其他国家在中国农产品贸易结构中的地位,也取决于中国在其他国家贸易结构中的地位。因此,进一步对中国与美国、日本等主要贸易国家农产品贸易相互依存关系进行深入分析,为更加科学合理的制定农业和贸易政策提供依据,是下一步需要探讨的问题。
参考文献
Food security and food sovereignty: Getting past the binary
DOI:10.1177/2043820614537159 URL [本文引用: 1]
China's food security situation and strategy under the background of opening-up
DOI:10.31497/zrzyxb.20210620 URL [本文引用: 1]
对外开放背景下中国粮食安全形势研判与战略选择
Dietary structure upgrade of China's residents, international trade and food security
DOI:10.31497/zrzyxb.20210609 URL [本文引用: 1]
中国居民膳食结构升级、国际贸易与粮食安全
Key influencing factors of food security guarantee in China during 1999-2007
DOI:10.11821/xb201206007
[本文引用: 1]

Exploring the key influencing factors of food security guarantee during the typical period is of significance for the development of cultivated land protection and agricultural policy. This paper aims at exploring the factors between 1999 and 2007 which was in the new period of cultivated land protection administration. Methods such as comparison, spatial and econometric analysis are used to analyze the change in cultivated land productivity which was the cause of the disparity between cultivated land area and grain output changes. Results show that farmers' willingness to grow grain which determines cultivated land use intensity is the key factor. The sustained improvement of the willingness in 2003-2007 was mainly resulted from the rise of grain market price. Meanwhile, direct subsidy merely inspired farmers' anticipation for the profit of grain growing at the beginning years of implementing this policy. In addition, suggestions on the development of cultivated land protection are proposed involving improvement of farmers' willingness to grow grain, optimization of inputs in grain growing and improvement of cultivated land protection models.
1999—2007年中国粮食安全的关键影响因素
DOI:10.11821/xb201206007
[本文引用: 1]
选取耕地保护“新政”时期的1999-2007 年为研究时段,以耕地面积与粮食产量变化的分歧原因—耕地生产力变化为切入点,通过比较分析、空间与计量分析探寻粮食安全的关键影响因素。结果表明:农民种粮积极性变化决定着耕地集约利用是影响粮食安全的关键;2003-2007 年农民种粮积极性的持续提高主要来自市场粮价的上涨;粮食直补仅在开始实施的年份激发了农民对种粮收益的预期。此外,本文从提高农民种粮积极性、优化粮食生产投入及改进耕地保护模式3方面,提出了耕地保护发展的政策建议。
Model-based assessment of food security at a global scale
DOI:10.11821/xb201008002
[本文引用: 1]
This paper presents an approach for spatially explicit assessment of food security in consideration of a combination of the biophysical, social and economic factors of food security. To do that, two indicators, i.e., per capita food availability and per capita GDP, were used to cover the four dimensions of food security as many as possible. These two indicators were then linked to three models, i.e., spatial EPIC model, crop choice model and IFPSIM model. This proposed approach was applied to assess food security at a global scale over a period of approximately 20 years, starting with the year 2000. The results show that some regions such as southern Asia and most African countries will likely remain hotspots of food insecurity in the future. Both the per capita food availability and the capacity of being able to import food will decrease between 2000 and 2020. Low food production associated with poverty is thus the determining factor to starvation in these regions, and more efforts are needed to combat hunger in terms of future actions. Other regions such as China, most eastern European countries and most southern American countries where there is an increase in per capita food availability or an increase in the capacity to import food between 2000 and 2020 might be able to improve their food security situation.
基于空间模型的全球粮食安全评价
DOI:10.11821/xb201008002
[本文引用: 1]
在综合考虑自然、社会和经济等因子对粮食安全影响的基础上,选择了人均粮食占有量和人均GDP两个指标空间显性评价全球粮食安全状况。为此,本研究构建了3 个模型,即空间EPIC 模型、作物选择模型和IFPSIM 模型,分别模拟作物单产、作物播种面积和作物价格。利用构建的评价框架和模型,以网格大小为6 分弧度的地理单元为评价对象,选择水稻、 玉米、小麦和大豆等4 类全球主要作物类型,以2000 年为初始年份,对未来2020 年的全球粮食安全状况进行了评价。结果表明,到2020 年,多数南亚国家和非洲国家,由于其人均粮食占有量和人均GDP两个指标值都显著降低,粮食供应不足和贫困一起将可能导致该区域存在 粮食危机和饥饿风险。对于其他区域,日益增长的粮食需求可以通过本区域的粮食生产自给予以满足,或通过外部购买或粮食进口得到满足,总体上不存在粮食安全问题。为保障未来粮食安全,一方面要保护耕地数量和质量、防止土壤退化、增加资本投入、进行技术创新和升级,提高粮食综合生产能力,保障粮食的有效供给;另一方面加大农业补贴,切实提高农民收入,保障农民利益,增强农业购买力。同时,大力改善粮食流通和农产品贸易体制,通 过外部市场来调节粮食供给;积极应对气候变化,提高农业生产对气候变化的适应能力,保证粮食生产的稳定。
Who will feed China: The role and explanation of China's farmland pressure in food security
DOI:10.11821/dlyj201612002
[本文引用: 1]
China's food security has been a major concern of academic community and governments. The loss of farmland caused by rapid industrialization and urbanization is worrisome. At the same time, the Chinese government upholds the principle of "ensure basic self-sufficiency in grain and absolute security in ration" with the largest population in the world. So how serious a threat is farmland loss to China against the backdrop of continued growth both in grain output and food imports? And how should China respond to the challenge of food security? This paper will provide strong evidences for these issues. With the consideration of labor flow and regional difference, the paper modifies the farmland pressure index properly. Then using a modified farmland pressure index, this paper employs two-step GMM to estimate farmland pressure index on grain output based on the provincial panel data during 2000-2012. We find that farmland pressure index has a strong negative effect on grain output. Moreover, the effect is more obvious in the main producing areas than in non-producing areas. However, by exploring the temporal-spatial variations of China's farmland pressure index, we find that the farmland pressure is declining, and it remains in a safe range. This indicates that there is no serious risk of food security in China under the current urbanization background, and the goals of urbanization and food security are compatible. In the long run, if land policy adjusts properly, Chinese will not only feed themselves, but also will make a contribution to world food security. Therefore, our suggestions are as follows: (1) farmland protection should be combined with the comparative advantage of farmland use: the high quality cultivated land in some regions may demand special protection, such as controlling the scale of urbanization in normal and small cities (towns) properly, promoting the large-scale agricultural operations by subsidies in these areas. And to follow the direction of the agricultural labor flow, the government should encourage the land conversion in metropolises in the eastern region of China to create more jobs for the relief of China's farmland pressure; (2) the purpose of farmland policy adjustment should encourage agricultural scale management.
谁来养活中国: 耕地压力在粮食安全中的作用及解释
DOI:10.11821/dlyj201612002
[本文引用: 1]
中国粮食安全问题备受关注,与城镇化背景下耕地资源的减少有关。近年来,中外粮食价格“倒挂”引致的粮食进口量增加进一步加剧了未来中国可能发生粮食安全危机的担忧。与之相关的一个问题是,随着城镇化的推进,中国人能否养活自己?借用广泛使用的耕地压力指数,并对其进行修正,在此基础上,从人均耕地压力的角度重新审视了耕地资源的变动对粮食生产的影响。研究显示:修正耕地压力指数对粮食产量的影响显著为负。不仅如此,这种影响在粮食主产区表现得比非粮食主产区更为明显。同时,通过对修正耕地压力指数的时空演变趋势考察后发现,2000-2012年,中国粮食主产区的修正耕地压力指数始终处于安全压力区并呈下降趋势,表明现阶段耕地资源的减少并没有显著地威胁中国的粮食安全。从长期看,城镇化与保障粮食安全不仅目标是兼容的,如果农地政策调整得当,中国人不但能够养活自己,还能够为全世界的粮食安全做贡献。为此主要建议:耕地保护要以发挥耕地生产力比较优势为原则;农地政策的调整以农业规模化经营为目的。
Potential impacts of industrial land expansion on food security in China, 1990-2015
DOI:10.18306/dlkxjz.2017.05.009
[本文引用: 1]
Food security is a key governmental and academic concern in China. In the past 25 years, due to the rapid industrialization and urbanization, competition for land resources and environmental pollution threatened the sustainability of China's grain production. Studies to date have focused on the urbanized areas, and rural industrial land expansion and impact on food security in China remain largely unknown. This study constructed an 1 km resolution grain output dataset using the latest remote sensing data-derived land use dataset (NLUD-China) and county-level grain production data of China to evaluate the impacts of industrial land expansion and pollution on food security of the country. The results show that the industrial land area increased by 326% between 1990 and 2015, with an increasing expansion rate of 288 km2/a in the 1990s to 2600 km2/a in 2010-2015, close to the current urban expansion rate (3000 km2/a). During 1990-2015, industrial land expansion led to 1.7×10⁴ km2 reduction of crop land, resulting in a direct production loss of 6.49 Mt (106 tons). Indirect losses caused by industrial pollution was conservatively estimated at 83.20 Mt. Overall estimated losses due to industrial land influence can be up to 17% of China's cropland production. Spatially, direct loss of crop production in China decreased from the central and coastal region to the northwest region. In the central and western regions losses caused by soil pollution is relatively serious. With the increasing population and other socioeconomic and environmental changes, the balance between the supply and demand of food becomes more delicate. Therefore, remote sensing monitoring of crop land and industrial land for national macroeconomic development and environmental protection is of great significance.
1990—2015年中国工矿用地扩张及其对粮食安全的潜在影响
DOI:10.18306/dlkxjz.2017.05.009
[本文引用: 1]
中国城市化和工业化进程所带来的粮食安全问题一直是政府和学术界关注的焦点。中国近25年来快速的城市化与工业化导致耕地资源减少和环境污染加剧,对国家粮食安全和农业可持续发展产生一定影响。本文基于中国土地利用/覆盖变化最新解译结果和中国分县粮食产量数据,重建了中国1 km分辨率的粮食产量空间数据,分析了中国1990-2015年工矿用地扩张及其对粮食产能的影响。结果表明:中国工矿用地面积在1990-2015年间增长了326%,扩张速率从1990-2000年的288 km<sup>2</sup>/a增加到2000-2010年的1482 km<sup>2</sup>/a,近5年(2010-2015年)扩张速率最快,达2600 km<sup>2</sup>/a。过去25年间工矿用地扩张导致耕地面积减少1.7×10<sup>4</sup> km<sup>2</sup>,直接导致粮食产能损失约6.49 Mt(10<sup>6</sup> t),因工矿用地扩张可能会对周边耕地污染等间接影响的粮食产量达83.20 Mt。经评估,国家工矿用地扩张对粮食产能潜在影响总体上是当前粮食总产能的17%。在空间分布特征方面,工矿用地扩张对粮食产能的直接影响呈现由东部沿海地区向西北地区逐渐减小趋势;间接影响在中部和西部地区相对较大。
Agricultural structure adjustment and its effect on China's food safety: Case study of the main food supply regions
农业结构调整对全国粮食安全的影响分析: 以粮食主产区为例
The choice of food security policy in the process of China's modernization
中国现代化进程中的粮食安全政策选择
Agricultural policies, food production and food production-adjustment ability
农业政策、粮食产量与粮食生产调整能力
Food security and trade: Reconciling discourses in the Food and Agriculture Organization and the World Trade Organization
DOI:10.1007/s12571-015-0428-y URL [本文引用: 1]
Trade liberalization and food security in Nepal
DOI:10.1016/j.foodpol.2009.09.001 URL [本文引用: 1]
Does trade openness contribute to food security? A dynamic panel analysis
DOI:10.1016/j.foodpol.2017.04.008 URL [本文引用: 2]
Trade liberalization and national food security: Rice trade between Bangladesh and India
DOI:10.1016/S0305-750X(00)00121-2 URL [本文引用: 1]
Neoliberal policy, rural livelihoods, and urban food security in West Africa: A comparative study of The Gambia
China's grain structure and food security: From the perspective of grain circulation trade
中国粮食结构与粮食安全: 基于粮食流通贸易的视角
Characteristics and trends of China's agricultural products import and export trade: 1998-2011
我国农产品进出口贸易的特点及趋势: 1998—2011
China's agricultural trade in economic opening-up: Development, challenges and future policy alternatives
开放进程中的中国农产品贸易: 发展历程、问题挑战与政策选择
China's food supply sources under trade conflict with the United States and limited domestic land and water resources
Quantification of virtual land resources in China's crop trade
中国农产品贸易的虚拟土地资源量化研究
Agricultural trade and virtual land use: The case of China's crop trade
DOI:10.1016/j.landusepol.2012.12.017 URL [本文引用: 3]
An examination of China's food security based on effective supply of cultivated land
基于国内外耕地资源有效供给的中国粮食安全问题研究
Spatial pattern and evolution of cereal trade networks among the Belt and Road countries
DOI:10.18306/dlkxjz.2019.10.018
[本文引用: 1]
Trade of agricultural commodities is an important part of the economic and trade cooperation between the Belt and Road countries, but the existing trade theories cannot fully explain the pattern and change of the cereal trade network between these countries. This study set up a four-dimensional analytical framework, combined social network analysis with spatial econometric analysis, and analyzed the spatial structure characteristics and mechanism of change of cereal trade network between the Belt and Road countries based on the United Nations Comtrade data from 1993 to 2016. The results show that: 1) The cereal trade network density of the Belt and Road countries is constantly increasing while the trade relations and trade intensity between these countries are constantly deepening. The position of the Belt and Road countries in the global grain trade network is on the rise and there is a clear phenomenon of trade club. 2) The network of trade relations has evolved from non-nuclear to multi-nuclear, and then to reshaping. 3) China's cereal trade with other Belt and Road countries has undergone an evolution from export-oriented to import-oriented. The Belt and Road initiative has enhanced China's position in the global grain trade network. 4) The evolution of the national cereal trade network of the Belt and Road countries is the product of resource endowment, economic environment, cultural identity, and political games. Compared with other trade networks, grain trade network has distinct characteristics and stronger stability. This study may provide some guidance for promoting cereal trade cooperation among the Belt and Road countries, optimizing trade structure, and ensuring food security.
“一带一路”国家粮食贸易网络空间格局及其演化机制
DOI:10.18306/dlkxjz.2019.10.018
[本文引用: 1]
农产品贸易是“一带一路”沿线国家间经贸合作的重要内容,但现有贸易理论无法很好地解释“一带一路”国家间粮食贸易网络的格局演化。该文构建了一个四维菱形分析框架,并将社会网络分析与空间计量分析相结合,基于1993—2016年联合国商品贸易数据,分析了“一带一路”国家间粮食贸易网络的空间结构特征及其演化机制。结果表明:① “一带一路”国家间的粮食贸易网络密度不断提高,贸易关系和贸易强度不断加深,在全球粮食贸易网络中的地位呈波动上升态势,并出现明显的贸易俱乐部现象;② 该粮食贸易网络呈现由无核到多核再到重塑的演化历程;③ 中国与其他“一带一路”国家间的粮食贸易经历了从出口导向到进口导向的演化历程,“一带一路”倡议提高了中国在全球粮食贸易网络中的地位;④ “一带一路”国家间粮食贸易网络的演化是受资源禀赋、经济环境、文化认同和政治博弈4个因素共同作用的结果,各因素在不同阶段所起的作用不同;粮食贸易较其他贸易而言特色鲜明,其稳定性更强。研究结果对促进“一带一路”国家农业贸易的健康繁荣,建设开放包容的经济环境具有指导意义。
Network structure of agricultural product trade in countries of the Silk Road Economic Belt
丝绸之路经济带沿线国家农产品贸易网络结构特征
Trade network of global agricultural products weighted by physical and value quantity
实物量与价值量加权的全球农产品贸易网络分析
Analysis on global agricultural trade network and its evolution
DOI:10.31497/zrzyxb.20180403 URL [本文引用: 1]
全球农产品贸易网络及其演化分析
The impact of production-side changes in grain supply on China's food security
供给侧生产端变化对中国粮食安全的影响研究
Definition and classification of agricultural products scope in agricultural products trade research
农产品贸易研究中农产品范围的界定和分类
Quantitative Analysis of "the Belt and Road Initiative" Big Data:Tasks
Measuring international specialization
DOI:10.1007/BF02296007 URL [本文引用: 1]
Impacts of COVID-19 on trade and economic aspects of food security: Evidence from 45 developing countries
A study on trade pattern of China with Russia and Central Asia
DOI:10.11821/dlyj201505002
[本文引用: 1]
As important member states of Shanghai Cooperation Organization and key areas of the Silk Road Economic Belt, Russia and Central Asia are gaining a closer and closer relationship with China, which will play a much more important role in ensuring China's geopolitical security and promoting the opening-up of Chinese inland provinces in the future. Under this background, this paper employs Trade Intensity Index, Trade Complementarity Index and Export Concentration Index to depict the dynamics of China's trade with Russia and Central Asia during 1992-2012. Thereafter, the spatial pattern and industrial structure of China's trade with Russia and Central Asia in 2012 are studied thoroughly with special attention paid to the spatial pattern of trade in several key commodities. At last, based on the historical data of China's trade, the authors make a brief predication for the prospects of China's trade cooperation with Russia and Central Asia to the year 2020. The main conclusions are as follows: (1) China's trade intensity and trade complementarity with Russia & Central Asia have been increasing over the past 20 years. Besides, the range of commodities imported from Russia and Central Asia has been extended dramatically. (2) Primary energy and raw materials account for a large proportion in export from Russia and Central Asia to China, while the commodities exported from China to those countries are mainly composed of machinery equipments, textile and clothing. (3) The provincial structure of China's export trade to Russia and Central Asia is the result of a combination of cross-border trade and geographical specialization in China, while China's import trade from those countries is mainly affected by cross-border trade as well as spatial distribution of energy demands. (4) In 2020, the trade volume of China with Russia and Central Asia is expected to exceed 400 billion dollars, among which Turkmenistan will account for a much higher proportion. The commodity structure of China's export will be improved to some extent while that of China's import is more likely to remain the same. Besides, the status of some richer inland provincial units, such as Chongqing, Shaanxi and Sichuan, will be enhanced significantly in China's trade with Russia and Central Asia.
中国与俄罗斯及中亚地区的贸易格局分析
DOI:10.11821/dlyj201505002
[本文引用: 1]
作为上海合作组织成员国及丝绸之路经济带的重点区域,俄罗斯及中亚地区与中国经贸关系日益密切,对中国内陆开放及地缘政治安全具有重大意义。利用贸易强度指数、贸易互补性指数、出口集中指数等,对1992-2012年中国与俄罗斯及中亚地区的贸易发展历程及空间格局、进出口产品格局进行深入分析。结果显示双方贸易强度不断提升,且贸易互补性增强,同时俄罗斯及中亚出口产品种类明显增加。当前双方贸易格局呈现以下特点:俄罗斯及中亚形成了以资源类初级产品为绝对主导的出口产品结构,中国则以机械设备及纺织服装等为主;中国对其出口贸易格局是边境贸易与地区产业专业化格局叠加的结果,进口贸易格局则受边境贸易及能源需求格局的影响。
Trade structure and economic growth
Digital trade feature map: A new method for visualization and analysis of spatial patterns in bilateral trade
Multivariate analysis and geovisualization with an integrated geographic knowledge discovery approach
DOI:10.1559/1523040053722150
PMID:19960118
[本文引用: 1]
The discovery, interpretation, and presentation of multivariate spatial patterns are important for scientific understanding of complex geographic problems. This research integrates computational, visual, and cartographic methods together to detect and visualize multivariate spatial patterns. The integrated approach is able to: (1) perform multivariate analysis, dimensional reduction, and data reduction (summarizing a large number of input data items in a moderate number of clusters) with the Self-Organizing Map (SOM); (2) encode the SOM result with a systematically designed color scheme; (3) visualize the multivariate patterns with a modified Parallel Coordinate Plot (PCP) display and a geographic map (GeoMap); and (4) support human interactions to explore and examine patterns. The research shows that such "mixed initiative" methods (computational and visual) can mitigate each other's weakness and collaboratively discover complex patterns in large geographic datasets, in an effective and efficient way.
A visualization system for space-time and multivariate patterns (VIS-STAMP)
The research reported here integrates computational, visual, and cartographic methods to develop a geovisual analytic approach for exploring and understanding spatio-temporal and multivariate patterns. The developed methodology and tools can help analysts investigate complex patterns across multivariate, spatial, and temporal dimensions via clustering, sorting, and visualization. Specifically, the approach involves a self-organizing map, a parallel coordinate plot, several forms of reorderable matrices (including several ordering methods), a geographic small multiple display, and a 2-dimensional cartographic color design method. The coupling among these methods leverages their independent strengths and facilitates a visual exploration of patterns that are difficult to discover otherwise. The visualization system we developed supports overview of complex patterns and, through a variety of interactions, enables users to focus on specific patterns and examine detailed views. We demonstrate the system with an application to the IEEE InfoVis 2005 Contest data set, which contains time-varying, geographically referenced, and multivariate data for technology companies in the US.
The State of Food and Agriculture 2005
Critical values for cointegration tests//Queen's Economics Department Working Paper
Structural evolution of global high-tech trade system: Products, networks and influencing factors
DOI:10.11821/dlxb202012015
[本文引用: 1]
Since 2018, with the major adjustment of the global political and economic structure, Sino-US relations, which take trade friction as the representation and science and technology competition as the essence, have become increasingly tense. Based on this, this paper characterizes the evolution of global high-tech products trade structure from three aspects of product structure, network structure and influencing factors, and draws some conclusions. First of all, in terms of product structure, global high-tech trade is increasingly concentrated on electronic communication products based on telecommunications equipment. However, on the national scale, chemical products and armament products are not only the dependence products of most countries (regions) on imports, but also the superior export products of most countries (regions). Second, in terms of topology, the global high-tech product trade network continues to expand and is closely linked. It is a typical small-world network and develops a stable "core-edge" hierarchical structure. Third, in terms of spatial structure, the global trade pattern of high-tech products has changed from Europe-North America dominated to East Asia dominated, and also the largest trade country has changed from the United States to China. In addition, the spatial structure has changed from the "double arch" structure with the United States as the core to the "multi-arch" pattern with China as the core, but the United States still occupies a central position in the trade network of various high-tech products. Fourth, in terms of influencing factors, trade scale, economic proximity and cultural proximity have positive effects on the evolution of global high-tech products trade network, while geographical distance has an obvious negative effect. The four factors of political stability, openness, infrastructure and technological innovation only pass the significance test on the importing country (region), while the economic scale only passes the significance test on the exporting country (region). The technological gap is one of the driving forces for the evolution of the global high-tech product trade network.
全球高科技产品贸易结构演化及影响因素
DOI:10.11821/dlxb202012015
[本文引用: 1]
为清晰刻画全球高科技产品贸易体系变迁,本文利用世界银行以及联合国商品贸易数据库中2000—2017年高科技产品贸易数据,从产品结构、网络结构和影响因素3个方面探讨了全球高科技产品贸易结构的演化态势。研究发现:① 产品结构上,以电信设备为主的电子通讯产品主导全球高科技贸易发展,但在国家尺度上,化学产品和武器产品是大部分国家(地区)的进口依赖产品或出口优势产品;② 拓扑结构上,全球高科技产品贸易网络持续扩张,联系紧密,是一典型的“小世界”网络,并发育出稳定的“核心—边缘”式的等级层次结构;③ 空间结构上,全球高科技产品贸易格局呈现出由欧洲—北美主导向由东亚主导转变,贸易最大国也由美国转变为中国,网络空间结构也呈现出由以美国为核心的“双拱”格局向以中国为核心的“多拱”格局转变,但美国依然在多种高科技产品贸易网络中占据核心地位;④ 影响因素上,贸易规模、经济邻近性和文化邻近性对全球高科技产品贸易网络演化皆具有一定的正向作用,地理距离对全球高科技产品贸易网络的演化起到明显的负向作用。
