

1 引言
国土空间生态修复旨在将系统和整体的概念、理论和方法融入生态修复实践中,推动单一要素修复转向全域、全要素、全过程协同治理[1]。国土空间生态修复分区为生态修复工程项目布局提供宏观指导,是有序开展国土空间生态修复的重要前提。目前,生态修复分区已形成较为普遍的研究范式,即基于生态评估识别区域突出生态问题,采取定性或定量的方法进行分区,并提出差异化、针对性的生态修复策略[2-3]。现有研究主要关注分区指标体系和分区方法。生态修复评价指标既包括生态系统自身质量、服务功能、健康状态等正向衡量指标[4-5],也包括生态风险、生态系统受损程度和生态脆弱性等逆向指标[6-7]。传统生态修复分区针对单一生态系统要素或功能选取指标,分析其面临的主要生态问题。如水环境修复分区[8]、植被修复分区[9]、水土保持分区[10]、海洋保护分区[11]、土地整治分区[12]、耕地保护分区[13]等。自国土空间生态修复的概念提出以来,学者们开始重视分区指标体系的全面性与系统性,除生态方面的指标外,社会经济方面的指标也被广泛纳入。部分学者依据区域生态系统某一方面属性的评价结果进行分区,指标包含生态风险[7]、生态安全[14]、生态系统服务[4]、生态环境敏感性[15]、资源环境承载力[16]等。也有学者基于“压力—状态—响应”模型设计了更加全面的评估框架,如“退化压力—供给状态—修复潜力”框架[17]、“要素—景观—系统”框架[18]等。生态修复分区方法包括综合分析法、专家咨询法、叠图法等[19]。叠图法通过专题评价图进行空间叠置分析和空间聚类分析形成综合分区图,作为一种客观、定量的分区方法,其应用更加广泛,而综合分析法和专家咨询法多作为叠图法的补充。现有生态修复分区研究也存在一些不足,例如:所建立的分区指标体系着重考虑生态环境现状与人类活动胁迫,对人类的主动响应以及生态系统自身的适应能力重视不够;大多以单一研究时点评价结果为依据进行分区,对于修复对象动态特征的关注不足
国土空间生态修复是一个动态持续的过程,需要融合系统动态性与适应性管理的新理念[20]。Gunderson等[21]基于生态系统韧性理论提出了适应性循环模型,用于描述系统在外界干扰下的适应性动态发展机制。其核心内容是“3维度—4阶段”的分析框架,即系统具有潜力、连通度和韧性3维属性,经历开发(exploitation, r)、保护(conservation, K)、释放(release, Ω)和重组(reorganization, α)4阶段的适应性循环过程。在不同适应性循环阶段,系统3维属性具有迥异的组合特征。依据该理论量化国土空间系统3维属性的时空特征,辨识不同区域的适应性循环过程,有助于建立利益相关者普遍能接受的生态修复工作框架,为科学划定国土空间生态修复分区,精准构建区域针对性的修复模式与实施途径提供重要依据。目前,适应性循环模型已广泛应用于生态系统演化过程识别[22],生态风险评估[23-24]与可持续性评估[25]等领域,部分学者利用该模型提出了特定区域的生态修复策略[26],但运用该理论开展生态修复分区的定量化研究鲜见报道。
重庆市是长江上游生态屏障的最后一道关口,在国家生态安全格局中具有重要地位。划分不同类型的国土空间生态修复分区,针对不同分区实施差异化、针对性的生态修复策略,提升重庆市国土空间系统对于干扰的适应能力,对筑牢长江上游重要生态屏障具有重要意义。鉴于此,本文以重庆市为例,构建基于生态适应性循环模型的国土空间生态修复分区研究框架,从潜力、连通度和韧性3个维度选取指标量化重庆市国土空间系统属性的时空变化趋势,识别各区县所处的适应性循环阶段,基于此对重庆市国土空间生态修复进行分区与讨论。本研究旨在为国土空间生态修复分区研究提供新的视角与方法,并为区域生态修复规划与差异化管理提供科学依据。
2 研究区概况与数据来源
2.1 研究区概况
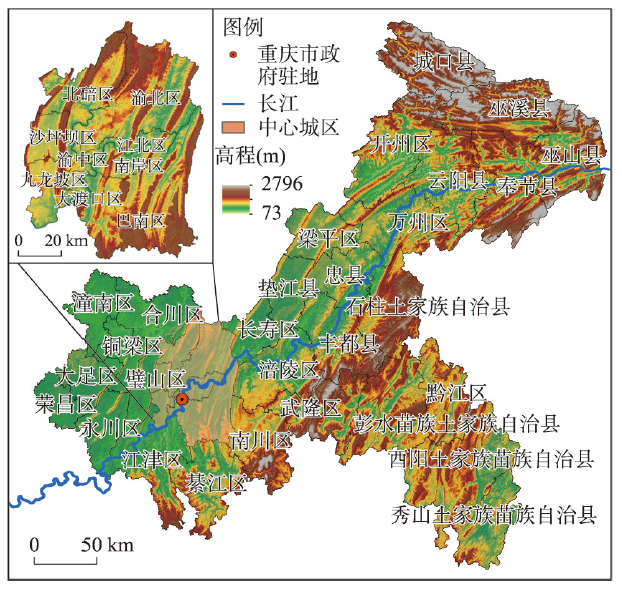
重庆市地处长江上游地区(105°11'E~110°11'E、28°10'N~32°13'N,图1),国土面积8.24万km2,下辖38个区县。地形以山地、丘陵为主,年均气温17 ℃,年均降水量1229 mm,森林覆盖率高,自然资源丰富。重庆社会经济发展迅速,截至2020年常住人口约3124.32万,城镇化率达69.46%,GDP总量超2.50万亿元。快速城镇化进程与自然资源高强度开发利用导致水土流失、石漠化、环境污染等生态环境问题突出。近年来,重庆市相继实施了矿山治理、森林防护、水污染防治、土壤修复、流域湖库整治等系列生态修复工程并取得了显著成效[27]。然而,生态系统敏感脆弱,环境容量和承载力不足等问题未得到根本性解决,生态建设和经济发展之间空间竞争关系激烈,区域性、布局性环境风险突出,“山水林田湖草”系统治理理念在重点生态工程中的落实还不到位等问题仍然存在[28]。同时,重庆市集“大城市、大农村、大山区、大库区”于一体,不同地区面临的主要生态问题和社会经济发展差异显著。因此,重庆亟需在全市范围内开展差异化、系统化的国土空间生态修复
图1
2.2 数据来源
研究数据包括高程、土地利用、气象与土壤等,数据来源及相关信息见表1。除高程与土壤数据外,土地利用涉及1995年、2000年、2005年、2010年、2015年和2020年6个时间节点的数据,1995年土地利用数据仅用于计算2000年土地利用变化压力指标,其余指标均为2000年、2005年、2010年、2015年和2020年5个时间节点的数据。对EVI、NPP原始数据进行剪裁与年度数据合成。将所有空间数据重采样为1 km×1 km的栅格数据,并统一投影至GCS_WGS_1984地理坐标系下进行分析。
表1 数据来源说明
Tab. 1
| 数据类型 | 数据产品 | 来源 | 分辨率 |
|---|---|---|---|
| 高程 | ASTER GDEM V2 | http://www.gscloud.cn/ | 30 m |
| 土地利用 | 土地利用/覆被遥感监测数据 | http://www.resdc.cn/ | 30 m |
| EVI | MOD13A2 | http://modis.gsfc.nasa.gov/ | 250 m |
| 气象 | 降水量、气温、太阳辐射等数据 | http://www.geodata.cn/ | 1 km |
| 土壤 | SOTER | https://data.isric.org/ | 250 m |
| NPP | MOD17A3 | http://modis.gsfc.nasa.gov/ | 500 m |
| 社会经济 | 重庆市常住人口数、人均收入、财政收入等指标 | 《重庆市统计年鉴》 | - |
3 研究方法
3.1 理论分析框架
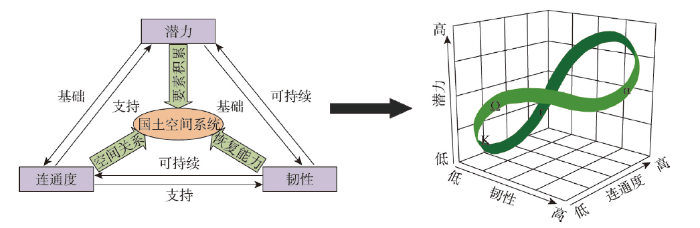
适应性循环模型中“3维度”和“4阶段”的具体内涵由所分析的系统而定[22]。国土空间系统是自然生态要素和社会经济要素相互作用形成的动态复合系统[29],“潜力”是指以生态环境质量和功能为表征的自然要素容量积累情况[30];“连通度”反映系统组分间的空间关系,可理解为以景观结构为表征的景观单元之间的连通程度[22];“韧性”则反映系统在面对外界干扰时维持自身结构和功能的能力,一般用系统稳定性、外界压力大小以及系统的响应水平来衡量[17,31 -32]。潜力是连通度与韧性的基础决定性因素,连通度是潜力和韧性的支持因素,而韧性是决定潜力与连通度是否具有可持续性的关键因素(图2)。在适应性循环过程中,3维属性具有不同的组合特征[18]。r阶段对应快速发展时期,人口集聚与城镇建设不断消耗系统的潜力,人类活动的干扰降低了系统的连通度与稳定性,3维属性均处于由高到低的变化趋势中;当发展进入成熟期,适应性循环处于K阶段,国土空间开发程度达到较高水平,潜力、连通度和韧性下降到了最低水平并保持相对稳定,系统发生崩溃的风险较高;当受到超过阈值的强烈干扰时,系统会发生崩溃而进入Ω阶段,这一阶段往往持续时间很短;随后进入α阶段,退化的生态功能逐渐恢复,潜力、连通度和韧性均持续改善,最终恢复到最高状态,这一阶段对应系统崩溃后自然生态系统的演替期与发展的初期,新一轮适应性循环也由此开始[33]。
图2
国土空间生态修复包含人工修复和自然恢复两类手段,不断提升国土空间系统的潜力、连通度和韧性是其重要目标[1](图3)。国土空间生态修复需要综合考虑区域主要生态问题,人地关系现状和发展定位等,关注不同区域国土空间系统功能的差异,通过划分生态修复分区,合理安排不同区域的生态修复策略,协调经济活动与生态保护、修复活动的关系,从系统整体层面构建更加和谐的人地关系[3,19]。处于r阶段的区域应划为生态控制区,通过限制国土空间的开发强度,降低系统3维属性的下降速度;处于K阶段的区域应划为生态修复区,不断加强生态环境综合改良与治理力度,保持潜力与连通度相对稳定并促进韧性逐步回升;处于α阶段的区域应划分为生态保育区,加强自然保护区建设和管理,优化自然生态系统的功能,促进系统3维属性稳步提升。由于系统处于Ω阶段时间较短,往往无法及时有效地采取生态修复措施,故不考虑其生态修复分区。
图3
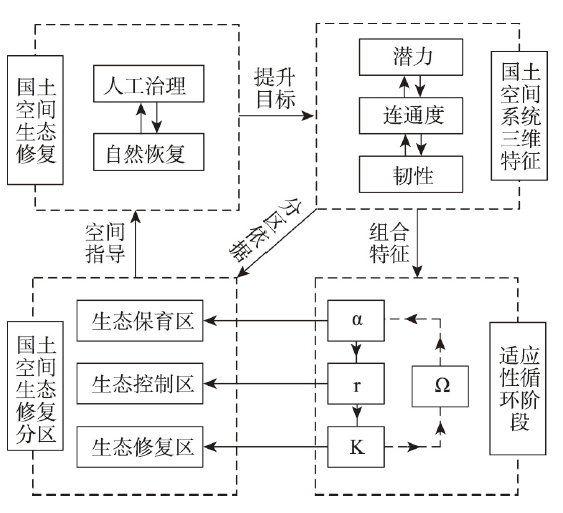
图3
国土生态修复分区与适应性循环模型的关联框架
Fig. 3
Correlation framework between ecological restoration zoning of territorial space and adaptive cycle model
基于适应性循环模型开展国土空间生态修复分区,首先要构建包含潜力、连通度和韧性3个维度的综合指标体系,定量评价区域国土空间系统3维属性的时空特征;其次,分析不同评价单元3维属性的相互关系,识别其所处的适应性循环阶段;最后,依据上述分析结果,划定不同类型的国土空间生态修复分区,并明确该分区的生态修复策略。
3.2 指标体系构建
表2 国土空间系统3维属性评价指标体系
Tab. 2
| 准则 | 指标 | 内涵 | 类型 | 权重 |
|---|---|---|---|---|
| 潜力 | 植被盖度 | 生物量积累 | + | 0.168 |
| NPP | 有机物生产能力 | + | 0.175 | |
| 生态用地占比 | 生态空间规模 | + | 0.134 | |
| 碳储存功能 | 提供碳储存服务的能力 | + | 0.124 | |
| 水源涵养功能 | 提供水源涵养服务的能力 | + | 0.119 | |
| 土壤保持功能 | 提供土壤保持服务的能力 | + | 0.143 | |
| 生物多样性保护功能 | 提供生物多样性保护服务的能力 | + | 0.137 | |
| 连通度 | DIVISION | 景观被分割的破碎程度 | – | 0.312 |
| MPI | 景观斑块间的临近程度 | + | 0.326 | |
| 建设用地距离 | 土地开发对连通度的干扰 | + | 0.194 | |
| 路网密度 | 道路建设对连通度的干扰 | – | 0.168 | |
| 韧性 | SHDI | 景观类型丰富度 | + | 0.122 |
| 景观结构稳定性指数 | 景观格局稳定程度 | + | 0.068 | |
| 土地利用相对合理指数 | 土地利用方式的适宜程度 | + | 0.116 | |
| 土地利用变化压力指数 | 土地利用变化造成的生态压力 | – | 0.276 | |
| 人口密度 | 人口集聚造成的生态压力 | – | 0.218 | |
| 地均财政收入 | 政府对生态压力的响应 | + | 0.125 | |
| 人均收入 | 个人对生态压力的响应 | + | 0.075 |
3.2.1 “潜力”指标
“潜力”指标主要考虑系统生物量积累、物质生产和提供生态系统服务的能力:① 植被盖度与系统生物量的积累程度呈正相关[34]。采用EVI来衡量植被覆盖度。② NPP可以表征陆地生态系统的有机物生产能力和质量状况,伴随着生态系统的正向演替和生物量的积累,NPP将不断增大。③ 生态用地占比可以衡量生态空间数量的多寡,将林地、草地、水域和未利用地视为生态用地,采用生态用地面积与土地利用总面积的比值来衡量该指标。④ 生态系统服务功能是评价生态系统健康与可持续性的关键指标之一[36]。碳储存、水源涵养、土壤保持以及生物多样性保护是重庆市的关键生态系统服务功能[37],选取这4个指标更有利于准确衡量研究区国土空间系统的潜力,指标测算采用InVEST模型[38]。
3.2.2 “连通度”指标
3.2.3 “韧性”指标
“韧性”指标主要从国土空间系统的状态、承受的压力以及针对压力做出的决策响应3方面进行选取。
(1)状态方面主要考虑系统的稳定性。① SHDI可指示景观类型的丰富性,其值越大,景观系统因特定风险而崩溃的概率越低。② 景观结构稳定性指数用以反映景观格局的稳定程度[39],其计算公式为:
式中:R为土地利用相对合理指数,其值越大土地利用越有利于减少土壤侵蚀;Lji表示坡度级j中地类i的占比;Sji表示坡度级j对地类i的适宜程度,取值范围为[0, 1],1表示最适宜,0表示不适宜,该参数的设定参考三峡库区相关研究成果[41];m为土地利用类型数;n表示坡度分级数。
(2)压力方面主要考虑人口集聚与土地利用变化。① 人口密度可以表征人口集聚对生态环境造成的压力,采用常住人口数与行政区面积的比值来衡量。② 土地利用变化压力指数用以表示土地利用变化导致的生态压力[18],表达式为:
式中:P为土地利用变化压力指数,其值越大表示由于土地利用变化导致的生态压力越大;Sab指评价单元从上个研究时点到该研究时点间地类a转移为地类b的面积;wab为地类a转移为地类b的压力权重,采用转入地类与转出地类的单位面积生态系统服务价值之差进行赋值[42]。初始研究节点(2000年)的P值由1995—2000年的土地利用转移情况计算得出。
4 结果分析
4.1 “3维度”属性评价结果
对各准则层的指标进行加权叠加得到潜力、连通度和韧性“3维度”属性评价结果。自然断点法能够快捷、有效地实现数据分级,并能较好地保持数据的统计特性[45],本研究采用该方法对研究时段内的评价结果进行分级,为了便于比较不同年份之间指标评价结果的变化,以中间年份2010年的评价值为分级依据。重庆市3维属性均呈现东高西低的分布特征,高值区主要分布在重庆市东北部与东南部,低值区主要集中在中心城区及其外围地区(图4)。潜力属性大体沿着“方山丘陵区—川东平行岭谷区—四川盆地边缘山地区”呈现出梯度式递增的分布格局,这主要是平坝、丘陵、山地明显的自然资源属性差异造成的,表明重庆市地形地貌的整体格局是决定潜力属性的重要因素。2000—2020年重庆市潜力属性的空间分布格局稳定,较为明显的变化是中心城区潜力低值区的增加,这归因于该区域快速城镇化进程对系统潜力的消耗。连通度属性则主要沿着“中心城区—中心城区外围地区—渝东北、渝东南地区”呈现梯度式递增的分布格局,这反映出人类活动强度的空间分布是决定重庆市连通度属性的重要因素。连通度高值区的分布格局较为稳定,但低值区由主城周边地区逐渐蔓延到了三峡库区丰都—万州段,这可能是由该区域快速的基础设施建设与城镇化进程导致的。韧性指标更加强调社会—生态系统的耦合,其反映了区域人地关系的协调程度。从指标权重来看,国土空间系统状态与承受的压力是决定韧性水平更关键的因素,但人类对压力的响应也发挥了重要作用。2005—2020年渝西地区韧性属性的高值区明显增加,这可能是由于这些地区采取相应的生态策略提升区域自身对生态压力的适应能力,如加强绿色基础设施建设和开展生态保护修复工程等。这也反映出只考虑系统自身属性和要素相互关系的评估指标体系具有局限性,因为其忽视了系统本身的适应能力以及人类主动保护与修复的积极影响。
图4
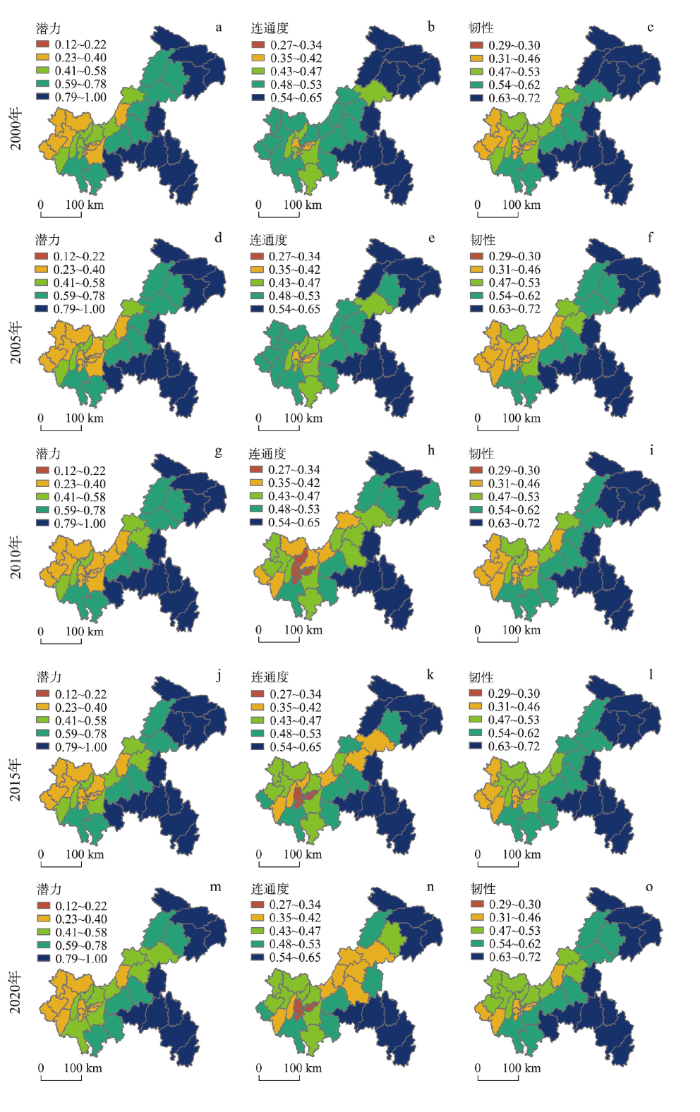
图4
重庆市“潜力—连通度—韧性”3维属性空间分布
Fig. 4
Spatial distribution of three-dimensional attribute of "potential-connectedness-resilience" in Chongqing City
4.2 适应性循环过程识别
本文采用Z-score标准化方法对各区县3类属性值进行处理,将各区县的潜力、连通度和韧性3维属性评价值绘制在3维坐标系统中。根据3维属性的关系以及区域社会经济发展的实际情况,能够将各时段对应到适应性循环周期的各个阶段。由于2000—2020年重庆市尚未出现因国土空间过度开发而导致系统出现崩溃的情况,因此没有区县处于Ω阶段。观察各区县3维属性值在5个年份的变化轨迹,发现3维属性值均小于1的区县全部位于中心城区,3维属性值均小于1的区县全部是渝东北、渝东南地区的山区县,两类区县3维属性值的变化幅度均较小。而3类属性处在-1到1之间的区县主要位于渝西地区和三峡库区,区域经济处于快速开发阶段,3维属性值变化剧烈。该类区域中有部分区县3维属性均持续下降,符合r阶段的特征,但也有部分区县3维属性均出现了逆势上升,其不同于重组阶段前期系统崩溃后出现的生态环境恢复,而是经济与生态协同发展的结果。这表明系统的演进具有复杂性,其适应性循环并不是一个固定的、绝对的周期[46],故需要对适应性循环模型进行改进,增加协调开发阶段(Ir),以描述该类区域的发展状态。基于以上分析,本文选取-1和1作为阈值,若某区县在某时段的起点与终点3维属性值均小于-1,则认为该区域处于K阶段,若均大于1,则认为该区域处于α阶段,若3维属性值在-1到1之间且出现下降,则认为该区域处于r阶段,若不满足以上条件,则认为该区域处于Ir阶段。
以地处中心城区的九龙坡区、地处三峡库区核心区的忠县、地处渝东北的山区县巫溪县和地处中心城区西北部的北碚区(拥有国家级自然保护区缙云山)为例,分析适应性循环阶段的变化过程(图5)。2000—2015年九龙坡区3维属性一直处于下降趋势中,且3维属性值均于2015年下降至-1以下,此后保持相对稳定。这说明九龙坡区经历了由r阶段(2000—2015年)到K阶段(2015—2020年)的适应性循环过程,期间土地城镇化率由2000年的8.45%提高到2020年的36.07%。5个年份里,忠县3维属性值呈现出持续降低的趋势,但始终未降至-1以下,说明20年来该区域一直处于r阶段。5个年份中,北碚区3维属性值同样均处于-1到1之间,但其所处的阶段经历了转变。2000—2010年北碚区3维属性呈现下降趋势,系统处于r阶段。但其3维属性于2010—2020年间出现连续上涨,系统处于Ir阶段,可能与缙云山自然保护区严格的保护政策和积极有效的生态环境治理措施有关。2000—2020年巫溪县3维属性一直处于高位(> 1),虽然各年份略有波动,但总体处于平稳状态,说明20年来该区域一直处于α阶段后期。4个时段重庆市其他区县所属的适应性循环阶段如图6所示。总体来看,2000—2020年重庆市处于α阶段的区县数量较为稳定,处于其他阶段的区县数量处于不断变化中。2000—2005年、2005—2010年与2010—2015年3期处于r和Ir阶段的区县呈现交叉分布的格局,而2015—2020年处于4个阶段的区县具有明显的空间集聚分布特征。
图5
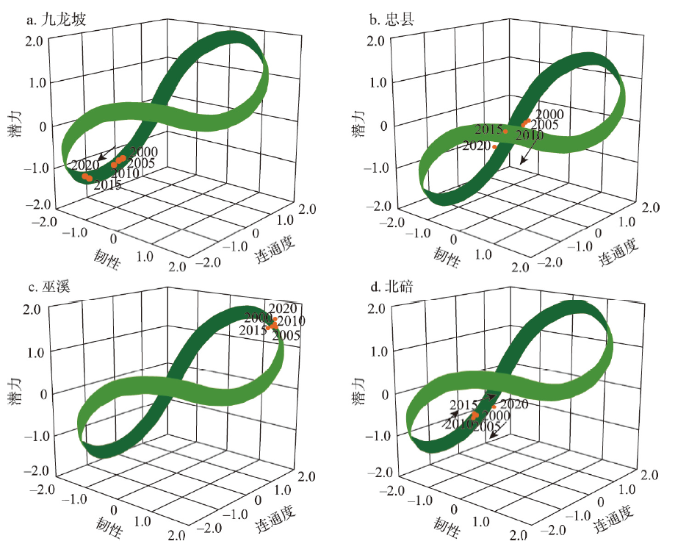
图5
重庆市示例区县的适应性循环阶段变化过程
Fig. 5
The changes of adaptive cycle phases in example counties in Chongqing City
图6

图6
重庆市各区县的适应性循环阶段
Fig. 6
Adaptive cycle phases of each county in Chongqing City
4.3 国土空间生态修复分区与管控
根据2020年各县域单元所处的适应性循环阶段将重庆市划分为生态修复区(K阶段)、生态控制区(r阶段)、生态保育区(α阶段)和生态提升区(Ir阶段)4个国土空间生态修复区。同时,基于潜力、连通度和韧性属性评估结果,采用Queen邻接方法构建空间权重矩阵对评价单元进行K-means空间聚类分析,当聚类数为5时可以在保证分区具有相对独立特征的同时避免分区过度碎片化,由此得到县级单元的空间聚类结果。将两类分区结果进行叠加,并结合重庆市自然环境与社会经济发展差异性,以及《重庆市生态功能区划》等相关政策要求,遵循功能主导性和综合性原则,将重庆市进一步划分为9个国土空间生态修复亚区(图7)。
图7
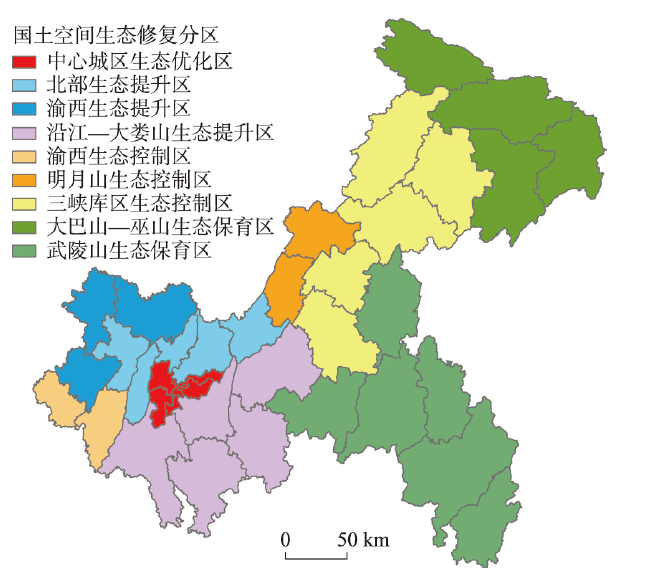
图7
重庆国土空间生态修复分区
Fig. 7
Ecological restoration zoning of territorial space in Chongqing City
4.3.1 生态修复区
该分区只含有1个亚区,即中心城区生态修复区,包含渝中、沙坪坝、南岸等7个区县,在所有分区中城镇化率和经济发展水平最高,但3维属性水平最低。该区域应实施系统的建成区生态修复工程。① 通过国土空间规划来推进建设用地减量化发展,提升生态空间比例和生态景观稳定性。同时,在建成区内开展绿地景观修复与建设,依托中梁山和铜锣山主要山体,营造系统结构完善、功能类型多样、城郊一体化的绿地系统,如森林湿地公园、社区花园、屋顶绿化等。② 进行生态廊道修复与建设,结合城市水网、路网引入生态要素,构成绿色廊道;尽可能地拓展廊道宽度、优化植物群落配置,巩固廊道联通城市生态节点的功能,提升城区绿色公共生态空间的连接度,以及市区与近远郊绿地景观之间的连通性,形成完整的绿网结构,增强绿地生态系统的整体效能。③ 加大生态整治工程投入力度,提升矿山修复、土地综合整治、污染和地灾治理等生态修复工作的精细化程度[27],并且加强环境保护宣传力度,鼓励清洁的生产和生活方式,不断加强系统对生态压力的响应。
4.3.2 生态提升区
该大区包含北部生态提升区、渝西生态提升区和沿长江—大娄山生态提升区3个亚区,共13个区县。未来,该区域应巩固好现有生态保护成果,保持3维属性与经济发展水平的协同提升。一是结合区域实际,逐步提高退耕还林、水土保持、矿山修复等生态保护修复工程的实施标准。二是优化区域各类生态要素,科学增设生态廊道,构建质量更高、韧性更强的生态网络格局。各亚区的生态修复策略如下:
(1)北部生态提升区。该区域包括北碚、渝北和璧山等5个区县,属川东平行岭谷区,区域人类活动集中,经济发展迅速,3维属性相差不大,但都处于较低水平。该区域应采取“山岭、平坝、河湖”协同的生态修复策略[27]。一是在云雾山、缙云山、铜锣山、中梁山、明月山5个生态源地持续实施森林抚育、退化林修复、现有林改培等工程,并加大矿山地质环境恢复治理工程实施力度。二是加强对平坝区的空间规划与管理,提高土地利用集约度,优化三生空间格局,提升生态景观集聚性与连通性。三是提升对嘉陵江、龙溪河和长寿湖等重要河湖湿地生态治理标准,搭配水岸带生态系统修复与河床底质多样性保护修复工程,建立稳定的湿地生态系统。
(2)渝西生态提升区。该区域包括合川区、潼南区和大足区,全区以丘陵地形为主,耕地占比高,生态空间规模小,3维属性均较低,其中又以潜力属性为最低。该区域应结合退耕还林、“四荒地”治理、疏林地补植封育为主的水土流失治理措施,充分挖掘生态空间提升潜力,不断优化地表植被覆盖。此外,还应实施农村土地综合整治,优化乡村景观和人居环境,完善农田基础设施,改善农田生态环境,并依托高标准基本农田打造田园综合体,发展一批生态成色足的乡村旅游、特色农产品等产业。
(3)沿长江—大娄山生态提升区。该区域包括江津、巴南、南川等5个区县,地势北低南高,3维属性中潜力与韧性较高而连通度较低。今后,该区域应依托长江、乌江、綦江、花溪河等天然廊道,大娄山生态源地以及大圆洞、圣灯山、桥口坝森林公园等生态节点,合理增设人工廊道,构建“一源、多廊、多点”的生态安全网络,串联区域各类生态要素,不断强化生态系统连通性。此外,还应加强对金佛山、四面山亚热带常绿阔叶林生态系统的保护与优化,拓展绿色生态廊道,改善野生动物栖息地环境。
4.3.3 生态控制区
该大区包含渝西生态控制区、明月山生态控制区和三峡水库生态控制区3个亚区,共7个区县。未来,该区应处理好发展与保护的关系,一是严格管控城镇开发边界,充分挖掘存量土地利用潜力,并增划生态保护红线,严控重要生态用地流失;二是加强生产、生活空间与生态空间之间的缓冲区建设,降低人类活动对生态系统的负面影响;三是着力探索“两山”转化路径,发展集约型复合农业和绿色生态产业,推动经济发展与生态保护的权衡关系转变为协同关系。各亚区的生态修复策略如下:
(1)渝西生态控制区。该区域包括永川区和荣昌区,全区生态空间占比小,工农业污染较严重,3维属性中潜力最低。该区域应加强封山育林、退耕还林还草等措施,限制开矿、林木采伐等人类活动,严禁陡坡垦荒和过度放牧,并保护好濑溪河湿地公园、黄瓜山和茶山竹海森林公园等重要生态源地,改善资源环境“潜力”不足的问题。此外,应深入开展工农业污染防治,加快调整产业结构,完善工业污染治理设施建设及运维管理等以降低工业“三废”排放,并推广精准施肥施药、废弃农膜回收、秸秆与畜禽养殖粪污资源化利用等来提升农业绿色化发展水平。
(2)明月山生态控制区。该区域包括垫江县和梁平区,拥有“山城”重庆少有的平坝地形,但自然植被覆盖差,人口集聚,永久基本农田占比大,水土资源协调度较差,3维属性均处于较低水平。该区域应在低山丘陵区开展生态退耕,降低坡耕地比例,同时加强农业区生态绿化建设,通过农田林网、交通干线和河流绿色廊道建设,提升生态景观连通度和水土保持能力。其次,不断完善水利设施,重视水库建设与流域管理,并加强农业面源污染治理力度,保护好基本农田品质,防止因水资源短缺、环境污染与水土流失等造成的土地生产力退化。
(3)三峡库区生态控制区。该区域包括丰都、忠县、万州等5个区县,位于三峡库区的腹心地区,区域内人口大多集聚在长江干支流沿岸[47],生态环境脆弱,潜力与韧性较高,但连通度较低。该区域生态修复的重点是依托长江水系,加强区域生态连通性。一是在长江干支流沿岸开展生态空间补“天窗”、接“断带”,并逐步调整三生空间分布结构,不断消除割裂的生态斑块;二是广泛开展河湖湿地保护修复,科学建设人工水道,连通调蓄、引排工程,构建多源互补的水网体系,提升长江岸线与生态腹地的连通性。此外,还应加强居民生活污水、船舶污染、农业面源污染治理、消落带综合整治等工程的实施力度,保护好长江干支流水环境。
4.3.4 生态保育区
生态保育区包含大巴山—巫山生态保育区和武陵山生态保育区两个亚区,包括奉节、巫溪、武隆、彭水等10个区县。区域植被覆盖度高,生态空间占比大,是重庆市生态服务功能最强的区域,其潜力属性在所有分区中处于最高水平。但也由于生态环境脆弱,地表起伏度大,再加上经济发展水平低,生态管理资金投入不足,环境基础设施落后等问题,导致连通度、韧性与潜力水平相差较大。总体上,该区域生态修复应从3个方面着手:① 实施森林质量精准提升工程,森林病虫害防治等工程,改善林分结构,提高山地常绿阔叶林生态系统的稳定性,同时加强对巫溪大官山、巫山葱坪、武隆仙女山、石柱千野、城口黄安坝等重要草场的原生态的保护与恢复,严控畜牧业与旅游业开发强度,进一步提升区域生态系统服务功能。② 加强野生动植物栖息地保护修复,修复受损的生态廊道,缓解栖息地丧失和生境破碎化问题。构建自然保护区网络体系,完善现有保护区内环境基础设施建设,并对珍稀濒危植物进行繁育,不断扩大其种群数量和分布范围。③ 通过生态补偿向该区域提供生态建设资金,并以点状供地方式支持其发展农林牧渔产品加工与物流、生态旅游和清洁能源等产业,形成特色经济。
此外,各亚区应加强区域生态问题治理,补齐生态“短板”:大巴山—巫山生态保育区水土流失与地质灾害较严重,应采取针对性的水土流失防治技术,适度提高水土流失防治标准,同时实施地灾防治工程,异地安置地灾风险地区居民;武陵山生态保育区土地石漠化与水土流失问题较严重,应探索喀斯特地区不同程度石漠化和水土流失的精准治理路径,在广泛开展退耕还林和天然林保护等措施的基础上,积极推动农村能源建设、畜牧圈养方式转型以及石漠化区域替代产业开发。
5 结论与讨论
5.1 结论
(1)适应性循环模型可为国土空间生态修复分区提供新的分析框架与方法。该模型认为系统具有潜力、连通度和韧性3维属性,并经历包括开发、保护、释放和重组4阶段的适应性循环过程,处于相同阶段的区域3维属性具有相似性,而处于不同阶段的区域3维属性具有差异性。
(2)2000—2020年重庆市国土空间3维属性整体呈现东高西低的空间分布特征,低值区主要分布在中心城区,高值区主要分布在东北部与东南部地区。各区县大多处于α阶段、r阶段和Ir阶段,有少部分处于K阶段,尚未有区县进入Ω阶段;处于K阶段的区县主要位于中心城区,处于α阶段的区县主要位于东北部与东南部地区;20年来,处于α阶段的区县空间分布较为稳定,处于其他阶段的区县空间分布不断变化。
(3)重庆市国土空间生态修复分区包含4个大区和9个亚区,需要对不同分区采取差异化的生态修复策略。总体上,生态修复区应实施系统的建成区生态修复工程,加强生态环境综合改良与治理力度;生态提升区应巩固好现有生态保护成果,逐步提高生态保护修复工程的实施标准,优化各类生态要素的协调度;生态控制区应限制国土空间开发强度,降低人类活动对生态系统的负面影响,并着力探索“两山”转化路径;生态保育区应优化自然生态系统功能、加强生态保护区管理与生态问题治理,同时发展特色经济。
5.2 讨论
目前学界对于潜力、连通度、韧性3维属性的具体含义及其与适应性循环4阶段的对应关系仍没有科学一致的解释,学者们大多根据所研究系统的具体情况来理解适应性循环,遇到无法解释的系统变化,往往还会对模型进行改进[22,31]。本文依据Luo等[23]的研究来解释适应性循环,并对其研究进行发展与改良。其研究认为Ω阶段的生态风险处于由高到低的变化趋势,r阶段的生态风险一直处于较低水平,这有违人们对于系统循环发展的一般认识。其次,仅依据单期生态风险评价结果来识别适应性循环阶段,而适应性循环过程往往更显著地呈现在生态风险多时段的变化中。本文更加清晰地界定了国土空间系统潜力、连通度与韧性3维属性的内涵,及其与各适应性循环阶段的对应关系。同时,以系统属性多期评价结果来分析适应性循环过程,力求提高循环阶段识别的科学性。
本文通过识别不同县域单元所处的适应性循环阶段,实现对重庆市生态系统属性差异的空间量化,丰富了生态修复分区研究的理论与方法体系,也拓宽了适应性循环模型的应用范围。研究揭示的国土空间系统3维属性时空格局和识别出的适应性循环过程为国土空间适应性管理提供了科学依据,提出的生态修复分区方案也为重庆市宏观层面的生态修复规划提供了科学支撑。据此,重庆市可以进一步完善国土空间生态修复格局与体系:中观层面上,编制区县级国土空间规划,通过优化景观格局、改善景观生态功能等途径落实上位规划;微观尺度上,通过生态修复专项规划布局生态修复工程项目,制定地块尺度的生态管制规则。
本文也存在不足之处。由于适应性循环阶段的转变是一个渐进过程,不同循环阶段的界限较为模糊,本文未找到可量化的准确阈值作为阶段划分的依据,这使得阶段划分结果难以避免地存在主观性,一定程度上影响了研究结果在实际应用中的可操作性。此外,为更精确地反映各行政单元所处的适应性循环阶段,也为了使研究结果能够更好地应用于规划管理实践,本文将分区单元选定为县级行政区,对县域单元的内部差异以及区域生态过程与生态系统的完整性考虑不足。地理学的尺度效应表明分区单元的尺度大小变化会影响分区结果[48]。因此,本文的结果可能会随着分区单元的缩小而发生变化,一定程度上限制了其在小流域、地块等更微观尺度的生态环境治理工作中的应用。今后的研究应继续完善适应性循环模型的理论与方法体系,形成科学的阈值提取方法。同时,还应着力解决生态修复规划的空间尺度衔接问题,形成不同尺度地理单元的国土空间生态修复分区体系,以便更好地服务区域国土空间生态修复规划编制及实施。
参考文献
Systematic cognition of ecological protection and restoration of mountains-rivers-forests-farmlands-lakes-grasslands
山水林田湖草生态保护修复的系统性认知
Review of spatial identification of ecological restoration
区域尺度生态修复空间辨识研究进展
Comprehensive function zoning of national land space for Wuhan metropolitan region
DOI:10.11821/dlyj201703012
[本文引用: 2]

Comprehensive function zoning of national land space plays a significant role in optimizing development and spatial pattern of national land space. Taking Wuhan metropolitan region as a case study area, we performed an empirical study of the comprehensive function zoning of land space. Firstly, from the perspective of production, livelihood, and ecology functions, we selected 24 indicators to represent multiple thematic elements, such as land resources, water resources, eco-environment, and socio-economic factors. Second, we built up an evaluation system based on these factors and functions. We then calculated and presented the percentages of 10 kinds of sub-functions (namely, supply of primary, secondary, and tertiary products, provision of forestry, livestock, and aquatic products, supply of mineral resources, urban and rural residence, and ecological regulation) for the evaluated units. Next, we evaluated the carrying capacity of the production-livelihood-ecology function provided by national land space using the BP neural network approach. Finally, with dual-constraint spatial cluster algorithm, we confirmed the final comprehensive function zones of national land space, and correspondingly provided specific regional regulation policies and implication for each function zone. Theoretically, in this study, based on these 10 key functions of national land space and the consistent indicators and evaluation system, we initially presented the multiple functions of the zones in percentages from the county level, and then scaled up to the city level, which facilitates the integration and disaggregation of multiple functions for zones across levels. Practically, the results showed that Wuhan metropolitan region can be divided into western production-livelihood zone, northeast production-ecology zone, and southeast livelihood-ecology zone at the first level, and seven sub-zones at the second level. Furthermore, four corresponding types of policy, including "key protection", "general protection", "general development” and "key development", were attached to each sub-zone. This study will shed light on theoretical framework and practices of national land planning and national land resources regulation, and also provide reference forland development pattern and optimal allocation of land resources for Wuhan metropolitan region.
武汉城市圈国土空间综合功能分区
DOI:10.11821/dlyj201703012
[本文引用: 2]
以武汉城市圈为典型案例区开展国土空间综合功能分区实证研究。首先基于县域土地利用数据、社会经济数据和补充调查数据,从生产、生活和生态(三生)功能角度遴选出表征国土空间不同主题要素的24个指标因子,构建基于“要素—功能”的评价指标体系;然后从评价单元开始对10类空间二级功能进行比例关系表达,并通过BP神经网络方法评价三生功能承载力;最后引入双约束聚类法划定国土空间综合功能区,并匹配相应的调控政策。研究表明:基于统一的功能分类和指标体系实现功能比例表达在不同尺度间传递;武汉城市圈国土空间可划分为3个一级综合功能区和7个二级综合功能区。研究成果可为武汉城市圈国土空间格局优化提供参考。
Spatial zoning for land ecological consolidation in Guangxi based on the ecosystem services supply and demand
DOI:10.31497/zrzyxb.20200118 URL [本文引用: 2]
基于生态系统服务供需关系的广西县域国土生态修复空间分区
Trade-offs in ecosystem services based on a comprehensive regionalization method: A case study from an urbanization area in China
Ecological zoning for regional sustainable development using an integrated modeling approach in the Bohai Rim, China
DOI:10.1016/j.ecolmodel.2016.09.027 URL [本文引用: 1]
Spatio-temporal variation of ecological risk in the loess hilly-gully region and its precaution partitions: A case study of Mizhi County, Shaanxi Province, China
DOI:10.31497/zrzyxb.20190916 URL [本文引用: 2]
黄土丘陵沟壑区生态风险时空动态及其风险分区: 以陕西省米脂县为例
Hadrochemical evolution of groundwater in a typical semi-arid groundwater storage basin using a zoning model
Regionalization of water environmental carrying capacity for supporting the sustainable water resources management and development in China
DOI:10.1016/j.resconrec.2018.03.030 URL [本文引用: 1]
Regionalization of soil and water conservation aimed at ecosystem services improvement
To effectively control soil erosion, three hierarchies of the National Soil and Water Conservation Regionalization Scheme have been established in China. However, the scheme has its limits, which can be summarized by two points: first, the tertiary hierarchy functional region exhibits obvious heterogeneity; second, the ecosystem function does not influence the regionalization scheme results during the process of regionalization. To enhance the guidance of the regionalization, a new indicator system included soil erosion risk, soil erosion intensity and ecosystem service value was developed to explore the subdivision of the tertiary hierarchy functional region. Moreover a scheme for the subdivision of the tertiary hierarchy functional region was formed. In this scheme, the central Hunan hilly soil conservation and living environmental protection section was divided into three subregions: Luoxiao-Xuefeng Mountain high ecological value section, Xiangjiang middle and downstream medium ecological value section, and Hengyang Basin low ecological value section. Specifically, with regard to soil and water conservation regionalization, the concept of subregions within the tertiary hierarchy-based functional region was proposed and the new indicator system that highlighted ecosystem functions was applied for the first time on a regional scales; this method provides a new way of thinking about other regionalization schemes.
Ecological restoration zoning for a marine protected area: A case study of Haizhouwan National Marine Park, China
Land consolidation zoning in coastal tidal areas based on landscape security pattern: A case study of Dafeng District, Yancheng, Jiangsu Province, China
Definition of management zones for enhancing cultivated land conservation using combined spatial data
DOI:10.1007/s00267-013-0124-7
PMID:23921549
[本文引用: 1]
The loss of cultivated land has increasingly become an issue of regional and national concern in China. Definition of management zones is an important measure to protect limited cultivated land resource. In this study, combined spatial data were applied to define management zones in Fuyang city, China. The yield of cultivated land was first calculated and evaluated and the spatial distribution pattern mapped; the limiting factors affecting the yield were then explored; and their maps of the spatial variability were presented using geostatistics analysis. Data were jointly analyzed for management zone definition using a combination of principal component analysis with a fuzzy clustering method, two cluster validity functions were used to determine the optimal number of cluster. Finally one-way variance analysis was performed on 3,620 soil sampling points to assess how well the defined management zones reflected the soil properties and productivity level. It was shown that there existed great potential for increasing grain production, and the amount of cultivated land played a key role in maintaining security in grain production. Organic matter, total nitrogen, available phosphorus, elevation, thickness of the plow layer, and probability of irrigation guarantee were the main limiting factors affecting the yield. The optimal number of management zones was three, and there existed significantly statistical differences between the crop yield and field parameters in each defined management zone. Management zone I presented the highest potential crop yield, fertility level, and best agricultural production condition, whereas management zone III lowest. The study showed that the procedures used may be effective in automatically defining management zones; by the development of different management zones, different strategies of cultivated land management and practice in each zone could be determined, which is of great importance to enhance cultivated land conservation, stabilize agricultural production, promote sustainable use of cultivated land and guarantee food security.
Assessing land ecological security in Shanghai (China) based on catastrophe theory
DOI:10.1007/s00477-011-0457-9 URL [本文引用: 1]
Assessment and zoning of eco-environmental sensitivity for a typical developing province in China
DOI:10.1007/s00477-011-0550-0 URL [本文引用: 1]
Space regionalization based on resources and environmental carrying capacity
基于资源环境承载力的国土空间管制分区研究
Territorially ecological restoration zoning based on the framework of degradation pressure, supply state and restoration potential: A case study in the Pearl River Delta region
基于“退化压力—供给状态—修复潜力”框架的国土空间生态修复分区: 以珠江三角洲为例
Exploration of ecological restoration pattern and countermeasure along the Yangtze River in Jiangsu province based on the "element-landscape-system" framework
DOI:10.31497/zrzyxb.20200113 URL [本文引用: 4]
基于“要素—景观—系统”框架的江苏省长江沿线生态修复格局分析与对策
Principle and method for ecological restoration zoning of territorial space based on the dominant function
基于主导功能的国土空间生态修复分区的原理与方法
Towards a land management approach to ecological restoration to encourage stakeholder participation
DOI:10.1016/j.landusepol.2015.01.025 URL [本文引用: 1]
Collapse and recovery in a remote small island: A tale of adaptive cycles or downward spirals?
DOI:10.1016/j.gloenvcha.2008.11.005 URL [本文引用: 4]
Assessing urban landscape ecological risk through an adaptive cycle framework
DOI:10.1016/j.landurbplan.2018.08.014 URL [本文引用: 4]
Urban landscape ecological risk assessment based on the 3D framework of adaptive cycle
DOI:10.11821/dlxb201507003
[本文引用: 2]
As the city social-ecological system was regarded as the risk assessment target, a 3D framework of ecological adaptive cycle was built, which extended the landscape ecological risk assessment indicators to the potential-connectedness-resilience 3D criteria from the former landscape index level. Emphasis was placed on the principle of static spatial pattern with interactive dynamic trend from a geographical spatial analysis view. It was believed that the 3D framework could describe the pattern-process interaction with specific landscape elements much more clearly. Taking Shenzhen city as a study area, this study adopted the 3D framework of ecological adaptive cycle in building a landscape ecological risk assessment index system with the help of GIS spatial analysis method. Different scenarios were established based on the ordered weighted averaging (OWA) algorithm in the risk assessment. The results show that among the three scenarios, the concrete value of landscape ecological risk showed a similar distribution trend that the Dapeng Peninsula had the lowest landscape ecological risk in Shenzhen city; Yangtai Mountain and Bijiashan Park showed relatively low risks in the city area, even though the risks in each scenario were specifically different. This indicated that the choice of the specific threshold in "development" or "protection" largely depended on the city development strategy created by decision makers under current cognition. The emphasis of scenario tradeoff was extracting the risk and uncertainty interval rather than an optimal value. The development or protection methods through each of the specific planning objectives would be the ultimate goal of the ecological risk assessment at a regional scale. The evaluation in this study improved the landscape ecological risk assessment indices and methods based on the adaptive cycle concept, which reflected the spatiotemporal dynamics and exposure disturbed by human interference. Furthermore, the preference transform in OWA method reduced the uncertainty caused by the subjective risk assessment, which could improve the theoretical basis as well as maneuverability in urban planning. This study not only extended the landscape ecological risk assessment to spatial-temporal integration perspective, but also made a significant improvement in ecological risk assessment of landscape indicator system. Therefore, the results of this study could offer a powerful quantitative support for landscape development and protective measures effectively, such as city construction and demarcation of ecological control line.
基于生态适应性循环三维框架的城市景观生态风险评价
DOI:10.11821/dlxb201507003
[本文引用: 2]
本研究以城市社会—生态系统为风险评价对象,引入生态适应性循环三维框架,将景观生态风险评价指标从单一的景观指数层面扩展至“潜力—连通度—恢复力”三维准则,并以深圳市为研究区,基于有序加权平均(OWA)算法对评价结果进行情景设置。研究结果显示,评价中干扰指标主要影响风险评价结果属性值域,而风险空间格局则受暴露指标制约;深圳全市景观生态风险整体呈现“西高东低”的分布格局,城市新建成区风险最高,大鹏半岛风险最低,羊台山与笔架山公园则是城区内部的相对风险低值区;基于OWA方法设置情景偏好,绘制“忽视”、“正常”及“重视”三种风险情景下的城市景观生态风险图。本研究基于生态适应性循环理念集成社会—生态系统时空动态干扰与暴露指标表征城市景观生态风险,并通过OWA方法变换主观偏好、降低评价不确定性,可以满足不同发展思路下的城市开发布局需求,从而为城市景观发展空间权衡提供决策支持。
Dual adaptive cycles in implementing integrated coastal management
Research on the pattern and supporting measures of ecological protection and remediation in the ecotope of Ridge and Valley Province: Based on the pilot project of ecological protection and remediation of "two rivers and four mountains" in Chongqing
平行岭谷生态区生态保护修复的思路、模式及配套措施研究: 基于重庆市“两江四山”山水林田湖草生态保护修复工程试点
Coupling coordination evaluation and sustainable development pattern of geo-ecological environment and urbanization in Chongqing municipality, China
Synergistic evolution mechanism of "production-living-ecology" functions in spatial planning system: A case study of Fuxin City
国土空间系统“三生”功能协同演化机制研究: 以阜新市为例
Analyzing spatial characteristics of urban resource and environment carrying capacity based on covert-resilient-overt: A case study of Wuhan city
DOI:10.11821/dlxb202110008
[本文引用: 2]
The resources and environment carrying capacity (RECC) is a barometer of the development of urban territory space, so exploring the spatial characteristics of RECC is greatly significant for optimizing the territory spatial pattern. In this context, this paper uses new urban geographic information data, such as night-time lights and atmospheric remote sensing, points of interest, historical traffic situation and social media, on the basis of relevant procedures and guidelines. Furthermore, a theoretical framework based on the covert-resilient-overt analysis of the spatial characteristics of urban RECC is proposed, and a method combining spatial autocorrelation and fractal geometry is developed for spatial characteristics mining of RECC. Taking Wuhan as an example to carry out research, the results show that: (1) The distribution of RECC in Wuhan has significant spatial heterogeneity. Areas with higher covert carrying capacity are concentrated in the Huangpi District and Xinzhou District with superior ecological environment in the northern periphery of the city, areas with high resilient carrying capacity are concentrated in the central urban area with strong comprehensive risk response capabilities, and areas with high overt carrying capacity are located in the sub-center of the city with sound basic functions. (2) The RECC in Wuhan has positive spatial aggregation, and it shows significant radius-centripetal fractal and circle characteristics. The areas of high covert carrying capacity spread radially around, and the areas with high resilient carrying capacity are concentrated in the core of the city in a centripetal shape, the areas with high overt carrying capacity are between the areas with high values of covert and resilient carrying capacity. In conclusion, the spatial characteristics analysis and mining method system of urban RECC constructed in this paper make up for the shortcomings of the low dynamics of traditional data by introducing multi-source spatial temporal data, and improves the theoretical and technical paradigm of urban RECC research. The research provides a new way of thinking for the carrying capacity of urban resources and environment.
基于隐性—韧性—显性的武汉城市资源环境承载力空间特征
DOI:10.11821/dlxb202110008
[本文引用: 2]
资源环境承载力是衡量城市国土空间发展状况的晴雨表,深入揭示资源环境承载力系统要素的相互作用机理对城市国土空间格局优化具有重大意义。本文在双评价指南的基础上引入夜光/大气遥感、兴趣点、交通态势、社交媒体等多源时空数据,建立了基于隐性—韧性—显性的城市资源环境承载力空间特征分析理论框架,提出了空间自相关和分形几何相结合的承载力空间特征挖掘方法。以武汉市为例开展研究,结果表明:① 武汉市资源环境承载力呈显著空间异质性,隐性承载力指数高值区分布于城市外围生态环境优越的区域,韧性承载力指数高值区集中于综合风险应对能力较强的中心城区,显性承载力指数高值区位于各项基础功能均较为健全的城市次中心一带;② 武汉市资源环境承载力存在正向空间聚集性,并呈显著半径向心分形特征,隐性承载力指数高值区呈放射状向四周扩散,韧性承载力指数高值区呈向心状聚集在城市核心圈层,显性承载力指数高值区分布于则介于二者之间。本文构建的城市资源环境承载力空间特征分析与挖掘方法体系,通过引入多源时空数据弥补了传统数据现势性的不足,完善了城市资源环境承载力研究的理论和技术范式,可为新时期城市资源环境承载力研究提供一种新思路。
The adaptive cycle: More than a metaphor
Operationalizing one health employing social-ecological systems theory: Lessons from the greater Mekong sub-region
The idea of the interdependency of the health of humans, animals, and ecosystems emerged from the interplay of theory and concepts from medicine, public health and ecology among leading thinkers in these fields during the last century. The rationale for One Health and its focus on the "human, animal, and environmental interface" stems from this legacy and points to transdisciplinary, ecological and complex systems approaches as central to One Health practice. Demonstration of One Health's efficacy, its wider adoption and continual improvement require explicit operational criteria and evaluation metrics on this basis. Social-Ecological Systems Theory with its unique conception of resilience (SESR) currently offers the most well-developed framework for understanding these approaches and development of performance standards. This paper describes operational criteria for One Health developed accordingly, including a protocol currently being tested for vector borne disease interventions. Wider adoption of One Health is most likely to occur as One Health practitioners gain an increasing familiarity with ecological and complex systems concepts in practice employing a transdisciplinary process. Two areas in which this inevitably will be required for significant further progress, and where the beginnings of a foundation for building upon exist, include: (1) Emerging and re-emerging zoonotic diseases, and (2) successful implementation of the United Nations (UN) Sustainable Development Goals (SDGs). The former includes the challenge of stemming the threat of new microbial pathogens, anti-microbial resistant variants of existing pathogens, as well as resurgence of malaria and other recalcitrant diseases. The applicability of SESR in this regard is illustrated with two case examples from the Greater Mekong Subregion, Avian Influenza (H5N1) and Liver Fluke (. Each is shown to represent a science and policy challenge suggestive of an avoidable social-ecological system pathology that similarly has challenged sustainable development. Thus, SESR framing arguably is highly applicable to the SDGs, which, to a large extent, require consideration of human-animal-environmental health linkages. Further elaboration of these One Health operational criteria and metrics could contribute to the achievement of many of the SDGs.
Shooting the rapids: Navigating transitions to adaptive governance of social-ecological systems
Assessment on ecological risk of Danjiangkou reservoir area based on adaptive cycle
基于适应性循环的丹江口库区生态风险评价
China's regional sustainability assessment on mineral resources: Results from an improved analytic hierarchy process-based normal cloud model
DOI:10.1016/j.jclepro.2018.10.324 URL [本文引用: 1]
The value of the world's ecosystem services and natural capital
DOI:10.1016/S0921-8009(98)00020-2 URL [本文引用: 1]
Assessing potential ecosystem service dynamics driven by urbanization in the Yangtze River Economic Belt, China
Study on landscape ecological risk assessment and spatial differentiation of Qinglong Manchu Autonomous County based on explicit and implicit analysis
基于显隐性分析的青龙满族自治县景观生态风险评价空间分异研究
Study on land use change in a small typical catchment in loess hilly area: A case study in Danangou catchment, Yan'an, Shaanxi province
黄土丘陵区典型小流域土地利用变化研究: 以陕西延安地区大南沟流域为例
Ecological risk assessment of small watershed of the Three Gorges Reservoir area based on land use change: A case study of Caotang River
基于土地利用变化的三峡库区小流域生态风险评价: 以草堂溪为例
Spatiotemporal changes of ecosystem service value determined by national land space pattern change: A case study of Fengdu County in the Three Gorges Reservoir area, China
Research on environmental governance effects of China's fiscal and taxation policy: Empirical analysis based on provincial panel data
中国财税政策的环境治理效应研究: 基于省级面板数据的实证分析
energy consumption and pro-environmental choices of Chinese households
Carbon emission accounting and spatial heterogeneity pattern of China's energy supply side
中国能源供给侧碳排放核算与空间分异格局
Resilience thinking:Sustaining ecosystems and people in a changing world
Modeling spatiotemporal population changes by integrating DMSP-OLS and NPP-VIIRS nighttime light data in Chongqing, China
