

1 引言
居民城际出行是指居民为了满足某一生产、生活目的,采用某种交通方式,从出发城市(起点)到目的城市(讫点)完成行程的活动。居民的城际出行是生产要素在空间上重新集聚与扩散的重要推手[1-2]。随着区域交通、信息基础设施一体化建设的不断推进,愈发显著的“时空压缩”效应在提升居民可移动性的同时,也使得城际出行呈现出常态化、规模化、复杂化等特征[3]。信息流、技术流、资金流等跨越物理距离在城市间的频繁交换催生了新的空间组织逻辑——“流空间”,其在重塑地理空间的同时,也推动了城市空间网络的发展[4]。在全球化和世界城市网络化的背景下,“流空间”逐渐代替“地方空间”,成为当下区域和城市研究的热点议题,居民出行所构成的动态网络对区域城市发展也产生了愈发深刻的影响。不同时间、地点、交通方式约束下居民出行的目的、出行的空间范围、出行的模式等有所差别,所折射出的人口流动模式及其蕴含的地理空间关联特征也因此具有差异性。随着飞机、高铁等交通工具的全面普及,具有目的性、时间性的居民出行不仅跨越了距离空间,而且在特定时间、地点呈现出聚集特性,使得城市间的联系越发紧密。尽管居民城际出行加强了区域间的交流与合作,但由于社会发展的不稳定性和不确定性,大规模的居民出行也容易加剧舆论、疫情等的爆发与扩散。尤其在新型冠状病毒肺炎疫情持续蔓延给全球经济带来巨大冲击的背景下,认识和挖掘居民出行背后的出行模式,不仅有助于摸清居民出行规律,而且对区域疫情防控决策和社会经济发展规划的制定有重要参考价值。
城市空间作为流要素的主要载体,基于人口迁徙“流数据”的居民城际出行近年来引起了国内外众多学者的关注。从研究角度来看,已有研究多从特殊的出行目的(如商务、旅游、通勤等)[5-6]、特殊的出行时段(如日常、国庆黄金周、“春运”等)[7-8]及特定的出行方式(如飞机、火车、汽车、私家车等)[5,9⇓ -11]等方面展开。采用的研究数据,从早期的入户访谈、问卷调查或邮件调查等人工采集数据[12-13]逐渐转变为基于GPS定位数据的公交刷卡、手机信令等签到数据[14-15]。近年来,基于地理位置的服务(Location Based Services, LBS)技术记录的大规模人口迁徙足迹的多元化数据,如国外常用Twitter、Facebook等社交媒体数据[16-17],国内常用百度、腾讯迁徙数据等,为居民出行研究提供了新的契机[7,18]。研究的空间尺度涉及全球、区域、城市等[19⇓⇓-22]。综合来看,多视角和多尺度的居民出行网络研究正在成为认识城市间复杂空间关系的重要途径。然而,现有的居民出行相关研究视角仍较为单一,或选取某一时段,或聚焦某一出行方式,或限于某个特定的城市群或地区,鲜见不同时段、不同交通方式、多城市群的全国性研究案例。其次,部分居民出行网络空间结构研究在分析中忽略了流的方向性,从而导致对城市节点间不对称关系的低评或高估。由于数据获取的多源性及时段选取的偏差性,使得不同研究所获得的居民出行规律及其背后的城市网络空间格局往往存在较大差异。
鉴于此,本文采用腾讯迁徙数据,从不同时段(全年、日常、特殊节假日、“春运”)、不同交通方式(航空、铁路、公路)及城市群不同出行形式(对内、对外)等多个视角出发,在构建居民城际出行网络的基础上,利用社会网络分析和GIS空间分析方法,从“点—线—网”等层面展开2018年全国居民城际出行网络空间结构特征与出行模式的挖掘,以揭示居民城际出行在不同时期、不同出行方式及不同空间尺度下的空间格局及规律,以期从区域人口集散的角度为区域一体化、扁平化协同发展提供科学参考。
2 数据来源与研究方法
2.1 数据来源
本文采用的人口迁徙大数据获取自腾讯位置大数据平台(
2.2 研究方法
以中国346个城市为研究区,基于腾讯迁徙数据,从出行时段、出行方式及城市群对内、对外联系等视角构建居民城际出行网络,先从“点—线—网”层面展开网络空间结构特征的研究,再根据城市群域内城市间、城市群城市与国内城市间的居民城际出行网络对城市群对内、对外的出行模式进行挖掘,技术流程如图1所示。基于居民城际出行出发地—目的地(Origin-Destination, OD)矩阵对居民城际出行网络进行构建,采用社会网络分析和GIS空间分析方法对网络空间结构特征进行揭示和可视化。节点层面,通过加权度、介数中心性、转变中心性、转变控制力等对城市节点在出行规模、中心性、城市等级等方面的特征进行刻画;联系层面,采用首位联系、城际关联优势度等对城际关联的层级结构及空间邻近效应进行反映;网络层面,选取网络密度、特征路径长度、平均集聚系数、网络重心等对居民城际出行网络的关联关系、空间集聚效应及重心迁移等进行体现。
图1
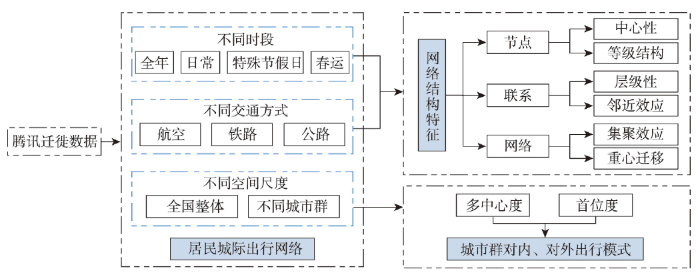
(1)居民城际出行OD矩阵。针对全年、日常、特殊节假日、“春运”4个时段,以及飞机、火车、汽车3种交通方式,分别构建346×346居民城际出行OD矩阵,获得居民城际出行网络。另外,针对12个城市群,利用全年的居民城际出行数据,通过提取城市群对内及对外的居民城际出行OD矩阵,构建不同城市群对内、对外居民城际出行网络。
式中:RSIij为城际关联优势度,0 ≤ RSIij ≤ 1;Rij为城市i到城市j的居民出行规模。
(4)网络重心。反映各个方向城市节点的居民出行规模处于平衡的位置,公式为[30]:
式中:(X, Y)为网络重心坐标;(xi, yi)是节点i的经、纬度坐标;wi是节点i的权重,用加权度表示。
式中:ACi、APi分别为节点i的转变中心性和控制力;pij为依存度参数;Rij为城市i到城市j的居民出行规模;WDCi为城市i的加权度。
3 结果分析
3.1 居民城际出行网络的总体特征
3.1.1 不同时段的网络特征
从全年、日常、特殊节假日和“春运”4个时段居民城际出行网络的总体属性(表1)可知,“春运”、特殊节假日和日常时段的居民城际出行规模差异显著。2018年中国居民城际出行规模中,“春运”、特殊节假日分别占15.72%、11.57%,“春运”的日均出行规模最高,其次为特殊节假日,是日常出行的2倍以上。从各时段网络的拓扑属性来看,全年居民城际出行涉及的城市区域更广,出行线路达2.38万条,网络密度最高,其次为“春运”、日常和特殊节假日。特征路径长度则呈相反趋势,说明随着居民城际出行网络中城市节点的增加,城市间的路径距离呈缩短之势,网络的通达性有所提高。特殊节假日网络的平均集聚系数高于“春运”、全年和日常时段,说明特殊节假日期间,居民的城际出行集聚程度更高,城市节点间的联系更紧密。
表1 不同时段居民城际出行网络的总体属性
Tab. 1
| 时段 | 线路(条) | 网络密度 | 特征路径长度 | 平均集聚系数 |
|---|---|---|---|---|
| 全年 | 23829 | 0.199 | 1.801 | 0.420 |
| 日常 | 12540 | 0.105 | 1.908 | 0.401 |
| 特殊节假日 | 10987 | 0.100 | 1.930 | 0.450 |
| “春运” | 14106 | 0.118 | 1.903 | 0.442 |
依据自然断裂法对全年和日常时段网络进行层级划分,特殊节假日和“春运”时段均以日常时段为准,结果如图2(共5个层级,第五层级为基座网络,由于线路众多,图中不展示,以保证显示效果)所示。就全年和日常时段网络而言,其空间格局基本相似,第一层级(深棕色线路)主要为上海↔重庆、重庆↔北京、北京↔上海、深圳↔上海、成都↔深圳、长沙↔北京、广州↔上海等跨区域以及广州↔佛山、深圳↔东莞、上海↔苏州、北京↔廊坊、西安↔咸阳等邻域的双向稳定居民出行;第二层级基本呈“梯形”空间分布格局,为“钻石形”结构的扩散与填充,全年居民城际出行线路更为密集;第三层级体现为以国家级城市群核心城市为主导,辐射区域中心城市的跨区域大范围城际出行;第四层级体现的是区域中心城市对周边城市的辐射效应,“胡焕庸线”以东为高密度区,尤其在“钻石型”内部形成低流量的密集分布,西部地区仅形成以省会城市为核心、辐射邻域城市的低密度区。
图2
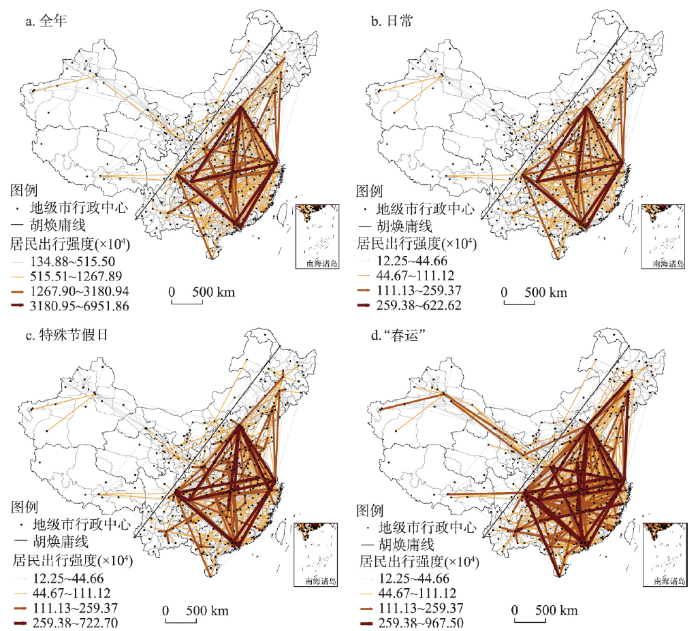
图2
2018年不同时段中国居民城际出行网络的空间格局
注:基于自然资源部标准地图服务网站GS(2020)4630号的标准地图制作,底图边界无修改。
Fig. 2
Spatial pattern of residents' intercity travel network in different time periods in 2018
相较于日常网络,特殊节假日和“春运”时段的大规模城际出行线路明显增多,且城市的人口承载压力普遍加大。第一层级的出行线路分别呈现比日常时段更为健壮的“钻石型”空间结构,尤其是“春运”时段,由于其复杂的出行目的(如返乡、求学、旅游、探亲等叠加),短、中、长途城际出行短时间内剧增,第二层级就已形成辐射省会城市的跨区级网络。此外,除第五层级外,各层级的日常出行线路均低于特殊节假日和“春运”时段,如第一层级,日常、特殊节假日和“春运”时段的出行线路分别为25条、51条和69条,分别承载9.97%、11.37%、11.77%的城际出行规模。日常、特殊节假日和“春运”网络前20%的线路均达到各时段总出行规模的80%左右,换句话说,各时段的居民城际出行基本呈“帕累托分布”,也说明居民城际出行网络具有无标度特性。
3.1.2 不同交通方式的网络特征
从航空、铁路和公路居民城际出行网络的总体属性(表2)可知,铁路网络的线路密度最高,航空网络最低。铁路、公路、航空分别占出行总量的48.77%、31.38%、19.85%。特征路径长度公路>航空>铁路,而平均集聚系数公路>铁路>航空。通过与同规模的随机网络比较发现,三大网络均具备平均路径长度接近、集聚系数较高的特点,即三大网络均具有小世界特性。具体来看,公路网络尽管城市节点间的集聚程度最高,但其出行路径长度却也最长,说明公路网络更偏向短途出行,对于长途出行而言,其中转的几率最高。铁路网络的集聚程度虽不及公路网络,却具有最短的特征路径长度,是最灵活的出行方式。航空网络具有较为松散的城际连接和较短的特征路径长度,说明其侧重长途出行。此外,通过统计3种交通方式下出行距离的频数分布发现,当出行距离在1000 km以内时,公路与铁路网络存在着一定的协作与竞争关系,铁路交通虽较为稳定和便利,但公路交通对衔接城乡、拉动地方功不可没;当出行距离高于1000 km时,铁路与航空网络竞争激烈,主要得益于高铁的普及与提速,其对航空的旅行人数有所分流。
表2 不同交通方式居民城际出行网络的总体属性
Tab. 2
| 交通方式 | 线路(条) | 网络密度 | 特征路径长度 | 平均集聚系数 |
|---|---|---|---|---|
| 航空 | 16351 | 0.136 | 1.865(1.862) | 0.301(0.139) |
| 铁路 | 22631 | 0.189 | 1.812(1.826) | 0.412(0.174) |
| 公路 | 17717 | 0.148 | 1.947(1.861) | 0.454(0.140) |
注:括号中的值为同规模随机网络对应的属性值。
不同交通方式城际出行网络的空间层级结构如图3所示。航空和公路的居民城际出行强度均依据铁路的分级标准,图3中不展示第五层级线路。航空网络中(图3a),第一层级线路呈“钻石形”空间结构,其中,在京、沪、蓉—渝和穗—深等顶点城市中,重庆↔北京、重庆↔上海、上海↔北京的强人口出行在空间上形成航空“铁三角”;深圳↔上海、广州↔上海的较强人口出行体现出上海对穗、深的显著虹吸效应;成都↔深圳、广州↔成都则显现出成都作为西部城市窗口,在城际出行网络中承担的重要集散功能。在“钻石形”结构内部,长沙↔北京、成都↔南京的航空出行规模较高,长沙与北京之间的居民出行基本对称,但成都到南京的出行明显高于其逆向线路,表现为南京的较强吸引;此外,尽管长春↔上海呈现相对较弱的航空联系,但能够跻身于第一层级,说明长春作为东北地区的典型城市,承担着东部城市与东北地区重要的航空人口集散功能。第二层级线路在对“钻石形”结构进行填充的同时,分别由北京、上海、武汉、南京向东北地区扩张,由武汉、成都向西南地区扩张。第三、四层级线路均为依托东部核心城市发育的大区域范围较弱边缘航线,沿途进一步充实“钻石形”内部,尤其在西部地区形成了以乌鲁木齐为起、讫点的邻、跨区域出行。
图3
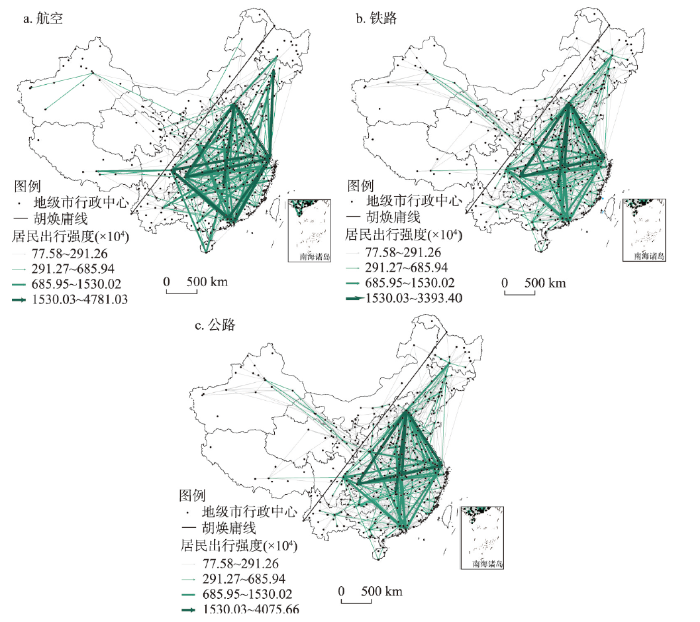
图3
2018年不同交通方式中国居民城际出行网络的空间格局
注:基于自然资源部标准地图服务网站GS(2020)4630号的标准地图制作,底图边界无修改。
Fig. 3
Spatial pattern of residents' intercity travel network under different traffic modes in 2018
铁路网络中(图3b),第一层级线路主要为由航空“铁三角”城市形成的“三角形”空间结构,武汉↔北京、长沙↔北京的强人口出行对其有所加固。其次,广州↔佛山、西安↔咸阳、深圳↔东莞、北京↔廊坊等近距离强出行规模也体现了城际轨道交通的强集散功能。第二层级主要呈现以“钻石型”结构为主体,由顶点城市向其周边城市较强集散的空间特征。此外,哈尔滨跻身第二层级,说明其作为区域门户城市,在东北铁路出行中承担着首要集散功能。第三、四层级线路相较于航空网络呈东北、西南、西北地区覆盖密度更高的“核心—边缘”分布特征,且其“沿途效应”明显。
公路网络中(图3c),第一、二层级线路主要为围绕深圳、上海、广州、北京、西安、武汉、成都、郑州等国家及区域典型城市的强邻域居民出行。第三、四层级由于行政管辖边界的分割,在区域内建构起以城市群核心城市或省会城市为集散中心的居民出行网络。
3.2 居民城际出行网络空间格局
3.2.1 等级规模特征
(1)中心性。通过介数中心性来测度不同交通方式网络中城市节点的中转和衔接能力,结果(图4)表明,航空、铁路和公路网络中,高介数中心性城市的数量较少且多为“胡焕庸线”以东城市,说明地级城市作为中介发挥“中转站”的能力在东、西部地区发展差距较大。高介数中心性(≥ 3485.87)城市,航空网络中共6个,均为“钻石型”空间结构的顶点城市;铁路网络中仅包含3个,为“三角形”结构的顶点城市上海、北京、重庆;公路网络中高介数中心性城市数量与航空网络相同,但空间分布差异明显,主要为“铁三角”及其沿线交通枢纽城市。上海是航空和铁路网络中介数中心性排名首位的城市,重庆则是公路网络中介数中心性排名首位的城市,在各自出行网络中承担着极其显著的人流集散和枢纽功能。
图4
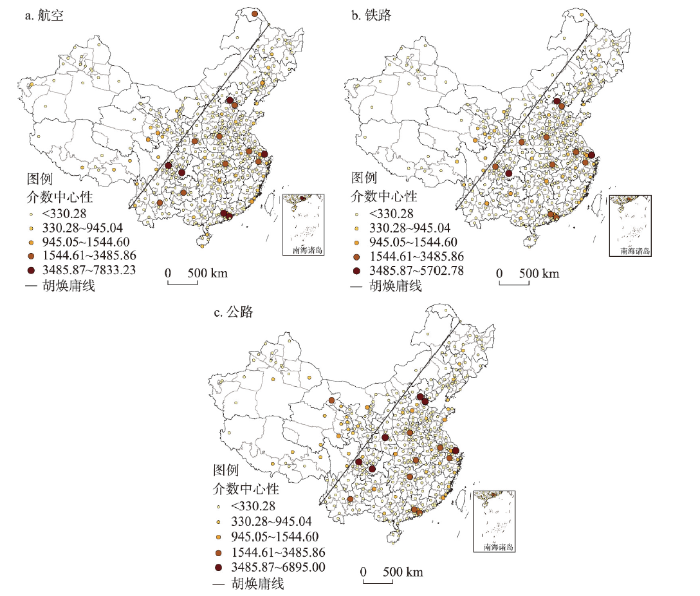
图4
不同交通方式下中国城市节点的介数中心性
注:基于自然资源部标准地图服务网站GS(2020)4630号的标准地图制作,底图边界无修改。
Fig. 4
Betweenness centrality of urban nodes under different traffic modes
较高介数中心性(1544.61~3485.86)城市在三大网络中的数量相同,均为9个。航空网络中呈由东北至西南的分散分布模式;铁路网络中呈围绕“钻石型”结构的集中分布模式;公路网络中则呈由东南向西北延伸的较分散分布模式。中介数中心性(945.05~1544.60)城市在三大网络中分别呈“V”“X”“O”型空间分布,数量分别为6个、6个、9个。公路网络中,中介数中心性城市数量最多,主要是由于公路网络中城际出行距离较短、中转概率更高的缘故。较低介数中心性(330.28~945.04)城市在航空、铁路和公路网络中的数量分别为30个、32个、36个,在公路网络中具有更广的分布范围。
(2)等级结构。自Neal[19,31]区分了城市中心性与控制力的差异以来,相关研究认为转变中心性与转变控制力共同决定了城市在网络中的地位[21,32]。为探究城际出行视角下城市的等级结构,以全年时段为例,计算网络的转变中心性(AC)及转变控制力(AP),结果如图5所示。中国地级及以上城市的AC和AP均呈金字塔型层级结构,第一至第四层级的城市数量分别为6/9/108/223、6/17/77/246。相较而言,多数城市的AC和AP处于同一层级,但也存在AC值层级高、AP值层级低的城市以及AC层级低、AP层级高的城市,如洛阳、唐山、渭南、天津等。总体而言,AC层级高的城市数量多于AP层级高的城市,且城市的AC与AP基本呈正相关关系,即对资源的集聚和扩散能力强的城市对资源的支配能力也越强。
图5
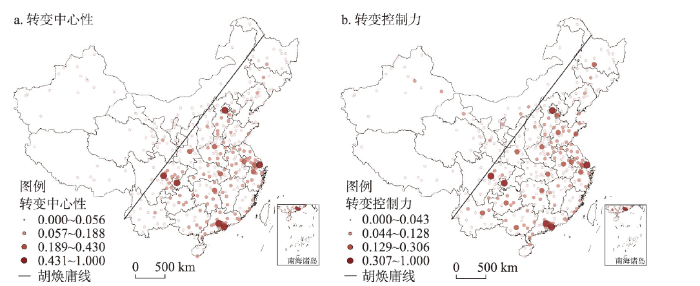
图5
2018年中国城市的转变中心性、控制力
注:基于自然资源部标准地图服务网站GS(2020)4630号的标准地图制作,底图边界无修改。
Fig. 5
Alternative centrality and power of Chinese cities in 2018
基于AC、AP在不同等级的匹配关系将中国城市划分为高中心性—高控制力的典型城市(Quintessential Cities)、高中心性—低控制力的枢纽城市(Hub Cities)、低中心性—高控制力的门户城市(Gateway Cities)及低中心性—低控制力的边缘城市(Edge Cities)4种类型(表3),以识别城市在居民城际出行网络中的地位与属性特征。从居民城际出行网络的城市等级结构(图6)可知,国家级、区域级、地方级和地方性4个等级的城市数量分别为6个、17个、119个、204个,地方级枢纽及以上城市基本分布在“胡焕庸线”以东。以重庆、上海、北京、深圳、广州和成都为代表的国家级典型城市,承担着对外交流与合作、对内推动与引领的功能;区域级典型城市共9个,为东莞、佛山、杭州、南京、苏州、武汉、长沙、郑州和西安,是区域内对信息、资源等具有极强集散与支配能力的一类城市;地方级典型城市数量较多,有56个,其中,兰州是“胡焕庸线”以西唯一的地方级典型城市,反映了其在城际出行网络中的特殊地位。区域级枢纽城市0个,地方级枢纽城市共44个。区域级门户城市共8个,包括天津、济南、青岛、哈尔滨、合肥、贵阳、昆明及南宁;地方级门户城市共19个,主要包括华东、西南地区的部分城市及西北的部分省会城市。地方性边缘城市基数最大,在全国范围内呈较为均匀的分布,但由于“胡焕庸线”以东城市结构类型的多样性,东部地区的边缘城市将具有更多的关联与中转机会。此外,门户城市对邻近城市的高控制力,可能对区域内的城际出行形成一定约束,表现为对区域资源流的垄断性,即门户城市对多数小规模城市形成的路径依赖或区域锁定效应。枢纽城市作为促进或创建城际联系的关键,其数量较少,应注意提升,以增加城际要素的流动机会。
表3 城市等级结构划分标准及结果
Tab. 3
| 城市等级 | 城市类别 | 转变中心性值域 | 转变控制力值域 | 城市数量(个) |
|---|---|---|---|---|
| 国家级 | 典型城市 | 0.431~1.000 | 0.307~1.000 | 6 |
| 区域级 | 典型城市 | 0.189~0.430 | 0.129~0.306 | 9 |
| 枢纽城市 | 0.189~0.430 | 0.044~0.128 | 0 | |
| 门户城市 | 0.057~0.188 | 0.129~0.306 | 8 | |
| 地方级 | 典型城市 | 0.057~0.188 | 0.044~0.128 | 56 |
| 枢纽城市 | 0.057~0.188 | 0.000~0.043 | 44 | |
| 门户城市 | 0.000~0.056 | 0.044~0.128 | 19 | |
| 地方性 | 边缘城市 | 0.000~0.056 | 0.000~0.043 | 204 |
图6
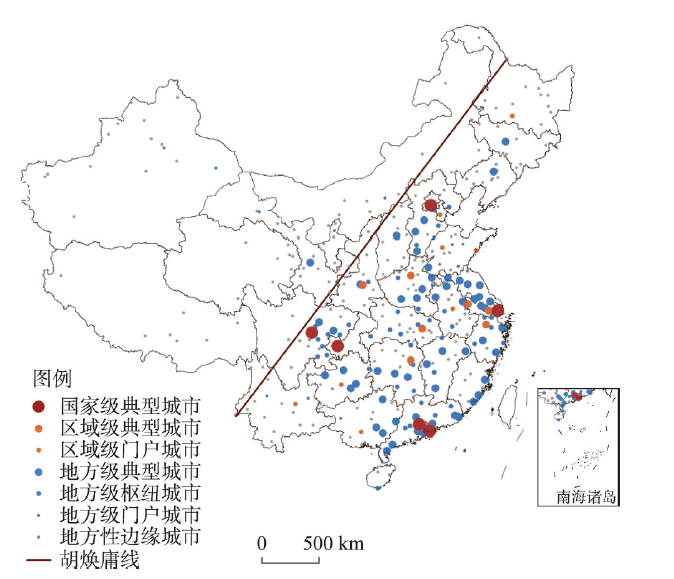
图6
2018年基于居民城际出行网络的中国城市等级结构
注:基于自然资源部标准地图服务网站GS(2020)4630号标准地图制作,底图边界无修改。
Fig. 6
Hierarchical structure of Chinese cities based on intercity travel network in 2018
(3)层级性。为深入挖掘中国居民城际出行的规律,对不同交通方式网络的首位联系流进行了提取,从其空间格局(图7)可以看出,航空、铁路和公路网络的首位流清晰刻画了“国家—区域—地方”的交通关联。航空在全国范围内撑起城际出行网络的骨架,铁路沿途串起区域间城市,而公路进一步向区域边缘延伸。航空首位流(图7a)多依赖中东部地区的典型城市向东北、西南和西北扩展。东北地区以长春、沈阳为首,分别与上海、武汉形成对称的人口集散格局;西南地区主要由重庆承接北京、上海的虹吸与辐射效应,成都则更多承担上海、广州的虹吸效应以及对西南区域的拉萨、三亚等形成辐射格局;西北地区由于其低人口密度和远离国家中心城市等原因,其首位流仅呈现北京对兰州、西宁,乌鲁木齐对喀什的较弱居民出行。铁路首位流(图7b)清晰勾勒出国家大动脉铁路沿线核心城市间的人口流动关联,基本呈以交通枢纽城市为核心的区域间对称出行流。以京沪、京九、京广和沪渝蓉线为首,途径的郑州、武汉、长沙等交通枢纽城市在“钻石形”内部相互交织,加强了区域的互动与交流;其次是京哈、兰新、成昆线等,沿线的省会城市不仅是区域、地方的门户和典型城市,而且是区域内“点—轴”系统的核心;山西、陕西、贵州等省份的首位流主要围绕省会,与省域内其他城市发育形成“点—轴”式集散格局。公路首位流(图7c)受空间摩擦和地区分割的影响,仅在局部省域内形成近距离“点—轴”式对称流动格局。其中,成都的首位联系城市数量最多,为16个,其次为长沙、武汉、郑州、西安和长春,均为区域典型城市。关联城市数在4~8个的主要为省会及以上城市,在首位流网络中主要发挥人口集聚作用。
图7
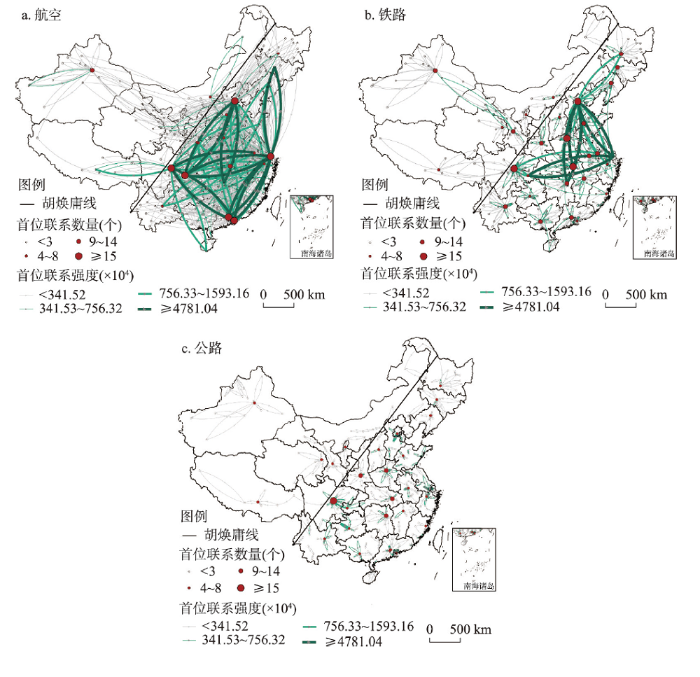
图7
2018年不同交通方式下的首位联系格局
注:基于自然资源部标准地图服务网站GS(2020)4630号的标准地图制作,底图边界无修改。
Fig. 7
Dominant connection pattern under different traffic modes in 2018
3.2.2 优势关联特征
对比每条线路在全年、日常、特殊节假日和“春运”时段的城际关联优势度,选取最大值所在的时间段,得到4个时段的城际优势关联(图8),以分析不同时段城际出行的空间邻近效应。不同时段城际优势关联的空间分布各异,特殊节假日网络的空间邻近效应最为显著。其中,日常时段的优势关联线路共4885条,第一层级为由京、沪、穗—深、蓉—渝为顶点形成的“钻石形”对称优势关联结构;第二等级主要分布于“钻石形”结构内部,南部由成都向三亚延伸,北部由上海向沈阳、长春延伸;第三等级联系多分布于沿海地区,进一步向东北和西部地区扩展。特殊节假日时段共有4330条优势关联线路,近距离往返是该时段异于其他时段的最大特点。可能受假期时长、出行目的等因素的影响,各层级基本呈围绕省会城市,向省域二、三级城市往返的优势关联,空间邻近效应显著。“春运”时段共有7491条优势关联线路,高于其余时段的7119条,在空间上呈“胡焕庸线”以东的高密度不对称优势关联及由甘肃向新疆延伸的较高密度优势关联。其余时段第一层级基本呈以武汉为中心,以陕—鄂为轴的对称分布,其他层级基本呈以国家中心城市为核心的大区域范围的非对称城际关联。
图8
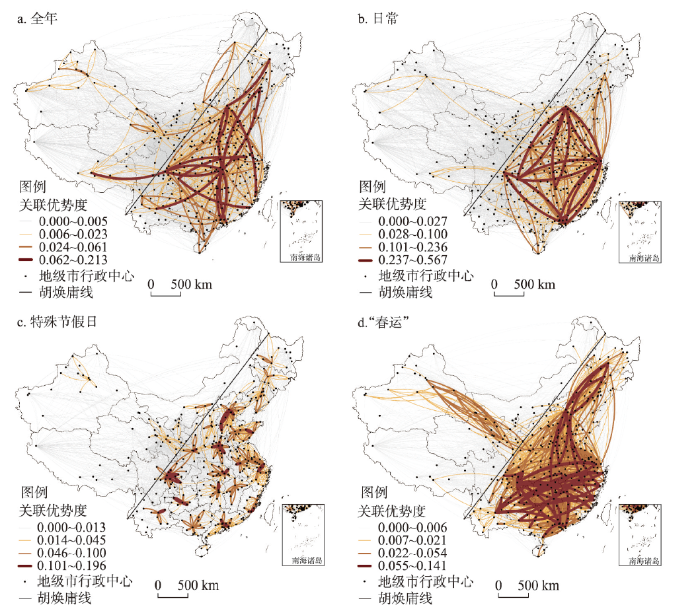
图8
2018年不同时段中国居民城际出行规模的优势关联
注:基于自然资源部标准地图服务网站GS(2020)4630号的标准地图制作,底图边界无修改。
Fig. 8
Dominant links of residents' intercity travel scale in different time periods in 2018
3.2.3 集聚效应
为反映航空、铁路和公路网络的空间集聚效应,本文采用模块度(Modularity)对城市簇结构进行划分,城市聚簇及其收缩子网如图9所示。根据城市簇所包含的城市数量和空间分布情况将其划分为跨区级簇(由空间上不相连接的省区构成)、邻区级簇(由2个及以上空间相连接的省区构成)和独立省级簇(由1个独立省份构成)[7]。航空、铁路和公路居民城际出行网络存在极强的区域集聚效应,其城市簇结构在数量及其空间分布上差异显著,基于城市簇结构收缩的城市子网均为强连通图。航空网络的城市簇数量为7个,均为跨区级簇,在空间上呈分散跳跃式分布特征。其中,深圳、上海和北京所属的簇1、簇4和簇3,其城市数量分别为117个、80个和71个,是辐射范围最广、空间跨度最大的城市簇;铁路网络的城市簇数量为10个,包括6个跨区级簇、3个邻区级簇和1个独立省级簇,呈以区域中心城市为引领的较集聚跳跃式空间分布,其中,北京、西安和广州所属的簇1、簇2和簇4的城市数分别为63个、54个、40个,是辐射华北—东北、华南和西北地区的3个最大城市簇;公路网络的城市簇数量为12个,包括7个邻区级簇和5个独立省级簇,呈集聚连片式空间分布特征。其中,以北京、上海、广州、成都、西安、昆明、厦门为龙头的7个邻区级簇(簇1~5,8,10)能够以区域核心城市为依托,在局部地区形成明显的集聚效应。
图9
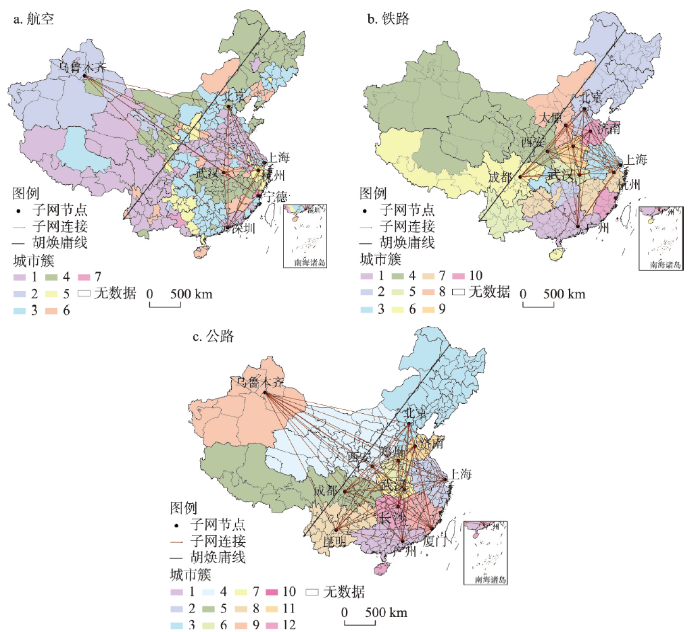
图9
2018年不同交通方式网络的中国城市簇结构及其收缩子网
注:基于自然资源部标准地图服务网站GS(2020)4630号的标准地图制作,底图边界无修改。
Fig. 9
Urban cluster structure and its shrinking subnet under different traffic modes in 2018
3.3 城市群居民城际出行网络特征
3.3.1 对内、对外出行特征
基于起、讫点均(或)在城市群内部的居民城际出行OD矩阵构建城市群对内(外)联系网络,12个主要城市群对内(外)居民城际出行网络的总体属性如表4所示。长江中游、中原和长三角是城市节点数排名前3的城市群,其居民城际出行线路也相对较多,分别含409条、384条、398条线路,但从网络密度来看,京津冀城市群高于珠三角城市群和山东半岛城市群,远高于中原和长江中游城市群。长江中游城市群域内的城际联系较为疏松,年出行规模仅高于兰西城市群。长三角城市群的年出行规模排名居首位,其次为珠三角和京津冀城市群,中原、成渝和山东半岛城市群也具有较高的出行规模。山东半岛、长三角、中原、北部湾等少数城市群的特征路径长度低于1,其他8个城市群的居民城际出行可能存在中转线路。京津冀、珠三角、山东半岛和成渝城市群的平均集聚系数均高于0.9,说明其域内城际出行网络更为紧凑,具有抱团特性。北部湾、长江中游、中原和海峡西岸4个城市群域内城际出行网络的集聚程度相对较低。
表4 不同城市群对内(外)居民城际出行网络的总体属性
Tab. 4
| 序号 | 城市群 | 节点(个) | 线路(条) | 网络密度 | 特征路径长度 | 平均集聚系数 |
|---|---|---|---|---|---|---|
| 1 | 京津冀 | 13(307) | 153(2016) | 0.981(0.021) | 1.019(2.271) | 0.981(0.003) |
| 2 | 长三角 | 26(337) | 398(4053) | 0.612(0.036) | 0.388(2.060) | 0.802(0.717) |
| 3 | 珠三角 | 9(265) | 68(2070) | 0.944(0.030) | 1.056(2.043) | 0.952(0.002) |
| 4 | 长江中游 | 31(312) | 409(3660) | 0.440(0.038) | 1.578(2.443) | 0.647(0.111) |
| 5 | 中原 | 30(310) | 384(2811) | 0.441(0.029) | 0.585(2.621) | 0.657(0.008) |
| 6 | 成渝 | 16(305) | 207(2078) | 0.863(0.022) | 1.137(2.140) | 0.900(0.001) |
| 7 | 山东半岛 | 17(232) | 255(1456) | 0.938(0.027) | 0.162(2.760) | 0.951(0.001) |
| 8 | 北部湾 | 11(212) | 74(992) | 0.673(0.022) | 0.834(2.591) | 0.305(0.001) |
| 9 | 海峡西岸 | 20(271) | 186(2358) | 0.489(0.032) | 1.545(2.272) | 0.657(0.519) |
| 10 | 哈长 | 11(175) | 82(1048) | 0.745(0.034) | 1.255(2.498) | 0.802(0.001) |
| 11 | 兰西 | 9(243) | 56(1238) | 0.778(0.021) | 1.222(2.468) | 0.838(0.001) |
| 12 | 关中 | 11(273) | 64(1542) | 0.582(0.021) | 1.418(2.403) | 0.790(0.001) |
注:括号中值为城市群对外居民城际出行网络对应的属性值。
从不同城市群对外居民城际出行网络属性可知:长三角、长江中游、中原及海峡西岸等城市群具有较多对外联系。长三角城市群年出行规模稳居首位,珠三角、成渝、京津冀和长江中游等城市群居于第二等级,最低的依然是兰西城市群。城市群对外居民城际出行网络密度介于0.021~0.038,整体差别不大,12个城市群的对外连接均较稀疏,最高的是长江中游城市群,最低的是京津冀、兰西和关中城市群。珠三角、长三角、成渝及京津冀城市群的对外城际联系路径较短,说明其对外出行更为便捷。此外,仅长三角和海峡西岸城市群显现出较明显的集聚特征。
总体而言,长三角、珠三角、京津冀及成渝城市群具有较强的人口集散能力,其对内、对外城际出行均较强;中原、山东半岛及北部湾城市群域内联系紧密而对外联系较为松散;长江中游和海峡西岸城市群域内联系较松散,但对外联系较强;哈长、兰西及关中城市群对内、对外联系均较弱。
12个主要城市群对内、对外日均居民城际出行网络的空间格局如图10所示。各城市群对内、对外网络分别呈“核心—邻近—边缘”“跨区—邻域—地方”的空间格局,城际出行强度从高到低依次为国家级、区域级、地方级城市群。域内网络中(图10a),第一层级共8条线路,仅出现在珠三角(广州↔佛山、深圳↔东莞)、长三角(上海↔苏州)、京津冀(北京→廊坊)和关中(西安→咸阳)城市群,呈核心发达城市到邻近城市的强城际出行特点;第二层级共23条线路,主要分布在京津冀、珠三角、成渝、长三角及关中城市群内,是域内核心城市与次级核心城市间的较强城际出行;第三层级共93条线路,分布在除兰西城市群的其他城市群内。其中,京津冀、长三角、珠三角、长江中游等城市群呈多核心辐射格局,成渝、中原、海峡西岸及关中等城市群呈“核心—边缘”辐射格局;第四层级线路较多,呈“钻石型”及其结构内部城市群内联系密集而其他城市群内联系稀疏的较弱关联特征;第五层级线路多为城市群内边缘城市间的联系。
图10
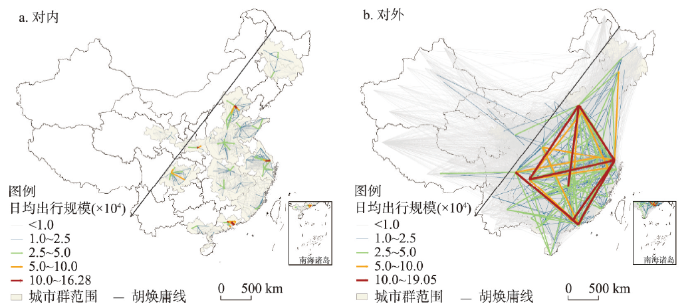
图10
不同城市群对内(外)日均居民城际出行网络的空间格局
注:基于自然资源部标准地图服务网站GS(2020)4630号的标准地图制作,底图边界无修改。
Fig. 10
Spatial pattern of internal (external) residents' intercity travel network of different urban agglomerations
对外网络中(图10b),第一层级线路共14条,为长三角、京津冀、珠三角和成渝城市群核心城市间的跨区域强城际出行,形成“菱形”空间结构,内部由上海↔重庆、长沙→北京形成“十”字架构;第二层级共22条线路,除上海→长春的较强城际出行外,其余线路基本分布在“菱形”内部,关中与长三角、珠三角通过核心城市建立较强关联;第三层级共134条线路,体现为城市群核心城市间以及核心城市与周边省会城市间的城际出行;第四层级共463条线路,在“胡焕庸线”以东形成密集连接,以西仅呈成渝、关中、兰西等城市群核心城市对周边省会及次一级城市的人口集散;第五层级线路基本为城市群城市与国内经济较为落后以及交通不便城市间的城际出行。
3.3.2 出行模式
通过居民城际出行强度对城市群对内、对外网络的多中心度和首位度进行量化。多中心度,即网络中排名第二至第六位城市的总加权度均值占首位城市加权度的比重,值越高,网络的多中心特征越明显[33]。首位度,常用网络中首位城市与次位城市总关联度的比值来表示,值越高,表明首位城市在网络中的地位越明显[20]。然而,在城际出行网络中,城市关联度不足以区分首位城市的地位,因此,本文的首位度用城际出行的总强度来代替。城市群对内、对外居民城际出行网络的多中心度和首位度如图11所示,城市群对内、对外网络的多中心度均值分别为0.41、0.29,首位度均值分别为1.90、3.06,基本呈对外网络多中心度更低而首位度更高的特点。
具体地,城市群域内网络中,多中心度高于均值而首位度低于均值的城市群包括珠三角、海峡西岸、长三角、兰西及哈长城市群,由于域内城市跨省界组合及各省会城市集散能力相当等原因,使得居民出行较难跨越省界阻隔,因此在域内形成围绕各自省会城市的较均衡的人口流动格局。京津冀、中原、成渝及北部湾城市群的多中心度较高而首位度均高于均值,其域内城际出行呈多中心,但仍表现出以核心城市为引领的人口集散格局。城市群对外网络中,海峡西岸、长江中游和珠三角城市群的多中心度高于均值而首位度低于均值,说明其对外城际出行呈以多核心的对外关联格局,无明显首位人口集散城市。京津冀、长三角、山东半岛、哈长、兰西和关中城市群的多中心度较域内低而首位度较域内高,说明其对外城际出行的多中心效应并不明显,区域核心城市承担着城市群对外的主要人口集散。
图11
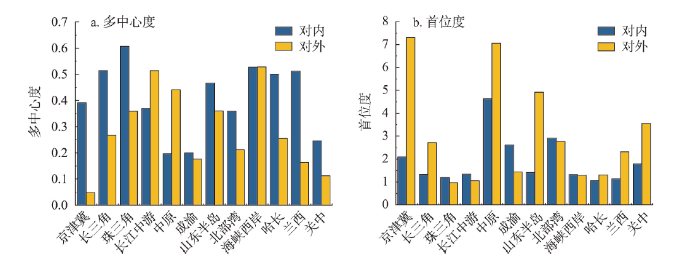
图11
不同城市群对内(外)居民城际出行网络的多中心度和首位度
Fig. 11
Polycentricity and primacy of internal (external) residents' intercity travel network of different urban agglomerations
通过多中心性与首位度对城市群对内、对外出行模式进行划分。将多中心度≥ 0.50的城市群视为多中心城市群,多中心度< 0.50的为单中心城市群;以首位度≤ 1.50的为双核城市群,首位度>1.5的为单核城市群。城市群域内居民城际出行被划分为单中心双核、单中心单核和多中心双核3种模式。单中心双核城市群包括京津冀和长江中游城市群,域内居民城际出行分别以北京、武汉为中心;单中心单核城市群包括中原、成渝、北部湾及关中城市群,分别以郑州、成都、南宁、西安为其人口集散中心,在域内形成“一家独大”的城际出行模式;多中心双核城市群数量最多,包括长三角、珠三角、山东半岛、海峡西岸、哈长和兰西城市群。
城市群对外居民城际出行亦被划分为单中心双核、单中心单核和多中心双核3种模式。单中心双核城市群包括珠三角、成渝和哈长。单中心单核城市群数量最多,除中原、北部湾及关中城市群对外网络的居民出行模式与域内网络的相同外,京津冀、长三角、山东半岛和兰西城市群分别由于其中心城市的跨区域强人口集散功能,使之呈单核心出行模式。多中心双核城市群包括长江中游和海峡西岸。
4 结论与讨论
4.1 结论
基于腾讯迁徙数据,对2018年中国居民城际出行网络空间结构特征及主要城市群对内、对外出行模式进行了深入分析与挖掘,主要结论如下:
(1)通过对比分析3种交通方式下居民城际出行的网络结构特征,改进了已有研究依靠单一类型出行方式导致的结果片面化和属性化缺陷。不同类型出行方式揭示的城市网络特征存在较明显的差异,航空、铁路、公路城际出行分别形成国家级、区域级及地方级顶层网络空间结构。不同的居民城际出行方式对时空距离的响应不同,由此导致的出行人口数量、出行范围和出行交通网络也表现出显著的差异。
(2)通过对比分析全年、日常、特殊节假日和“春运”的居民城际出行网络结构异同,从宏观尺度上揭示了不同时间段人口流动规律,并间接挖掘了节假日与日常不同出行特征所形成的城市网络特征。研究发现居民城际出行的强度重心分布在湖北省随州市境内,但“春运”的重心更偏向于西南,其居民城际日均出行规模高于其他时段。特殊节假日居民城际出行的空间邻近效应最为显著。
(3)通过对城市群居民城际出行的分析发现,城市群对内、对外居民城际出行呈现“核心—邻近—边缘”和“跨区—邻域—地方”网络空间格局,层级性明显。主要城市群内城际出行多以省会城市为起(讫)点,呈多中心双核出行模式,对外城际出行则多呈单中心单核出行模式。
4.2 讨论
从多时段、多交通方式及不同空间尺度视角对中国居民城际出行网络空间结构进行研究,摒弃以往多从单一视角或单一流要素入手的缺陷,可综合、全面地揭示区域居民城际出行网络的空间格局及特征,为掌握区域居民城际出行规律及实现区域协同发展提供可靠支撑。通过比较全年、日常、特殊节假日和“春运”时段的居民城际出行网络发现,城际出行具有明显的时间差异特性。不同时间、特定时期居民城际出行的差异不仅体现在人口出行规模方面,还包括出行距离、出行模式等。“春运”及其他节假日时段的城际出行在短时间内会出现激增现象,但受假期时长影响,特殊节假日的城际出行更具空间邻近性。虽然与李涛等[3]对中国2016年工作日与节假日居民出行网络的对比发现基本一致,但由于“春运”假期的特殊性,其空间邻近效应并不明显。此外,城际关联优势流揭示出特殊节假日时段的优势出行线路基本集中在省域范围内,呈往返对称之势,进一步说明节假日居民城际出行多体现为目标单一的近域流动,回流效应明显。
本文基于同源流数据构建的不同交通方式居民城际出行网络更具系统性、可比性。航空、铁路、公路居民城际出行网络揭示出航空交通最具跨区域交织能力,在最大程度克服空间摩擦的同时,主要承担国家尺度居民城际出行的集散。铁路网络依赖京九、兰新、京沪、京广、陇海、京哈、京包、襄渝等国家铁路大动脉服务于区域城市间,最具灵活性,主要发挥区域尺度中、短途城际出行的集散。公路网络的局部地方效应最为显著,呈由区域中心城市向外辐散的格局,主要承担地方尺度城际出行的集散。区别于利用航线[34]、铁路客运班列[35]、汽车班次[10]等数据构建的城市网络,由于其较难反映城际真实的客运流,相应地,网络结构的测度结果也存在一定差异。例如,由于航线、班次等对交通基础设施的高度依赖,使得区域城市网络的集簇特征与交通线路分布格局基本一致。
12个城市群对内、对外居民城际出行网络的空间结构特征在区域层面上进一步展现了居民城际出行的地理邻近性及省域边界的分割效应。如长江中游城市群,武汉、长沙和南昌虽为其域内核心城市,受行政边界的阻隔,域内城际出行基本围绕省会城市呈集散之势,核心城市间的互动并不强烈,对外城际出行亦呈多中心集散格局。此外,城市群城际出行网络的多中心度与首位度随着网络空间范围的增大而呈前者更低、后者更高的特点,说明在不同的空间尺度上,城市群核心城市所发挥的人口集散功能存在差异。
采用时空大数据分析居民出行空间特征时,数据的无量纲测度和相对指标要优于绝对数值所反映的特征[3,25]。本文所采用数据也是无量纲测度的人口出行规模,虽并非人口出行量的绝对数值以及出行方式的确切对应,但亦可从规模、结构、出行方式等方面反映城际出行网络的空间格局与特征。由于老人、儿童等特殊群体未使用关联APP的城际出行可能未被详细地记录,加之数据只记录了城市间的人口流动,又由于客户端的使用、中转等原因用户的行程可能被拆解,且一年的数据可能存在特殊性,上述数据缺陷会使得研究的结果不可避免地存在偏差,尤其体现在不同交通方式居民城际出行网络中,如在1400~1600 km距离范围内,选用铁路出行的人数略高于选用航空出行的人数。然而,在无法获得交通部门具体的客运量数据的情况下,基于腾讯迁徙数据从宏观层面(全国、区域)揭示的居民城际出行网络空间结构特征具有一定可靠性[36]。本文从时段、交通方式及城市群(对内、对外)视角重点揭示了居民城际出行网络的空间结构特征,但对居民城际出行的过程、动力及影响因素等关注不足,对于各种交通方式组合出行后将出现何种综合影响,继而如何影响居民城际出行网络结构,还需深入分析。今后的研究可在获取更多年份数据的基础上,结合问卷调查、统计数据、大数据智能感知等手段,细致探究居民城际出行的时空特征及形成机制。
参考文献
Migration and development: A theoretical perspective
The debate on migration and development has swung back and forth like a pendulum, from developmentalist optimism in the 1950s and 1960s, to neo-Marxist pessimism over the 1970s and 1980s, towards more optimistic views in the 1990s and 2000s. This paper argues how such discursive shifts in the migration and development debate should be primarily seen as part of more general paradigm shifts in social and development theory. However, the classical opposition between pessimistic and optimistic views is challenged by empirical evidence pointing to the heterogeneity of migration impacts. By integrating and amending insights from the new economics of labor migration, livelihood perspectives in development studies and transnational perspectives in migration studies - which share several though as yet unobserved conceptual parallels - this paper elaborates the contours of a conceptual framework that simultaneously integrates agency and structure perspectives and is therefore able to account for the heterogeneous nature of migration-development interactions. The resulting perspective reveals the naivety of recent views celebrating migration as self-help development "from below". These views are largely ideologically driven and shift the attention away from structural constraints and the vital role of states in shaping favorable conditions for positive development impacts of migration to occur.
Characteristics of intercity trip network structure of residents under different traffic modes: A case study of Spring Festival travel rush
DOI:10.18306/dlkxjz.2021.05.004
[本文引用: 2]

Spatial structure measurement of residents' intercity trip network based on multiple perspectives can be used to comprehensively describe the complex connection between cities. Based on the data of population flow from Tencent migration platform in 2018 during the Spring Festival in China and using the complex network analysis method and taking alter-based centrality and alter-based power as indicators, the structural characteristics of Chinese intercity trip network under the three traffic modes of aviation, railway, and highway were compared and analyzed. The results show that: 1) The number of routes connected by aviation is the smallest among the three modes of travel, and the average trip distance is the longest; the number of passengers by railway is the largest, followed by highway and aviation. 2) With regard to the maximum dominant flow, Beijing and Shanghai play the most important controlling role in the domestic aviation trip connection, followed by Chengdu and Chongqing. With regard to the railway trips, Beijing and Chengdu occupy absolute advantageous positions, and the highways mostly connect provincial administrative centers and the surrounding cities. 3) There are four types of cities based on the alter-based centrality and alter-based power: high alter-based centrality-high alter-based power cities, high alter-based centrality-low alter-based power cities, low alter-based centrality-high alter-based power cities, and low alter-based centrality-low alter-based power cities. The number of high alter-based centrality-high alter-based power cities is the largest in the aviation and railway travel network. The number of high alter-based centrality-low alter-based power cities is dominant in the highway travel network. 4) There are differences in the number of urban community detection clustering structures under different travel modes. Aviation, railway, and highway were clustered into 7, 8 and 10 urban communities respectively. Under the aviation travel mode, discontinuity between "communities" is clear. Under the mode of railway travel, agglomeration appears, and an obvious block distribution appears under the mode of highway travel. From the perspective of travel modes, the characteristics of urban network are also significantly different. The intercity flow of aviation travel showed a core-periphery structure with national hub cities as the core; train travel showed a core-periphery structure with the cities along the national railway artery as the core, and gradually decreasing to the hinterland cities; and the intercity flow of highway travel indicates the spatial pattern of local strong aggregation matching the population scale. The study of spatial structure of residents' intercity trip network under different travel modes can reveal the multiple spatial characteristics of population migration, residents' trip, and urban network from different perspectives, complement the results of existing studies based on single travel modes, and enrich the regional understanding of spatial relationships of Chinese cities.
不同交通方式下居民城际出行网络结构特征: 以“春运”为例
DOI:10.18306/dlkxjz.2021.05.004
[本文引用: 2]
基于多元视角下的居民城际出行网络空间结构测度可以较为全面地刻画出城市间的复杂联系特征。论文利用春运期间腾讯迁徙平台中的人口流动数据,采用复杂网络分析方法以及转变中心性和转变控制力等指标,对比分析了航空、铁路和公路3种交通方式下的中国居民城际出行网络结构特征。结果表明:3种出行方式下,航空联系的线路最少,平均出行距离最长;铁路出行人数最多,其次是公路,航空最少。最大优势流中,北京和上海在国内航空出行联系中起着最重要的控制作用,其次是成都和重庆;铁路出行中,北京和成都占据绝对优势;公路多表现为省级行政中心与周边城市的关联。根据转变中心性和转变控制力划分城市类型,在航空和铁路出行网络中,高中心性—高控制力城市较多;公路出行网络中以高中心性—低控制力城市为主。不同出行方式下的城市聚类得到的网络集群“社区”数量有一定差异,航空、铁路和公路出行依次聚类为7、8和10个“社区”。不同类型出行方式透视的城市网络特征存在较明显的差异:航空出行的城际人口流体现出以全国性枢纽城市为核心分布的核心—边缘结构;铁路表现出以国家铁路大动脉沿线城市为核心,向腹地城市逐渐递减的核心—边缘结构;公路出行的城际人口流则表现为与人口规模匹配的局域强聚集的空间格局。
Comparison of inter-city travel network during weekdays and holiday in China
DOI:10.11821/dlxb202004012
[本文引用: 4]
The differences of residents' travel purpose, travel time and regional attribute will lead to the heterogeneity of travel behavior. Working days and holidays have completely different time attributes, and the travel purpose is quite different. Therefore, comparing them has become an important way to reveal the inter-city travel network from different perspectives. Using migration data inferred from passenger travels during working days in April (11-15 April, 2016) and National Day golden week (1-7 October, 2016) from Tencent Location Big Data, this paper made a comparison of the spatial structure of inter-city travel network during weekdays and holiday in China. The results are as follows: (1) The average daily inter-city residents' travel scale during the golden week was significantly higher than that during the weekdays, but the travel distance and network clustering degree were significantly lower than the latter. (2) The two networks form three types of cross-regional group, adjacent group and provincial group. During the golden week, the number of cross-regional groups is significantly lower compared with weekdays, the number of regional and local hub cities is more than that of weekdays, and the number of adjacent groups and provincial groups is significantly higher than that of weekdays. (3) On weekdays, the three major cities of Beijing, Shanghai and Guangzhou have a prominent core position, and the function of tourism and transportation hub is highlighted in the golden week. (4) Weekday intercity network to cross-regional links, and the golden week is showing a clear spatial proximity effect, and formed a provincial capital as the center, the provincial travel core-peripheral mode. The structure and difference of inter-city travel network in the two periods are influenced by many factors, including geographical proximity, administrative division (proximity of cultural system), travel distance and travel purpose.
中国居民工作日与节假日的城际出行网络异同性研究
DOI:10.11821/dlxb202004012
[本文引用: 4]
居民出行目的、出行时间与地域属性的差异都会导致出行行为的异质性,工作日与节假日具有完全不同的时间属性,且出行目的差异较大,对两时段城际出行网络进行比较有助于全面认识城际出行规律及其网络特征。以4月份工作日(2016年4月11日—4月15日)和国庆黄金周(2016年10月1日—10月7日)为代表,利用“腾讯迁徙”提供的居民城际出行数据,从城市节点、城际关联及网络集聚角度对工作日与节假日的居民城际出行网络结构特征进行对比研究。结果发现:① 黄金周的日均城际居民出行规模显著高于工作日,但出行距离和网络集聚程度明显低于后者;② 两种网络均形成了跨区域组团、邻近组团和省域组团3种类型。黄金周跨区域组团数量明显低于工作日,区域和地方枢纽城市数量多于工作日,邻近组团和省域组团数量则明显高于工作日;③ 工作日,北上广三大城市核心地位突出,旅游功能、交通枢纽功能城市的地位在黄金周更得以凸显;④ 工作日城际出行网络以跨区域联系为主,而黄金周则呈现出明显的空间邻近效应,并形成了以省会为中心、省内出行为主的核心—外围模式。
The Informational City:Information Technology
Time evolution of complex networks: Commuting systems in insular Italy
DOI:10.1007/s10109-010-0130-8 URL [本文引用: 2]
The devil is in the details: Differences in air traffic networks by scale, species, and season
DOI:10.1016/j.socnet.2014.03.003 URL [本文引用: 1]
Spatial pattern of population mobility among cities in China: Case study of the National Day plus Mid-Autumn Festival based on Tencent migration data
DOI:10.1016/j.cities.2019.05.022 URL [本文引用: 3]
Measurement of directed alternative centricity and power of directed weighted urban network: A case of population flow network of China during "Chunyun" period
DOI:10.11821/dlyj201704004
[本文引用: 2]
With the rapid development of ICTs and big data technology, various "flow" data have become easier to be obtained such as population flows, information flows and capital flows. These data are key material to build the production network, social network, urban network and other types of network, which are becoming very important research subjects of geographical sciences and enrich the research content of this field. So far, researches on the networks in geography are still in their infancy stage. There are a number of methods that have not been utilized effectively, while it is difficult to find a proper abstracted network model to simulate the geographical phenomenon in many occasions. Therefore, to seek more appropriate methods and models for geographical network studies undoubtedly become urgent tasks in this field. In this context, an exploratory research was carried out. First, population flow network of China in the period of "Chunyun", a typical directed-weighted urban network, was built based on the population flow data acquired from “Big data on human migration during the "Chunyun" period from Baidu Map ("Baidu migration data" in short). Sequentially directed alternative centrality and directed alternative power were proposed in predecessor's foundation to evaluate the importance of each node and divide these nodes into different types according to their roles in the urban network. As analysis result, two dimensional spatial characteristic and geographical spatial characteristic was revealed which endowed the methods more practical significances. To validate the effectiveness of the methods, a contrastive analysis of the directed alternative centrality/directed alternative power and centrality/directed alternative power in previous studies was conducted. Based on directed weighted urban network and with the help of this method, this paper classified the cities into quintessential cities, hub cities, gateway cities and periphery cites, and identified the characteristics of agglomeration and diffusion at the mean time. And the result of classification was explained according to the internal structure and external context of the population flow network during the "Chunyun" period. It is found that the regional difference of directed alternative centrality and directed alternative power have certain relationship to economic and social development, national development strategy and administrative division. This explorative process demonstrated that one can effectively extract the information on the hierarchical structure, function divergence and imbalance of the directed weighted urban network via the directed alternative centrality-directed alternative power method. Directed alternative centrality-directed alternative power method is really a feasible approach to analyze the geographical network, and it also demonstrated that directed-weighted urban network can really make a difference from undirected and unweighted network in the geographical network studies.
有向加权城市网络的转变中心性与控制力测度: 以中国春运人口流动网络为例
DOI:10.11821/dlyj201704004
[本文引用: 2]
目前中国地学领域对网络的研究仍处于起步阶段,大量网络研究方法尚未得到应用的同时,许多地理现象尚未寻找到合适的抽象网络模型,不断拓展和应用有效的网络分析方法成为当务之急。在这一背景下,基于百度迁徙平台获取的春运人口流动大数据,构建中国春运人口流动的有向加权城市网络,在已有研究基础上提出有向转变中心性与控制力测度方法,对该城市网络的节点重要性和功能进行评估和分类,分析其呈现的二维空间特征与地理空间分布特征,并与已有方法进行对比。结果表明:利用有向转变中心性和控制力方法,可有效提取有向加权网络的层级结构、功能分异和非均衡性等特征,不但可区分典型城市、枢纽城市、门户城市与边缘城市等不同的城市类型,还可以识别城市的集聚与扩散特征,从而获得比无权无向网络更为丰富和具有实践意义的信息参考,是一种有效的地理网络分析方法。
Comparison of spatial structure and organization mode of inter-city networks from the perspective of railway and air passenger flow
DOI:10.11821/dlxb201708013
[本文引用: 1]
As traffic flow reflects the socio-economic relations between cities, it is widely applied as a key factor in studies on city networks. Based on the inter-city railway and air passenger flow in 2010, this article made a comparison of the spatial structure and passenger flow organization of inter-city networks from the perspective of railway and air passenger flow, in terms of node, linkage, and community. The results are as follows: (1) Both city networks based on railway and air passenger flow present a hierarchical structure with Beijing, Shanghai and Guangzhou being the top three, while the nodes in the lower classes of two networks are different. (2) The spatial structure of linkages between cities based on railway passenger flow displays strong neighborhood effect. In contrast, the cities' own characteristics play a dominant role in the organization of air passenger flow. (3) Most of the dominant railway passenger flow is directed to the capital city in each province, forming several disperse regional systems separated by the provincial boundaries. In terms of air passenger flow, the regional systems are integrated by vertical linkages between them. (4) Although the community structure is not obvious from the perspective of air passenger flow, there are seven communities of significant geographical characteristics being detected in the railway network. The main differences between two networks are attributed to the management systems and technical characteristics of the modes of transportation.
中国城市网络等级结构特征及组织模式: 基于铁路和航空流的比较
DOI:10.11821/dlxb201708013
[本文引用: 1]
交通流是反映城市间社会经济联系的重要表征,被广泛应用于城市网络研究中。基于2010年中国城际铁路与航空客流OD数据,本文从城市节点、流量、子网络视角对中国城市网络的结构特征与组织模式进行了比较研究,发现:① 铁路与航空流视角下的中国城市网络均呈现出以北上广为顶层节点的空间等级结构体系,但除顶层结构外两种网络结构差异较大。② 城市网络体系中的铁路流联系表现出空间邻近性特征,而航空流联系则主要受到城市节点的规模大小与职能属性的影响。③ 铁路流的首位联系受省级行政区划的制约,航空流的首位联系空间跨度大,形成了若干具有垂直层间联系的地域子系统。④ 铁路网络拥有具有显著地域特征的7个子网络,而航空网络中则不存在明显的子网络。技术经济特征与管理体制是造成铁路与航空两种网络特征差异的主要原因。
Understanding spatial structures and organizational patterns of city networks in China: A highway passenger flow perspective
DOI:10.1007/s11442-018-1485-x
[本文引用: 2]
The use of multi-perspective and multi-scalar city networks has gradually developed into a range of critical approaches to understand spatial interactions and linkages. In particular, road linkages represent key characteristics of spatial dependence and distance decay, and are of great significance in depicting spatial relationships at the regional scale. Therefore, based on highway passenger flow data between prefecture-level administrative units, this paper attempted to identify the functional structures and regional impacts of city networks in China, and to further explore the spatial organization patterns of the existing functional regions, aiming to deepen our understanding of city network structures and to provide new cognitive perspectives for ongoing research. The research results lead to four key conclusions. First, city networks that are based on highway flows exhibit strong spatial dependence and hierarchical characteristics, to a large extent spatially coupled with the distributions of major megaregions in China. These phenomena are a reflection of spatial relationships at regional scales as well as core-periphery structure. Second, 19 communities that belong to an important type of spatial configuration are identified through community detection algorithm, and we suggest they are correspondingly urban economic regions within urban China. Their spatial metaphors include the administrative region economy, spatial spillover effects of megaregions, and core-periphery structure. Third, each community possesses a specific city network system and exhibits strong spatial dependence and various spatial organization patterns. Regional patterns have emerged as the result of multi-level, dynamic, and networked characteristics. Fourth, adopting a morphology-based perspective, the regional city network systems can be basically divided into monocentric, dual-nuclei, polycentric, and low-level equilibration spatial structures, while most are developing monocentrically.
Impact factors and differences in commuting efficiency between public transit and private automobile travel: A case study on the Beijing metropolitan area
DOI:10.11821/dlyj201702005
[本文引用: 1]
Two main functions of a city—housing and employment—have a substantial influence on urban development, as their spatial configurations determine residents' commuting behavior and otherwise affect lifestyles. Research on commuting efficiency therefore plays an important role in urban sustainable development and optimism of the spatial distributions of housing and employment. In this paper, based on results of a questionnaire conducted in the Beijing metropolitan area, commuting efficiency is analyzed and evaluated by way of theoretical commuting, excess commuting, and commuting capacity models. The paper analyzes the commuting efficiency differentiation of public transit and private automobiles. Results are as follows. (1) The excess commuting rate in the Beijing metropolitan area is 64.48% while the commuting capacity utilization rate is only 32.49%, which permits speculation that the current employment-housing situation is substantially imbalanced. (2) For commuting efficiency for different travel modes, private automobiles are superior to public transit, which indicates that the public transportation excess commuting rate is higher than that of private automobiles, and great capacity exists for optimizing public transportation. (3) By analyzing impact factors of the commuting efficiency differentiation of public transit and private automobiles, the factor of job accessibility is found to significantly influence commuting via public transit, while the correlation between job accessibility and private automobile travel does not prove significant. A significant correlation is found between age, education, occupation type, average monthly income, housing property, and commuting time for both travel modes, but the influences of sex and family structure are found to be not significant. Additionally, residential locations are found to impact commuting times for both travel modes more than residential density does, whereas the impact of working locations is found to be not significant. Consequently, it is concluded that the urban government should encourage use of public transit. Furthermore, potentially effective measures such as improving availability of public transportation and imposing congestion-related premiums should be adopted to narrow the difference between public transit and private automobile use.
公共交通与私家车出行的通勤效率差异及影响因素: 以北京都市区为例
DOI:10.11821/dlyj201702005
[本文引用: 1]
居住与就业是城市的基本功能活动,其空间配置决定了居民的通勤行为,从而对城市发展和居民生活产生显著影响,因此开展城市的通勤效率研究对优化居住与就业的空间分布,实现城市可持续发展等方面尤为重要。基于北京都市区居民问卷调查数据,通过理论通勤、过剩通勤、通勤容量等相关模型对居民的通勤效率进行评价;在此基础上,着重分析了公共交通出行与私家车出行之间的通勤效率差异性。研究表明:① 北京都市区居民的通勤出行中有64.48%属于过剩通勤,从通勤容量使用率来看都市区仅为32.49%,反映了目前居住与就业失衡的现实情况;② 从不同出行方式来看,公共交通过剩通勤程度更高,即私家车出行的通勤效率要高于公共交通,表明公共交通出行依然存在较大的优化提升空间;③ 从通勤效率差异的影响因素来看,就业可达性变量显著影响公共交通通勤,对私家车通勤时间的影响没有通过显著性检验;年龄、学历、平均月收入、住房产权等与二者显著相关,但性别、家庭结构的影响都不显著;居住密度及居住地空间位置对公共交通、私家车通勤时间都具有一定影响,但就业密度及就业地空间位置对不同出行方式通勤时间的影响则不显著,认为城市应当鼓励公共交通出行,通过提高公共交通的通达性、对私家车征收拥挤费用等措施来弥补公共交通与私家车出行之间的不平等性。
Household travel, household characteristics, and land use: An empirical study from the 1994 Portland activity-based travel survey
DOI:10.3141/1617-02 URL [本文引用: 1]
Travel mode detection based on GPS track data and Bayesian networks
DOI:10.1016/j.compenvurbsys.2015.05.005 URL [本文引用: 1]
Characterizing the human mobility pattern in a large street network
"Voting with their feet": Delineating the sphere of influence using social media data
Constructing and analyzing spatial-social networks from location-based social media data
DOI:10.1080/15230406.2021.1891974 URL [本文引用: 1]
Analysis of urban network structure in China based on Baidu migration data: Take the data of Spring Festival in 2015 and 2019 for example
基于百度迁徙的中国城市网络结构分析: 以2015年和2019年春运数据为例
Differentiating centrality and power in the world city network
DOI:10.1177/0042098010388954 URL [本文引用: 3]
Research on Travel pattern and network characteristics of inter-city travel in China's urban agglomeration during National Day week based on Tencent Migration data
基于腾讯迁徙数据的中国城市群国庆长假城际出行模式与网络特征
DOI:10.12082/dqxxkx.2020.190686
[本文引用: 3]
城际出行具有时间依赖性,不同时间约束与特定时期的城际出行具有相异性,反映的出行模式与表达的地理空间联系规律具有差异性。迁徙大数据记录的人口移动实时记录为开展基于时间依赖的城际出行网络提供了可能。本文以全国 19个城市群为研究区域,利用腾讯平台提供的居民城际出行数据,对国庆长假期间(2016年10月1—7日)中国城市群城际出行时段变化特征、城际出行模式及其网络结构进行了研究。结果表明:① 黄金周城际出行具有明显的基于出行期、返程期和旅途期的时段变化规律;② 国庆长假期间的中国城市群城际出行分别形成了轴辐式、多中心与单中心3种城际出行模式; ③ 出行期、返程期的城际出行具有类似于春运人口流动的时空对称规律,城市群城际出行呈现出以主要城市群整体、城市群核心城市与邻近外围城市间的中短距离流动的长假出行特征,中西部城市群城际出行具有典型的“潮汐式”流动特征;④ 基于腾讯人口迁徙大数据,通过对黄金周期间出行期、返程期与旅途期的科学划分,较好地实现了国庆长假城际出行特征与模式的挖掘,同时也为长假城际交通管理与道路资源优化调配方案的制定提供支撑。
Alter-based centrality and power of Chinese city network using inter-provincial population flow
DOI:10.11821/dlxb201706007
[本文引用: 3]
Application of the concepts of alter-based centrality and power has become a focus in the research on city networks in recent years. In this paper, the conditionality of recursive theory utilization to city networks is analyzed from the perspective of network topology structures. In addition, an urban network is constructed on the basis of Baidu migration data and measured using the complex network method, improved alter-based centrality, and the power method. The results show, in the first place, that the use of recursive theory for the analysis of urban networks has specific data structure requirements, suitable for tree structure, but not for the local existence of complete network structure measurements. Secondly, small world phenomena and spatial patterns of population mobility exhibit obvious core-periphery structures at national and regional scales. This means that the national urbanization development strategy and important transport facilities play key roles in enabling the population mobility network. In this context, the Harbin-Beijing-Xi'an-Chengdu-Dali line exhibits a significant network of spatial differences in terms of boundary divisions. Thirdly, the use of alter-based centrality and power reveal hierarchical characteristics, differences in the urban network, and the influence of different effects, including spatial ones, on the identification of network city resources. In this case, the network includes not just Beijing, Shanghai, Chongqing, and Guangzhou, high power quintessential cities with high centrality, but also a number of smaller lower power hub cities, including Wuhan, Taiyuan, Guiyang, and Fuzhou, as well as gateway cities that exhibit both low centrality and high power, such as Lanzhou and Yinchuan. Thus, the concepts of centrality and power are of great significance in broadening our understanding of complex urban diversification.
基于人口省际流动的中国城市网络转变中心性与控制力研究: 兼论递归理论用于城市网络研究的条件性
DOI:10.11821/dlxb201706007
[本文引用: 3]
转变中心性和控制力是近年来城市网络研究的重要方法。本文首先从网络拓扑结构角度讨论递归理论用于城市网络研究的条件性;其次,基于百度迁徙数据构建城市网络,利用复杂网络方法、改进后的转变中心性和控制力方法对城市网络进行测度。结论指出:① 递归理论用于城市网络分析有其特定的数据结构要求,其适用于树形结构、而不适用于局部存在完整图的网络结构的测度;② 基于人口省际流动的中国城市网络存在小世界现象,人口流动空间格局在全国和区域尺度下均呈现出明显的核心—边缘结构,国家城市化发展战略与重要交通设施对人口流动网络产生框架性的导向作用。哈尔滨—北京—西安—成都—大理一线是关联结构与强度空间差异的明显界限。③ 转变中心性与控制力更能揭示中国城市网络节点的属性特征,和辨识资源流通对网络城市产生的不同影响与空间效应。城市网络中既包括北京、上海、重庆、广州等以高中心性高控制力为特征的典型城市,也包括武汉、太原、贵阳、福州等高中心性低控制力的枢纽城市,和兰州、银川等低中心性高控制力的门户城市。因此,转变中心性和控制力概念对加深城市复杂多样化内涵的认识具有重要的意义。
Tourists' digital footprint: The spatial patterns of tourist flows in Qingdao, China
China's City network based on Tencent's migration big data
DOI:10.11821/dlxb202104006
[本文引用: 1]
With the rapid development of economic globalization and regional integration, the connection between cities is increasingly close. The mobility and interdependence of elements have promoted the formation of city network and become a new regional organization model and spatial structure. Based on Tencent's migration data, this paper constructs a 372×372 relational data matrix, and systematically depicts the city network pattern in China from different modes of transportation. The results show that cities with high network correlation degree are mainly concentrated in the area east of the Hu Huanyong Line, especially in the Yangtze River Delta, Pearl River Delta, Beijing-Tianjin-Hebei region, Chengdu-Chongqing region and other urban agglomeration areas, which have the highest concentration and become the main control power of China's city network pattern; and the cities in the northwest half are at a disadvantage status. According to the amount of migration, the Chinese city network is divided into national, large regional, regional, local and pedestal networks. The city network structure changes with the mode of transportation. When the network level moves down, the number of node cities tends to increase and the network density increases, but the network range tends to shrink. There is a close correlation between the network level and the migration path. National-level network related to air transportation, regional network related to railway transportation, and local network are relevant to automobile transportation. The economic space-time distance of different transportation modes determines the network structure, which is the basic factor that causes the network to differentiate with different paths.
基于腾讯迁徙大数据的中国城市网络研究
DOI:10.11821/dlxb202104006
[本文引用: 1]
随着经济全球化和区域一体化的快速发展,城市间的交流日益密切,要素的流动性和互赖性促进了城市网络的形成,并成为一种新的区域组织模式和空间结构。本文基于2018年腾讯人口迁徙数据,构建了372×372关系数据矩阵,并从不同交通方式出发,系统刻画了中国城市网络格局。研究表明:① 网络关联度高的城市主要集中在胡焕庸线以东区域,尤其是长三角、珠三角、京津冀、成渝等城市群地区的聚集程度最高,成为中国城市网络格局的主控力量;而西北半壁的城市处于被支配地位。② 依据迁徙量,将中国城市网络划分为国家级、大区级、区域级、地方级和基座级网络。城市网络结构随交通方式而变化,当网络等级下移时,节点城市趋于增多,网络密度加大,但网络范围趋于缩小,网络等级与迁徙路径存在着密切的关联性,国家级网络与空运相关,区域级网络与铁路运输相呼应,地方级网络与汽车运输相关。③ 不同运输方式的经济时空距离决定了网络结构,是引致网络随路径不同而产生分异的基本因素。
Traffic inequality and relations in Maritime Silk Road: A network flow analysis
Structural characteristics and formation mechanism of spatial correlation network of grain production in China
DOI:10.11821/dlxb202011008
[本文引用: 1]
Based on the panel data of China's inter-provincial grain production from 1996 to 2018, the modified gravity model was used to accurately calculate the spatial correlation of grain production and build a spatial correlation matrix. Firstly, the structural characteristics of grain production spatial correlation network were investigated from three aspects: overall characteristics, individual characteristics and block model through the social network analysis method (SNA) and then, the quadratic assignment procedure (QAP) method was used to explore its formation mechanism. The study found that: (1) The level of inter-provincial spatial correlation of grain production increases in fluctuation, but there is still room for improvement. The network structure shows better stability and accessibility, and the spillover effect has multiple superposition. (2) The inter-provincial spatial correlation network of grain production presents a significant core-edge distribution pattern of major grain-producing areas, main-sales areas and grain balance areas, and the major grain-producing areas are at the core position in the network, and the grain main-sales areas and the balance areas are at the edge. (3) The spatial correlation network of grain production can be divided into four functional blocks, namely, net spillover block, main beneficial block, broker block and bidirectional spillover block, and the spillover effect between blocks are featured by obvious gradient transmission. (4) The combined effect of natural endowment conditions and socio-economic factors promote the formation of spatial correlation network of grain production. The geographical proximity, differences in economic development, rural labor scale, mechanical service scale and cultivated land resources, and the similarity of precipitation and sunshine hours have significant impacts on the formation of spatial correlation network of grain production. The conclusions are of great significance for us to grasp the spatial transmission mechanism, realize the cross-regional coordination and formulate differentiated grain policies in China.
中国粮食生产空间关联网络的结构特征及其形成机制
DOI:10.11821/dlxb202011008
[本文引用: 1]
基于1996—2018年中国省际粮食生产面板数据,在修正的引力模型准确测算粮食生产空间关联关系及构建空间关联矩阵的基础上,首先运用社会网络分析方法从整体特征、个体特征及块模型3个方面具体考察了粮食生产空间关联网络的结构特征,进一步采用二次指派程序方法探讨其形成机制。研究发现:① 省际粮食生产空间关联的密切程度在波动中提高,但仍有提升空间,网络结构呈现较好的稳定性和可达性,溢出效应具有多重叠加特性;② 省际粮食生产空间关联网络呈现主产区、主销区、平衡区“核心—边缘”分布格局,粮食主产区在网络中处于核心地位,粮食主销区和平衡区则处于边缘地位;③ 粮食生产空间关联网络可划分为净溢出、主受益、经纪人和双向溢出4个板块,板块间的溢出效应具有明显的梯度传递特征;④ 自然禀赋条件与社会经济因素的共同作用推动了粮食生产空间关联网络的形成,地理空间邻近性、经济发展水平与农村劳动力规模、机械服务规模、耕地资源的差异、降水量和日照时数的相近性对粮食生产空间关联网络的形成具有显著影响。
Spatial structural characteristics of Chinese aviation network based on complex network theory
DOI:10.11821/xb200908002
[本文引用: 1]
Today, air transport plays an important role in transportation systems, especially for medium and long distance. Based on complex network theory, Chinese aviation network is abstracted as a set of edges (linkages) connecting a set of nodes (cities), and 144 cities and 1018 air routes were chosen for this research operated from winter 2007 to spring 2008. Then, this paper analyzes the spatial structure of Chinese aviation network using indices of degree distribution, the average path length, the clustering coefficient, degree-degree correlation, and clustering-degree correlation. Degree is the number of edges that a node shares with others, and thus symbolizes the importance of the node in the network. Degree distribution is used to reflect the distribution function of degree and donates the statistical characteristics of a network. Average path length is defined as the average number of edges along the shortest paths for all possible node-pairs in the network and it is a measurememt of the efficiency of transportation network. The clustering coefficient of a node is the ratio of actual edges to maximal edges between nodes which are directly connected with the node. The clustering coefficient of the whole network is the average of all individuals. As for an airport network, the average path length and the clustering coefficient are the two most important parameters reflecting network properties and configurations. The results show that Chinese aviation network has a relatively small average path length of 2.23 and a relatively large cluster coefficient of 0.69. More importantly, the accumulative degree distribution follows an exponential expression, with significance of 0.977. Therefore, Chinese aviation network shows the characteristic of a "Small World" network. Due to most new airports' preferences for direct connections with the three top-level national hubs: Beijing, Shanghai, and Guangzhou, the network hierarchy has no distinct difference with the exception of the top one. Also, the spatial distribution of Chinese aviation network is imbalanced according to the indices of degree, clustering coefficient and accessibility index. Besides, the correlation coefficients of these indices mentioned above are analyzed. The results show that there are negative degree correlation, nonlinear clustering-degree correlation, positive accessibility-degree correlation, and slightly positive clustering-accessibility correlation. In conclusion, with the rapid development of air transport demand driven by the market economy, Chinese aviation network will further evolve to a combined model of "Scale Free" and "Small World" networks, and its spatial structure will be more complex.
中国航空网络空间结构的复杂性
DOI:10.11821/xb200908002
[本文引用: 1]
航空运输是现代交通运输的重要组成部分,以机场和航线构建的网络是其提供运输服务的空间载体。基于复杂网络理论,借助度分布、平均路径长度、簇系数、度度相关性、簇度相关性等指标对以城市为节点的中国航空网络空间结构进行分析,发现其度累计概率分布表现为具有置信度较高的指数分布,且具有较小的平均路径长度(2.23)和较大的簇系数(0.69),整体结构呈现"小世界网络"的特点。由于中国航空网络规模较小,且新建机场倾向于直接与最高级枢纽机场建立航线联系,不利于区域枢纽机场的形成。因而除顶层结构(北京—上海—广州)外,中国航空网络的其它层级结构并不十分明显。从节点的度、簇系数、可达性等指标及其相关性分析,中国航空网络空间结构特征差异明显,表现出较强的集聚性,且可达性与城市体系上层结构在空间分布上较为吻合。随着中国航空运输需求的快速增加,未来航空网络在市场经济的推动下,将进一步表现出向具有"无标度"特征的"小世界网络"演变的趋势,航空网络的空间结构将日趋复杂化。
Collective dynamics of 'small-world' networks
DOI:10.1038/30918 URL [本文引用: 1]
The spatial structure of high-speed railways and urban networks in China: A flow approach
DOI:10.1111/tesg.12269 URL [本文引用: 1]
Chinese tourists in Nordic countries: An analysis of spatio-temporal behavior using geo-located travel blog data
Review and enlightenment of the method to measure the world city network of Zachary Neal
扎克瑞·尼尔世界城市网络测度方法评述及其启示
Application of the interlocking network model to mega-city-regions: Measuring polycentricity within and beyond city-regions
DOI:10.1080/00343400701874214 URL [本文引用: 1]
Hierarchical structure and distribution pattern of Chinese urban system based on aviation network
DOI:10.11821/yj2008010003
[本文引用: 1]
The air transportation has become an important conveyance to carry passengers and cargos, and an important factor to influence the regional urban system. The status of a city in the global or national aviation network directly reflects the hierarchy of the city in the global or national urban system. The aviation network which is comprised of nodes (airports) and lines (airlines) represents the spatial accessibility of the cities, and intuitionisticly reflects the hierarchical structure and distribution pattern of the national urban system. This article collects the airline data which include 128 cities open to air traffic and 2083 airlines from China's 14 major airline companies. The correlation analysis proves that in the aviation network the number of urban airlines was positively correlative to the size of the urban population. On this basis, through the aviation network analysis based on the airline network map of Chinese cities, the article uses the methods of charts discriminance and the clustering analysis to classify all the 128 cities into four hierarchies. They are national central cities which include three cities, regional central cities which include seven cities, sub-regional central cities which include 31 cities and general local central cities which include 87 cities. Then,from a unique perspective of aviation network the article reveals the characteristics of the hierarchical structure and distribution pattern of Chinese urban system under the open conditions, including:1) the urban hierarchical system takes on a typical pyramidal structure, which means the higher the hierarchy of the cities in the system, the smaller the number of cities; 2) the administrative, economic and tourism factors affect the aviation network markedly, consequently affect the urban hierarchical system strongly; 3) the distribution of Chinese cities has obvious differences between east and west, which means the higher-hierarchical cities are mainly distribute in the east, and the aviation relation of the west cities is mostly eastward; 4)the three national central cities including Beijing, Shanghai and Guangzhou and the seven regional central cities including Shenzhen, Urumqi, Shenyang, Chengdu, Xi'an, Chongqing and Kunming constitute the foundamental framework of Chinese urban aviation network, and they are the core of the Chinese urban system. The lower hierarchical cities join in the national aviation network through connecting with the higher hierarchical cities, and in this way they become part of the Chinese urban system.
基于航空网络的中国城市体系等级结构与分布格局
高速铁路对城市网络结构的影响研究: 基于铁路客运班列分析
DOI:10.11821/dlxb201602007
[本文引用: 1]
城市网络是近年来城市与区域研究的一个新方向.基于2003-2013年间8个横截面的中国铁路客运班列数据,采用加权度中心性和社区结构模型,探讨高速铁路建设对城市等级和集聚性空间格局及演化的影响.研究表明:① 基于铁路客运组织的城市等级结构呈现出位序--规模分布的特征和集聚性,且三大地带和各社区内城市也呈现出明显的位序--规模分布,随着高速铁路网络的扩展,加权度中心性的集聚性更明显,并逐步呈现出较为明显的层级结构和社区结构.② 城市等级结构呈现出明显的东中西地带性,廊道效应和经济,人口的耦合性,即基于铁路客运班列的城市等级结构与基于属性数据(人口/GDP)的结果表现出较大的相似性,但也存在一定的差异.城市社区结构与中国高速铁路网络,城市群的空间分布格局基本一致.随着高速铁路的建设,东中西三大地带间城市等级的差异呈扩大态势,但各社区间城市等级的差异呈缩小态势,部分社区核心城市已形成.
Geography interact with big data: Dialogue and reflection
DOI:10.11821/dlyj201512001
[本文引用: 1]
In the internet era, "Big data" wave spread rapidly to the economic and social fields. Geography is the natural laboratory in which big data research and application can be seen at work. The written speech focused on collision between geography and big data. It reviewed big data research and application in geography study. We also discussed the opportunities and challenges we would face during this collision. In summary, big data has had a certain influence on the geography research, especially in the human geography domain. Geographic information science will develop rapidly in the internet era of big data. But there are few disturbances in physical geography. Big data can not change the core proposition and the basic paradigm of geography. We should hold an open inclusive attitude to big data theory study and application research in geography.
地理学碰上“大数据”: 热反应与冷思考
DOI:10.11821/dlyj201512001
[本文引用: 1]
互联网时代的“大数据”热潮迅猛波及到经济社会的各个领域,地理学是大数据研究与应用的天然试验场。聚焦地理学与大数据的碰撞,回顾大数据在地理学研究中的应用探索,重点讨论大数据给地理学研究与发展带来的机遇与挑战。讨论认为:大数据已经对地理学研究产生了一定的影响。其中,人文地理学领域的反应最为热烈,基于大数据的研究案例纷纷呈现;地理信息科学在互联网大数据时代将会更加迅猛发展,自然地理学领域正在寻找和等待爆发点。目前,大数据还不能改变地理学的核心命题与基本范式,在坚持地理学核心思想的同时,应该对地理学领域有关大数据理论的探讨与应用尝试持有一种开放包容的态度。
