Simulation of land cover change in Beijing-Tianjin-Hebei region under different SSP-RCP scenarios
FAN Zemeng,1,2,3
1. State Key Laboratory of Resources and Environmental Information System, Institute of Geographic Sciences and Natural Resources Research, CAS, Beijing 100101, China
2. College of Resources and Environment, University of Chinese Academy of Sciences, Beijing 100049, China
3. Jiangsu Center for Collaborative Innovation in Geographical Information Resource Development and Application, Nanjing 210023, China
National Key R&D Program of China(2017YFA0603702) National Natural Science Foundation of China(41971358) National Natural Science Foundation of China(41930647) Strategic Priority Research Program of the Chinese Academy of Sciences(XDA20030203) Innovation Research Project of State Key Laboratory of Resources and Environment Information System, CAS
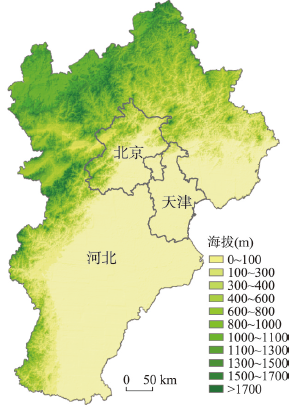
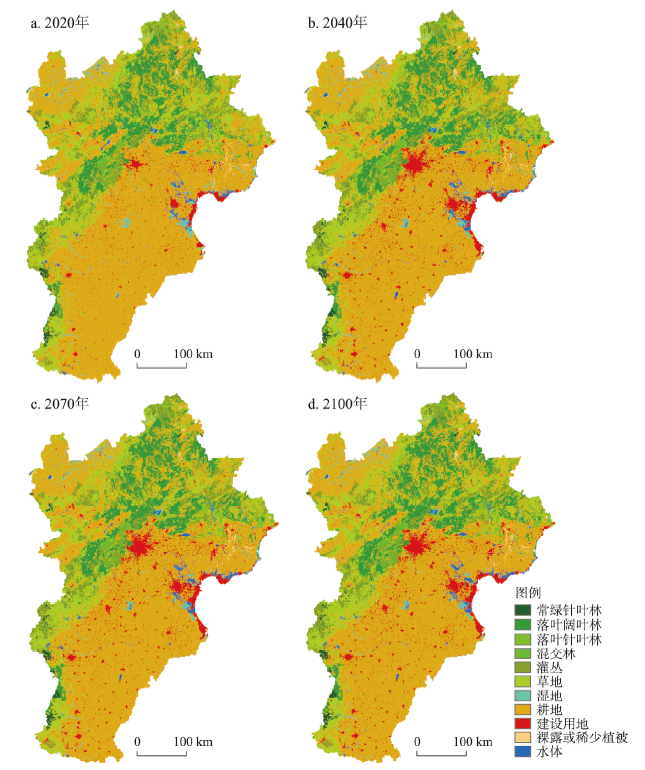
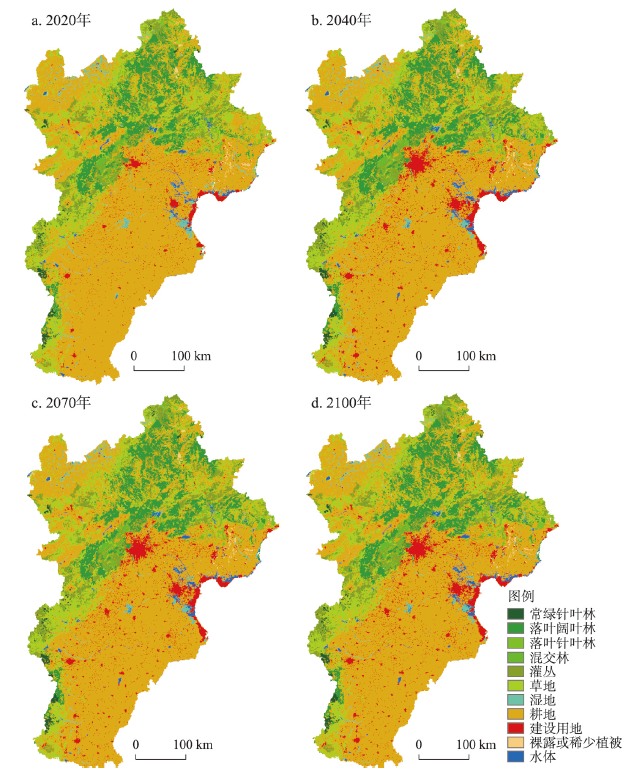
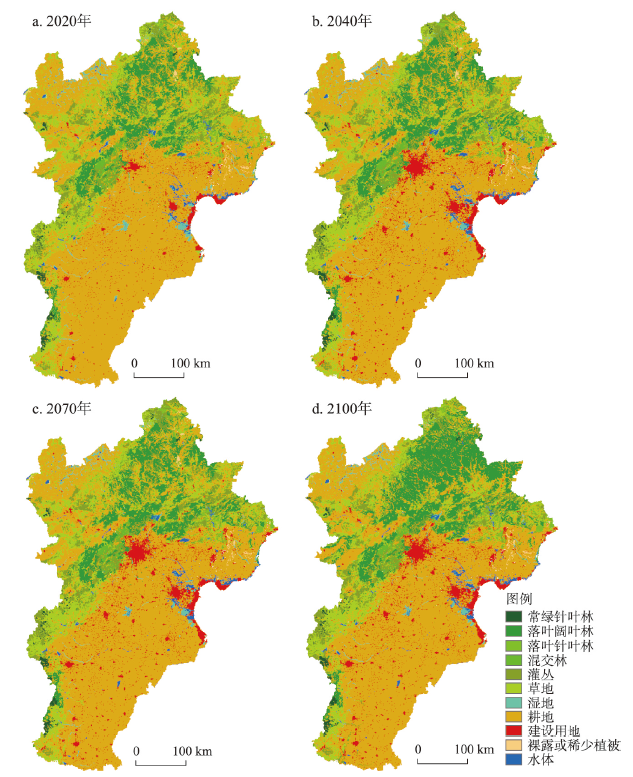
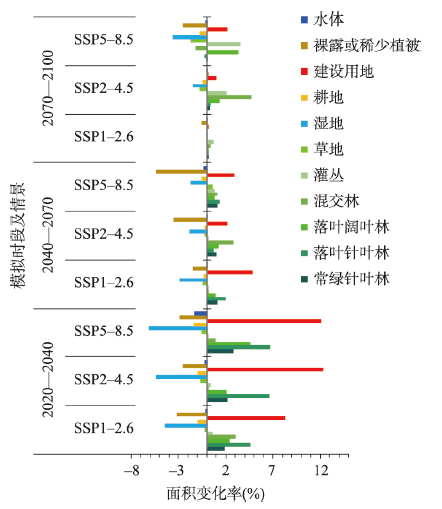
How to simulate the scenarios of land cover change, driven by climate change and human acitivities, is not only a hot issue in the field of land cover research, but also one of the core topics in the sustainable urbanization. A new method of scenarios of surface modeling in land cover (SSMLC) was developed to simulate the scenarios of land cover driven by the coupling of natural and human factors. Based on the climatic scenario data of CMIP6 SSP1-2.6, SSP2-4.5 and SSP5-8.5 released by IPCC in 2020 that combined the shared socio-economic paths (SSPS) and typical concentration paths (RCPs), the observation climatic data, the human data of population, GDP and transportation, the current data of land cover in 2020, and the related policies, scenarios of land cover in Beijing-Tianjin-Hebei (BTH) region are simulated under scenarios of SSP1-2.6, SSP2-4.5 and SSP5-8.5 during the periods of 2040, 2070 and 2100, respectively. The simulation results show that the overall accuracy of SSMLC in the BTH region is up to 93.52%. During the period from 2020 to 2100, change intensity of land cover in the BTH region is the highest (an increase of 3.29% per decade) between 2020 and 2040, and it would gradually decrease after 2040. Built-up land would have the highest increasing rate (an increase of 4.741% per decade), and the wetland would have the highest decreasing rate (a decrease of 2.64% per decade) between 2020 and 2100. The change intensity of land cover under the scenario SSP5-8.5 is higher than that under the scenarios of SSP1-2.6 and SSP1-2.6 between 2020 and 2100. The impacts of GDP, population, transportation and policies on the changes in cultivated land, built-up land, wetland and water body are generally higher than on other types of land cover. Moreover, the research results indicate that the SSMLC method could be used to explicitly project the changing trend and intensity of land cover under different sceaniros, which will benefit the spatial optimal allocation and planing of land cover, and could be used to obtain the key data for carrying out the eco-environment conservation measures in the BTH region in the future.
Keywords:scenario of surface modeling in land cover;
SSP-RCP scenarios;
land cover scenarios;
spatiotemporal simulation;
Beijing-Tianjin-Hebei region
FAN Zemeng. Simulation of land cover change in Beijing-Tianjin-Hebei region under different SSP-RCP scenarios. Acta Geographica Sinice, 2022, 77(1): 228-244 doi:10.11821/dlxb202201016
自20世纪90年代以来,国内外学者从不同视角,结合不同研究目相继构建了系列土地覆被变化情景预测模型。具有代表性的模型主要包括分析区域土地覆被变化经济效用的I-O(Input-Output)模型[11]、模拟农业生态过程的IMAGE(Integrated Model to Assess the Greenhouse Effect)综合模型[12]、模拟土地利用转换及影响的CLUE (Conversion of Land Use and its Effects)[13,14]、模拟城市用地变化元胞自动机(CA)模型[15]和系统动力学(SD)模型[16]、集成CA与SD模型的FLUS(future land use simulation model)模型[17],以及基于自然气候变化驱动的SMLC(Surface Modeling of Land Cover)模型[3-4, 7]。以上这些模型可概括为统计模型、随机模型、动态模型和综合模型4种类型。然而,由于这些模型存在一定的局限性,仅适用于某些研究区域或研究对象。譬如,IMAGE模型主要考虑农业用地需求,未考虑气候变化和社会经济发展对土地覆被变化的驱动影响;CA模型主要用于模拟城市用地变化,侧重于模拟城市发展过程中各种城市用地之间的相互转换,缺乏气候变化对森林、草地等土地覆被类型驱动的有效模拟;SD模型由于考虑的系统要素过于复杂,常用于中小时间尺度的土地覆被变化模拟,因此无法满足在长时间尺度上进行自然和人文因素耦合驱动下的土地覆被情景模拟需求;集成CA模型和SD模型的FLUS模型虽然很好地解决了区域尺度的城市用地模拟,但由于未考虑全球气候变化对土地覆被的驱动影响,在森林、草地、荒地等土地覆被类型的模拟方面具有较大的局限性。现有的SMLC模型能够在长时间尺度上,有效模拟气候变化驱动下的林草荒等人类活动干扰强度相对较低的土地覆被变化情景[3-4, 7, 18]。因此,选择SMLC模型可以实现京津冀西部及北部地区的主要土地覆被类型的情景模拟。但是,现有的SMLC模型在实现经济、人口、政策等人文因子对土地覆被变化的驱动效应方面,尤其是在模拟受人类活动干扰强度较大的建设用地耕地等土地覆被类型存在一定的局限性[18]。
基于年平均生物温度、年平均降水和潜在蒸散比率等关键气候参数,运用自然植被生态系统HLZ(Holdridge life zone)改进模型[43, 47-48],分别实现京津冀地区3种情景SSP1-2.6、SSP2-4.5和SSP5-8.5下1 km×1 km分辨率的2020年、2040年、2070年和2100年4个时段的自然植被生态系统的未来变化情景。在此基础上,深入分析和定量揭示自然植被生态系统类型与土地覆被类型在空间分布上的空间相似性和一致性特征,并结合土地覆被现状及其各类型的空间分布比率量化因子的基础上,综合考虑交通密度、人口密度、人均GDP等人文要素,以及京津冀地区协同发展规划、基本农田保护、自然保护区等政策措施对土地覆被变化的驱动和影响作用,对自然要素和人文要素共同驱动下的土地覆被情景曲面建模(Scenario of Surface Modelling in Land Cover, SSMLC)方法进行构建。该方法主要包括以下3个关键技术步骤。
式中:BT(x, y, t)、LR(x, y, t)和LP(x, y, t)分别是t时段栅格单元(x, y)的年平均生物温度、年平均降水量及潜在蒸散比率的以2为底的对数值;LBTi0、LRTi0和LPTi0则分别为HLZ模型判别体系中第i种自然植被生态系统类型所代表的空间位置的年平均生物温度、年降水量及年潜在蒸散率的标准值;当Dj(x, y, t) = min{Di(x, y, t)}时,t时段栅格单元(x, y)的值被赋值为第j类自然植被生态系统类型。根据3种情景SSP1-2.6、SSP2-4.5和SSP5-8.5下1 km×1 km分辨率的2020年、2040年、2070年和2100年4个时段的年平均生物温度、平均年降水和潜在蒸散比率数据,运行修正后的自然植被生态系统HLZ模型,分别以上3种情景的4个时段的自然植被生态系统未来情景的空间分布数据。
The temporal response of forests to CO-induced climate changes was examined for eastern North America. A forest stand simulation model was used with the assumption that climate will change at a constant rate as atmospheric CO doubles, and then as CO doubles again. Before being used to project future vegetation trends, the simulation model FORENA was verified by its ability to reproduce long, temporal sequences of plant community change recorded by fossil pollen and by its ability to reproduce today's vegetation. The simulated effects of changing monthly temperature and precipitation included a distinctive dieback of extant trees at most locations, with only partial recovery of biomass in areas of today's temperate deciduous forest. In the southern portion of today's deciduous-coniferous transition forests the simulated dieback was indistinct and recovery by deciduous tree species was rapid. In more northerly transition areas, the dieback not only was clearly expressed, but occurred twice, when new dominant species replaced extant conifers, then were themselves replaced, as climate change continued. Boreal conifers also underwent diebacks and were replaced by deciduous hardwoods more slowly in the north than in the south. Transient responses in species composition and carbon storage continued as much as 300 years after simulated climate changes ceased.
Land-use change models are important tools for integrated environmental management. Through scenario analysis they can help to identify near-future critical locations in the face of environmental change. A dynamic, spatially explicit, land-use change model is presented for the regional scale: CLUE-S. The model is specifically developed for the analysis of land use in small regions (e.g., a watershed or province) at a fine spatial resolution. The model structure is based on systems theory to allow the integrated analysis of land-use change in relation to socio-economic and biophysical driving factors. The model explicitly addresses the hierarchical organization of land use systems, spatial connectivity between locations and stability. Stability is incorporated by a set of variables that define the relative elasticity of the actual land-use type to conversion. The user can specify these settings based on expert knowledge or survey data. Two applications of the model in the Philippines and Malaysia are used to illustrate the functioning of the model and its validation.
Clarke KC, HoppenS, GaydosL.
A self-modifying cellular automaton model of historical urbanization in the San Francisco Bay area
Environment and Planning B: Planning and Design, 1997, 24(2): 247-261.
Urban agglomeration has been the inevitable result of China's rapid industrialization and urbanization over the last 30 years. Since the early 2000s, urban agglomeration has become the new regional unit participating in international competition and the division of labor. China has declared urban agglomeration the main spatial component of new types of urbanization over the next decade as clarified at the first Central Urbanization Working Conference and in the National New-type Urbanization Plan (2014?2020). However, research on urban agglomeration remains weak and needs to be strengthened. From 1934 to 2013, only 19 papers published in Acta Geographica Sinica contained the theme of urban agglomeration (0.55% of the total number of articles published) and the first paper on urban agglomeration appeared less than 10 years ago. Despite a small number of divergent studies, this work has contributed to and guided the formation of the overall pattern of urban agglomeration in China. For example, spatial analyses have promoted the formation of the fundamental framework of China's urban agglomeration spatial structure and guided the National New-type Urbanization Plan; spatial identification standards and technical processes have played an important role in identifying the scope and extent of urban agglomeration; serial studies have facilitated pragmatic research; and problems with the formation and development of urban agglomeration have provided a warning for future choices and Chinese development. Future research into urban agglomeration in China should (1) review and examine new problems in China's urban agglomeration options and cultivation; (2) critically consider urban agglomeration when promoting the formation of the 5+9+6 spatial pattern; (3) rely on urban agglomeration to construct new urbanization patterns such as 'stringing the agglomerations with the axis, supporting the axis with the agglomerations'; and (4) deepen national awareness about resources, environment effects and environmental carrying capacity in high density urban agglomerations, management and government coordination innovation, the construction of public finance and fiscal reserve mechanisms, the technical regulation of urban agglomeration planning, and standards for identifying the scope and extent of urban agglomeration.
In this article, we examine the economic linkage and competition among cities in the great metropolitan region of Jing-Jin-Ji. Specifically we demonstrate that Beijing, Tianjin and Hebei Province have developed their unique industry structures and gained corresponding comparative advantages since the beginning of the reform and opening up. Accordingly, we propose the function orientation of Beijing, Tianjin and Hebei Province based on their industrial characteristics and the principle of strategic interest of the country.
Mega- urban agglomerations in China play a vital role in both national economic development strategies and national new-type urbanization, and undertake important historical responsibility with the world economic center transfer to China. However, they suffer a series of increasingly serious eco- environmental problems in the process of development. Thus,studies on the interactive coupled effects between urbanization and eco-environment in megaurban agglomerations are the frontier areas and high priority tasks in the earth system science for the future ten years. This paper analyses the basic theory frame of the interactive coupled effects between urbanization and eco- environment in mega- urban agglomerations systematically. In theoretical aspect, based on the nonlinear relationship and coupling characteristics of the natural and human elements in mega- urban agglomerations system, we could estimate the interactive coercing intensity, nearcoupling and telecoupling mechanism ofthe inside and outside mega-urban agglomerations system after scientific identification of the key elements, and then form the basic interactive coupling theory. Moreover, we could build a spatio- temporal coupling dynamic model, which is integrated with multi- elements, multiscales,multi-scenarios, multi-modules and multi-agents. The model will be used to develop the intelligent decision support system for urban agglomeration sustainable development. In methodology aspect, the mega- urban agglomeration is regarded as an open complex giantsystem. We should establish the standardized shared database for exploring the interactive coupled effects between urbanization and eco- environment. Then using new technology for analyzing big data and the integration methods incorporating of multi- elements, multi- scales,multi- targets, multi- agents, multi- scenarios and multi- modules, we can build a methodology framework to analyze the complex interaction coupling between urbanization and ecoenvironment. The technical route is to analyze spatiotemporal evolution characteristics, identifythe key elements, interpret coupling relationship, reveal the mechanism of coercing effect, find the general rules, filtrate the control variables, solve the critical thresholds, conduct regulation experiments, simulate different scenarios, propose an optimized schemes, and achieve national goals. Furthermore, we could put forward the overall optimization scheme. In general, this research could provide theoretical guidance and method support for the transformation and sustainable development in mega-urban agglomerations.
Promoting coordinated development of the Beijing-Tianjin-Hebei Urban Agglomeration is not only a major national strategy, but also a long-term complex process. It is necessary to apply scientific theories and respect the laws of nature to realize the strategic target of common prosperity, share a clean environment, share the burden of risk of development, and build a world-class metropolis for the Beijing-Tianjin-Hebei Urban Agglomeration. This article examines the scientific foundation and patterns of coordinated development of the Beijing-Tianjin-Hebei Urban Agglomeration. Synergy theory, game theory, dissipative structure theory, and catastrophe theory are the theoretical basis of coordinated development of the Beijing-Tianjin-Hebei Urban Agglomeration. Synergy theory is the core theory for the coordinated development of the Beijing-Tianjin-Hebei Urban Agglomeration. The coordinated development process of the Beijing-Tianjin-Hebei Urban Agglomeration is a non-linear spiral progress of game, coordination, mutation, game, resynchronization, and mutation. Each game-coordination-mutation process promotes the coordinated development of the urban agglomeration to a higher level of coordination, and the progress fluctuates. This process includes eight stages: assistance phase, cooperation phase, harmonization phase, synergy phase, coordination phase, resonance phase, integration phase, and cohesion phase. Further analysis shows that the real connotation of coordinated development of the Beijing-Tianjin-Hebei Urban Agglomeration is to realize the coordination of planning, transportation, industrial development, urban and rural development, market, science and technology, finance, information, ecology, and the environment, as well as the construction of a collaborative development community. The Beijing-Tianjin-Hebei Urban Agglomeration will achieve advanced collaboration from low-level collaborative phase through regional coordination on planning, construction of traffic network, industrial development, joint development of urban and rural areas, market consolidation, science and technology cooperation, equal development of financial services, information sharing, ecological restoration, and pollution control. This study may provide a scientific foundation and theoretical basis for the coordinated development of the Beijing-Tianjin-Hebei Urban Agglomeration.
Urban spatial expansion has been research hotspot of urban geography for a long time. However, urban spatial progress and its driving forces showed diversified state under the context of different political systems and different development phases in the world. For example, there are debates on metropolitan expansion path between Western countries and China. One view advocated that metropolitan spatial expansion showed a trend from clustered to dispersed under the role of scale-economy. Another view found that above theory could not explain metropolitan spatial expansion progress in developing countries, such as China and India. In these metropolitan regions, rapid urban spatial expansion existed in "urban-rural integration" areas, not central big cities of metropolitan regions. Thus, it was different from Western developed countries due to particular political and economic factors in developing countries. In order to clarify metropolitan spatial pattern in a transitional period from planned economy to market economy, we utilized nighttime light data to analyze Beijing-Tianjin-Hebei metropolitan area from 1992 to 2012 as a case. A series of measurement methods has been used in the study, such as expansion intensity index, spatial correlation model and multi-dimensional model. The results are as follows: (1) Beijing, Tianjin, Tangshan were hotspot regions of metropolitan expansion during the whole research period. "Triangle region" among Baoding-Tianjin-Hebei were coldspot regions of metropolitan expansion. (2) Although metropolitan expansion has showed a dispersed trend, centralized powers are still strong in the progress of metropolitan development. (3) Metropolitan driving forces showed a diversified state. Market power was the main driving forces, followed by administration power, exogenous power and endogenous power. Market power, administration power and exogenous power has showed an upward trend. However, endogenous power has showed a downward trend. (4) We put forward some policy suggestions to optimize metropolitan spatial structure, such as reducing administrative intervention, building market-driven mechanism, strengthening internal and external two-way reform and promoting industrial upgrade.
Multi-dimensional analysis of urban expansion patterns and their driving forces based on the center of gravity-GTWR model: A case study of the Beijing-Tianjin-Hebei urban agglomeration
Research into urban expansion patterns and their driving forces is of great significance. Under the background of the integrated development of the Beijing-Tianjin-Hebei (Jing-Jin-Ji) urban agglomeration, it is important to study the temporal and spatial patterns of urban land expansion and the driving forces development. This paper uses land-use data of the Jing-Jin-Ji urban agglomeration from 1990 to 2015 and reveals the multi-dimensional characteristics of the urban land expansion patterns. We then combine the urban spatial interaction and the spatial and temporal nonstationarity of the urban land expansion process and build the center of gravity-geographically and temporally weighted regression (GTWR) model by coupling the center of gravity model with the GTWR model. Using the center of gravity-GTWR model, we analyze the driving forces of urban land expansion at the city scale, and summarize the dominant mode and core driving forces of the Jing-Jin-Ji urban agglomeration. The results show that: (1) Between 1990 and 2015, the expansion intensity of the Jing-Jin-Ji urban agglomeration showed a down-up-down trend, and the peak period of expansion was in 2005-2010. Before 2005, high-speed development was seen in Beijing, Tianjin, Baoding, and Langfang, which were then followed by rapid development in Xingtai and Handan. (2) Although the center of gravity of cities in the Jing-Jin-Ji urban agglomeration showed a divergent trend, the local interaction between cities was enhanced, and the driving forces of urban land expansion showed a characteristic of spatial spillover. (3) The spatial development mode of the Jing-Jin-Ji urban agglomeration changed from a dual-core development mode to a multi-core development mode, which was made up of three function cores: the transportation core in the northern part, the economic development core in the central part, and the investment core in the southern part. The integrated development between functional cores led to the multi-core development mode. (4) The center of gravity-GTWR model analyzes urban land expansion as a space-time dynamic system. The model proved to be feasible in the analysis of the driving forces of urban land expansion.
Quantifying the impact of urbanization on extreme climate events is significant for ecosystem responses, flood control, and urban planners. This study aimed to examine the urbanization effects on a suite of 36 extreme temperature and precipitation indices for the Beijing-Tianjin-Hebei (BTH) region by classifying the climate observations into three different urbanization levels. A total of 176 meteorological stations were used to identify large cities, small and medium-size cities and rural environments by applying K-means cluster analysis combined with spatial land use, nighttime light remote sensing, socio-economic data and Google Earth. The change trends of the extreme events during 1980-2015 were detected by using Mann-Kendall (MK) statistical test and Sen's slope estimator. Urbanization effects on those extreme events were calculated as well. Results indicated that the cool indices generally showed decreasing trends over the time period 1980-2015, while the warm indices tended to increase. Larger and more significant changes occurred with indices related to the daily minimum temperature. The different change rates of temperature extremes in urban, suburban and rural environments were mainly about the cool and warm night indices. Urbanization in medium-size cities tended to have a negative effect on cool indices, while the urbanization in large cities had a positive effect on warm indices. The significant difference of urbanization effect between large and medium-size cities lay in the daily maximum temperature. Results also demonstrated the scale effect of the urbanization on the extreme temperature events. However, the results showed little evidence of the urban effect on extreme precipitation events in the BTH region. This paper explored the changes in temperature and precipitation extremes and qualified the urbanization effects on those extreme events in the BTH region. The findings of this research can provide new insights into the future urban agglomeration development projects. (C) 2019 Elsevier B.V.
ZhangLixia, ChenXiaolong, XinXiaoge.
Short commentary on CMIP6 scenario model intercomparison project(ScenarioMIP)
For quantitatively explaining the relationship between the vascular plant abundance and habitat factors in the Qinghai-Tibet Plateau, a spatial simulation method has been developed to simulate the distribution of vascular plant species abundance. In this paper, seven datasets covering 37 national nature reserves were used to screen the best correlation equation between the vascular plant abundance and habitat factors in the plateau. These datasets include imformation on the vascular plant type, land cover, mean annual biotemperature, average total annual precipitation, topographic relief, patch connectivity and ecological diversity index. The results show that the multiple correlation coefficient between vascular plant abundance and various of habitat factors is 0.94, the mean error validated with the vascular plant species data of 37 national nature reserves is 2.21 types/km2, and the distribution of vascular plant species abundance gradually decreases from southeast to northwest, and reduces with increasing altitude except for the desert area of Qaidam Basin on the Qinghai-Tibet Plateau. Furthermore, the changes of vascular plant species abundance in the plateau during the periods from 1981 to 2010 (T0), from 2011-2040 (T2), from 2041to 2070 (T3) and from 2071 to 2100 (T4) were simulated by combining the land cover change in China and the climatic scenarios of CMIP5 RCP2.6, RCP4.5 and RCP8.5. The results from T0 to T4 show that the vascular plant species abundance in the plateau would decrease in the future, the vascular plant species abundance had the biggest change ranges under RCP8.5 scenario and the smallest change ranges under RCP2.6 scenario. In short, dynamic change and interaction of habitat factors directly affect the spatial distribution of vascular plant species abundance on the Qinghai-Tibet Plateau.
From the policy allowing couples to have a second child if one parent is an only child to universal two-child policy, fertility policy in China had changed in succession, which had caused extensive social concerns and would have an influence on Chinese demographics in the future. This article projects the trend of total population and demographic structure in China after implementing the universal two-child policy by queue group element method from the demographic perspective, and analyzes the influence of the policy on Chinese population spatial distribution from a geographic perspective. The results show that: (1) Implementing a universal two-child policy can reduce the declining trend of the total population, aging of the population, and dropping of working age population. (2) Eastern China has the highest population density, followed by the central, northeastern, and western regions. Implementing a universal two-child policy can increase the population density of the area to the southeast of the Hu Line, but there will be little change to the northwest of the Hu Line. The current population spatial distribution pattern will continue to exist. (3) Based on the provincial-level annual change intensities of population density, China can be divided into rapid population growth zone, medium-speed population growth zone, slow population growth zone, and stable population zone.
... 自20世纪90年代以来,国内外学者从不同视角,结合不同研究目相继构建了系列土地覆被变化情景预测模型.具有代表性的模型主要包括分析区域土地覆被变化经济效用的I-O(Input-Output)模型[11]、模拟农业生态过程的IMAGE(Integrated Model to Assess the Greenhouse Effect)综合模型[12]、模拟土地利用转换及影响的CLUE (Conversion of Land Use and its Effects)[13,14]、模拟城市用地变化元胞自动机(CA)模型[15]和系统动力学(SD)模型[16]、集成CA与SD模型的FLUS(future land use simulation model)模型[17],以及基于自然气候变化驱动的SMLC(Surface Modeling of Land Cover)模型[3-4, 7].以上这些模型可概括为统计模型、随机模型、动态模型和综合模型4种类型.然而,由于这些模型存在一定的局限性,仅适用于某些研究区域或研究对象.譬如,IMAGE模型主要考虑农业用地需求,未考虑气候变化和社会经济发展对土地覆被变化的驱动影响;CA模型主要用于模拟城市用地变化,侧重于模拟城市发展过程中各种城市用地之间的相互转换,缺乏气候变化对森林、草地等土地覆被类型驱动的有效模拟;SD模型由于考虑的系统要素过于复杂,常用于中小时间尺度的土地覆被变化模拟,因此无法满足在长时间尺度上进行自然和人文因素耦合驱动下的土地覆被情景模拟需求;集成CA模型和SD模型的FLUS模型虽然很好地解决了区域尺度的城市用地模拟,但由于未考虑全球气候变化对土地覆被的驱动影响,在森林、草地、荒地等土地覆被类型的模拟方面具有较大的局限性.现有的SMLC模型能够在长时间尺度上,有效模拟气候变化驱动下的林草荒等人类活动干扰强度相对较低的土地覆被变化情景[3-4, 7, 18].因此,选择SMLC模型可以实现京津冀西部及北部地区的主要土地覆被类型的情景模拟.但是,现有的SMLC模型在实现经济、人口、政策等人文因子对土地覆被变化的驱动效应方面,尤其是在模拟受人类活动干扰强度较大的建设用地耕地等土地覆被类型存在一定的局限性[18]. ...
... 自20世纪90年代以来,国内外学者从不同视角,结合不同研究目相继构建了系列土地覆被变化情景预测模型.具有代表性的模型主要包括分析区域土地覆被变化经济效用的I-O(Input-Output)模型[11]、模拟农业生态过程的IMAGE(Integrated Model to Assess the Greenhouse Effect)综合模型[12]、模拟土地利用转换及影响的CLUE (Conversion of Land Use and its Effects)[13,14]、模拟城市用地变化元胞自动机(CA)模型[15]和系统动力学(SD)模型[16]、集成CA与SD模型的FLUS(future land use simulation model)模型[17],以及基于自然气候变化驱动的SMLC(Surface Modeling of Land Cover)模型[3-4, 7].以上这些模型可概括为统计模型、随机模型、动态模型和综合模型4种类型.然而,由于这些模型存在一定的局限性,仅适用于某些研究区域或研究对象.譬如,IMAGE模型主要考虑农业用地需求,未考虑气候变化和社会经济发展对土地覆被变化的驱动影响;CA模型主要用于模拟城市用地变化,侧重于模拟城市发展过程中各种城市用地之间的相互转换,缺乏气候变化对森林、草地等土地覆被类型驱动的有效模拟;SD模型由于考虑的系统要素过于复杂,常用于中小时间尺度的土地覆被变化模拟,因此无法满足在长时间尺度上进行自然和人文因素耦合驱动下的土地覆被情景模拟需求;集成CA模型和SD模型的FLUS模型虽然很好地解决了区域尺度的城市用地模拟,但由于未考虑全球气候变化对土地覆被的驱动影响,在森林、草地、荒地等土地覆被类型的模拟方面具有较大的局限性.现有的SMLC模型能够在长时间尺度上,有效模拟气候变化驱动下的林草荒等人类活动干扰强度相对较低的土地覆被变化情景[3-4, 7, 18].因此,选择SMLC模型可以实现京津冀西部及北部地区的主要土地覆被类型的情景模拟.但是,现有的SMLC模型在实现经济、人口、政策等人文因子对土地覆被变化的驱动效应方面,尤其是在模拟受人类活动干扰强度较大的建设用地耕地等土地覆被类型存在一定的局限性[18]. ...
... 自20世纪90年代以来,国内外学者从不同视角,结合不同研究目相继构建了系列土地覆被变化情景预测模型.具有代表性的模型主要包括分析区域土地覆被变化经济效用的I-O(Input-Output)模型[11]、模拟农业生态过程的IMAGE(Integrated Model to Assess the Greenhouse Effect)综合模型[12]、模拟土地利用转换及影响的CLUE (Conversion of Land Use and its Effects)[13,14]、模拟城市用地变化元胞自动机(CA)模型[15]和系统动力学(SD)模型[16]、集成CA与SD模型的FLUS(future land use simulation model)模型[17],以及基于自然气候变化驱动的SMLC(Surface Modeling of Land Cover)模型[3-4, 7].以上这些模型可概括为统计模型、随机模型、动态模型和综合模型4种类型.然而,由于这些模型存在一定的局限性,仅适用于某些研究区域或研究对象.譬如,IMAGE模型主要考虑农业用地需求,未考虑气候变化和社会经济发展对土地覆被变化的驱动影响;CA模型主要用于模拟城市用地变化,侧重于模拟城市发展过程中各种城市用地之间的相互转换,缺乏气候变化对森林、草地等土地覆被类型驱动的有效模拟;SD模型由于考虑的系统要素过于复杂,常用于中小时间尺度的土地覆被变化模拟,因此无法满足在长时间尺度上进行自然和人文因素耦合驱动下的土地覆被情景模拟需求;集成CA模型和SD模型的FLUS模型虽然很好地解决了区域尺度的城市用地模拟,但由于未考虑全球气候变化对土地覆被的驱动影响,在森林、草地、荒地等土地覆被类型的模拟方面具有较大的局限性.现有的SMLC模型能够在长时间尺度上,有效模拟气候变化驱动下的林草荒等人类活动干扰强度相对较低的土地覆被变化情景[3-4, 7, 18].因此,选择SMLC模型可以实现京津冀西部及北部地区的主要土地覆被类型的情景模拟.但是,现有的SMLC模型在实现经济、人口、政策等人文因子对土地覆被变化的驱动效应方面,尤其是在模拟受人类活动干扰强度较大的建设用地耕地等土地覆被类型存在一定的局限性[18]. ...
... 自20世纪90年代以来,国内外学者从不同视角,结合不同研究目相继构建了系列土地覆被变化情景预测模型.具有代表性的模型主要包括分析区域土地覆被变化经济效用的I-O(Input-Output)模型[11]、模拟农业生态过程的IMAGE(Integrated Model to Assess the Greenhouse Effect)综合模型[12]、模拟土地利用转换及影响的CLUE (Conversion of Land Use and its Effects)[13,14]、模拟城市用地变化元胞自动机(CA)模型[15]和系统动力学(SD)模型[16]、集成CA与SD模型的FLUS(future land use simulation model)模型[17],以及基于自然气候变化驱动的SMLC(Surface Modeling of Land Cover)模型[3-4, 7].以上这些模型可概括为统计模型、随机模型、动态模型和综合模型4种类型.然而,由于这些模型存在一定的局限性,仅适用于某些研究区域或研究对象.譬如,IMAGE模型主要考虑农业用地需求,未考虑气候变化和社会经济发展对土地覆被变化的驱动影响;CA模型主要用于模拟城市用地变化,侧重于模拟城市发展过程中各种城市用地之间的相互转换,缺乏气候变化对森林、草地等土地覆被类型驱动的有效模拟;SD模型由于考虑的系统要素过于复杂,常用于中小时间尺度的土地覆被变化模拟,因此无法满足在长时间尺度上进行自然和人文因素耦合驱动下的土地覆被情景模拟需求;集成CA模型和SD模型的FLUS模型虽然很好地解决了区域尺度的城市用地模拟,但由于未考虑全球气候变化对土地覆被的驱动影响,在森林、草地、荒地等土地覆被类型的模拟方面具有较大的局限性.现有的SMLC模型能够在长时间尺度上,有效模拟气候变化驱动下的林草荒等人类活动干扰强度相对较低的土地覆被变化情景[3-4, 7, 18].因此,选择SMLC模型可以实现京津冀西部及北部地区的主要土地覆被类型的情景模拟.但是,现有的SMLC模型在实现经济、人口、政策等人文因子对土地覆被变化的驱动效应方面,尤其是在模拟受人类活动干扰强度较大的建设用地耕地等土地覆被类型存在一定的局限性[18]. ...
... 自20世纪90年代以来,国内外学者从不同视角,结合不同研究目相继构建了系列土地覆被变化情景预测模型.具有代表性的模型主要包括分析区域土地覆被变化经济效用的I-O(Input-Output)模型[11]、模拟农业生态过程的IMAGE(Integrated Model to Assess the Greenhouse Effect)综合模型[12]、模拟土地利用转换及影响的CLUE (Conversion of Land Use and its Effects)[13,14]、模拟城市用地变化元胞自动机(CA)模型[15]和系统动力学(SD)模型[16]、集成CA与SD模型的FLUS(future land use simulation model)模型[17],以及基于自然气候变化驱动的SMLC(Surface Modeling of Land Cover)模型[3-4, 7].以上这些模型可概括为统计模型、随机模型、动态模型和综合模型4种类型.然而,由于这些模型存在一定的局限性,仅适用于某些研究区域或研究对象.譬如,IMAGE模型主要考虑农业用地需求,未考虑气候变化和社会经济发展对土地覆被变化的驱动影响;CA模型主要用于模拟城市用地变化,侧重于模拟城市发展过程中各种城市用地之间的相互转换,缺乏气候变化对森林、草地等土地覆被类型驱动的有效模拟;SD模型由于考虑的系统要素过于复杂,常用于中小时间尺度的土地覆被变化模拟,因此无法满足在长时间尺度上进行自然和人文因素耦合驱动下的土地覆被情景模拟需求;集成CA模型和SD模型的FLUS模型虽然很好地解决了区域尺度的城市用地模拟,但由于未考虑全球气候变化对土地覆被的驱动影响,在森林、草地、荒地等土地覆被类型的模拟方面具有较大的局限性.现有的SMLC模型能够在长时间尺度上,有效模拟气候变化驱动下的林草荒等人类活动干扰强度相对较低的土地覆被变化情景[3-4, 7, 18].因此,选择SMLC模型可以实现京津冀西部及北部地区的主要土地覆被类型的情景模拟.但是,现有的SMLC模型在实现经济、人口、政策等人文因子对土地覆被变化的驱动效应方面,尤其是在模拟受人类活动干扰强度较大的建设用地耕地等土地覆被类型存在一定的局限性[18]. ...
Modeling the global society-biosphere-climate system: Part 1: Model description and testing
2
1994
... 自20世纪90年代以来,国内外学者从不同视角,结合不同研究目相继构建了系列土地覆被变化情景预测模型.具有代表性的模型主要包括分析区域土地覆被变化经济效用的I-O(Input-Output)模型[11]、模拟农业生态过程的IMAGE(Integrated Model to Assess the Greenhouse Effect)综合模型[12]、模拟土地利用转换及影响的CLUE (Conversion of Land Use and its Effects)[13,14]、模拟城市用地变化元胞自动机(CA)模型[15]和系统动力学(SD)模型[16]、集成CA与SD模型的FLUS(future land use simulation model)模型[17],以及基于自然气候变化驱动的SMLC(Surface Modeling of Land Cover)模型[3-4, 7].以上这些模型可概括为统计模型、随机模型、动态模型和综合模型4种类型.然而,由于这些模型存在一定的局限性,仅适用于某些研究区域或研究对象.譬如,IMAGE模型主要考虑农业用地需求,未考虑气候变化和社会经济发展对土地覆被变化的驱动影响;CA模型主要用于模拟城市用地变化,侧重于模拟城市发展过程中各种城市用地之间的相互转换,缺乏气候变化对森林、草地等土地覆被类型驱动的有效模拟;SD模型由于考虑的系统要素过于复杂,常用于中小时间尺度的土地覆被变化模拟,因此无法满足在长时间尺度上进行自然和人文因素耦合驱动下的土地覆被情景模拟需求;集成CA模型和SD模型的FLUS模型虽然很好地解决了区域尺度的城市用地模拟,但由于未考虑全球气候变化对土地覆被的驱动影响,在森林、草地、荒地等土地覆被类型的模拟方面具有较大的局限性.现有的SMLC模型能够在长时间尺度上,有效模拟气候变化驱动下的林草荒等人类活动干扰强度相对较低的土地覆被变化情景[3-4, 7, 18].因此,选择SMLC模型可以实现京津冀西部及北部地区的主要土地覆被类型的情景模拟.但是,现有的SMLC模型在实现经济、人口、政策等人文因子对土地覆被变化的驱动效应方面,尤其是在模拟受人类活动干扰强度较大的建设用地耕地等土地覆被类型存在一定的局限性[18]. ...
Simulation of changes in the spatial pattern of land use in China
2
1999
... 自20世纪90年代以来,国内外学者从不同视角,结合不同研究目相继构建了系列土地覆被变化情景预测模型.具有代表性的模型主要包括分析区域土地覆被变化经济效用的I-O(Input-Output)模型[11]、模拟农业生态过程的IMAGE(Integrated Model to Assess the Greenhouse Effect)综合模型[12]、模拟土地利用转换及影响的CLUE (Conversion of Land Use and its Effects)[13,14]、模拟城市用地变化元胞自动机(CA)模型[15]和系统动力学(SD)模型[16]、集成CA与SD模型的FLUS(future land use simulation model)模型[17],以及基于自然气候变化驱动的SMLC(Surface Modeling of Land Cover)模型[3-4, 7].以上这些模型可概括为统计模型、随机模型、动态模型和综合模型4种类型.然而,由于这些模型存在一定的局限性,仅适用于某些研究区域或研究对象.譬如,IMAGE模型主要考虑农业用地需求,未考虑气候变化和社会经济发展对土地覆被变化的驱动影响;CA模型主要用于模拟城市用地变化,侧重于模拟城市发展过程中各种城市用地之间的相互转换,缺乏气候变化对森林、草地等土地覆被类型驱动的有效模拟;SD模型由于考虑的系统要素过于复杂,常用于中小时间尺度的土地覆被变化模拟,因此无法满足在长时间尺度上进行自然和人文因素耦合驱动下的土地覆被情景模拟需求;集成CA模型和SD模型的FLUS模型虽然很好地解决了区域尺度的城市用地模拟,但由于未考虑全球气候变化对土地覆被的驱动影响,在森林、草地、荒地等土地覆被类型的模拟方面具有较大的局限性.现有的SMLC模型能够在长时间尺度上,有效模拟气候变化驱动下的林草荒等人类活动干扰强度相对较低的土地覆被变化情景[3-4, 7, 18].因此,选择SMLC模型可以实现京津冀西部及北部地区的主要土地覆被类型的情景模拟.但是,现有的SMLC模型在实现经济、人口、政策等人文因子对土地覆被变化的驱动效应方面,尤其是在模拟受人类活动干扰强度较大的建设用地耕地等土地覆被类型存在一定的局限性[18]. ...
Modeling the spatial dynamics of regional land use: The CLUE-S model
2
2002
... 自20世纪90年代以来,国内外学者从不同视角,结合不同研究目相继构建了系列土地覆被变化情景预测模型.具有代表性的模型主要包括分析区域土地覆被变化经济效用的I-O(Input-Output)模型[11]、模拟农业生态过程的IMAGE(Integrated Model to Assess the Greenhouse Effect)综合模型[12]、模拟土地利用转换及影响的CLUE (Conversion of Land Use and its Effects)[13,14]、模拟城市用地变化元胞自动机(CA)模型[15]和系统动力学(SD)模型[16]、集成CA与SD模型的FLUS(future land use simulation model)模型[17],以及基于自然气候变化驱动的SMLC(Surface Modeling of Land Cover)模型[3-4, 7].以上这些模型可概括为统计模型、随机模型、动态模型和综合模型4种类型.然而,由于这些模型存在一定的局限性,仅适用于某些研究区域或研究对象.譬如,IMAGE模型主要考虑农业用地需求,未考虑气候变化和社会经济发展对土地覆被变化的驱动影响;CA模型主要用于模拟城市用地变化,侧重于模拟城市发展过程中各种城市用地之间的相互转换,缺乏气候变化对森林、草地等土地覆被类型驱动的有效模拟;SD模型由于考虑的系统要素过于复杂,常用于中小时间尺度的土地覆被变化模拟,因此无法满足在长时间尺度上进行自然和人文因素耦合驱动下的土地覆被情景模拟需求;集成CA模型和SD模型的FLUS模型虽然很好地解决了区域尺度的城市用地模拟,但由于未考虑全球气候变化对土地覆被的驱动影响,在森林、草地、荒地等土地覆被类型的模拟方面具有较大的局限性.现有的SMLC模型能够在长时间尺度上,有效模拟气候变化驱动下的林草荒等人类活动干扰强度相对较低的土地覆被变化情景[3-4, 7, 18].因此,选择SMLC模型可以实现京津冀西部及北部地区的主要土地覆被类型的情景模拟.但是,现有的SMLC模型在实现经济、人口、政策等人文因子对土地覆被变化的驱动效应方面,尤其是在模拟受人类活动干扰强度较大的建设用地耕地等土地覆被类型存在一定的局限性[18]. ...
A self-modifying cellular automaton model of historical urbanization in the San Francisco Bay area
2
1997
... 自20世纪90年代以来,国内外学者从不同视角,结合不同研究目相继构建了系列土地覆被变化情景预测模型.具有代表性的模型主要包括分析区域土地覆被变化经济效用的I-O(Input-Output)模型[11]、模拟农业生态过程的IMAGE(Integrated Model to Assess the Greenhouse Effect)综合模型[12]、模拟土地利用转换及影响的CLUE (Conversion of Land Use and its Effects)[13,14]、模拟城市用地变化元胞自动机(CA)模型[15]和系统动力学(SD)模型[16]、集成CA与SD模型的FLUS(future land use simulation model)模型[17],以及基于自然气候变化驱动的SMLC(Surface Modeling of Land Cover)模型[3-4, 7].以上这些模型可概括为统计模型、随机模型、动态模型和综合模型4种类型.然而,由于这些模型存在一定的局限性,仅适用于某些研究区域或研究对象.譬如,IMAGE模型主要考虑农业用地需求,未考虑气候变化和社会经济发展对土地覆被变化的驱动影响;CA模型主要用于模拟城市用地变化,侧重于模拟城市发展过程中各种城市用地之间的相互转换,缺乏气候变化对森林、草地等土地覆被类型驱动的有效模拟;SD模型由于考虑的系统要素过于复杂,常用于中小时间尺度的土地覆被变化模拟,因此无法满足在长时间尺度上进行自然和人文因素耦合驱动下的土地覆被情景模拟需求;集成CA模型和SD模型的FLUS模型虽然很好地解决了区域尺度的城市用地模拟,但由于未考虑全球气候变化对土地覆被的驱动影响,在森林、草地、荒地等土地覆被类型的模拟方面具有较大的局限性.现有的SMLC模型能够在长时间尺度上,有效模拟气候变化驱动下的林草荒等人类活动干扰强度相对较低的土地覆被变化情景[3-4, 7, 18].因此,选择SMLC模型可以实现京津冀西部及北部地区的主要土地覆被类型的情景模拟.但是,现有的SMLC模型在实现经济、人口、政策等人文因子对土地覆被变化的驱动效应方面,尤其是在模拟受人类活动干扰强度较大的建设用地耕地等土地覆被类型存在一定的局限性[18]. ...
Developing land use scenario dynamics model by the integration of system dynamics model and cellular automata model
2
2005
... 自20世纪90年代以来,国内外学者从不同视角,结合不同研究目相继构建了系列土地覆被变化情景预测模型.具有代表性的模型主要包括分析区域土地覆被变化经济效用的I-O(Input-Output)模型[11]、模拟农业生态过程的IMAGE(Integrated Model to Assess the Greenhouse Effect)综合模型[12]、模拟土地利用转换及影响的CLUE (Conversion of Land Use and its Effects)[13,14]、模拟城市用地变化元胞自动机(CA)模型[15]和系统动力学(SD)模型[16]、集成CA与SD模型的FLUS(future land use simulation model)模型[17],以及基于自然气候变化驱动的SMLC(Surface Modeling of Land Cover)模型[3-4, 7].以上这些模型可概括为统计模型、随机模型、动态模型和综合模型4种类型.然而,由于这些模型存在一定的局限性,仅适用于某些研究区域或研究对象.譬如,IMAGE模型主要考虑农业用地需求,未考虑气候变化和社会经济发展对土地覆被变化的驱动影响;CA模型主要用于模拟城市用地变化,侧重于模拟城市发展过程中各种城市用地之间的相互转换,缺乏气候变化对森林、草地等土地覆被类型驱动的有效模拟;SD模型由于考虑的系统要素过于复杂,常用于中小时间尺度的土地覆被变化模拟,因此无法满足在长时间尺度上进行自然和人文因素耦合驱动下的土地覆被情景模拟需求;集成CA模型和SD模型的FLUS模型虽然很好地解决了区域尺度的城市用地模拟,但由于未考虑全球气候变化对土地覆被的驱动影响,在森林、草地、荒地等土地覆被类型的模拟方面具有较大的局限性.现有的SMLC模型能够在长时间尺度上,有效模拟气候变化驱动下的林草荒等人类活动干扰强度相对较低的土地覆被变化情景[3-4, 7, 18].因此,选择SMLC模型可以实现京津冀西部及北部地区的主要土地覆被类型的情景模拟.但是,现有的SMLC模型在实现经济、人口、政策等人文因子对土地覆被变化的驱动效应方面,尤其是在模拟受人类活动干扰强度较大的建设用地耕地等土地覆被类型存在一定的局限性[18]. ...
A future land use simulation model (FLUS) for simulating multiple land use scenarios by coupling human and natural effects
2
2017
... 自20世纪90年代以来,国内外学者从不同视角,结合不同研究目相继构建了系列土地覆被变化情景预测模型.具有代表性的模型主要包括分析区域土地覆被变化经济效用的I-O(Input-Output)模型[11]、模拟农业生态过程的IMAGE(Integrated Model to Assess the Greenhouse Effect)综合模型[12]、模拟土地利用转换及影响的CLUE (Conversion of Land Use and its Effects)[13,14]、模拟城市用地变化元胞自动机(CA)模型[15]和系统动力学(SD)模型[16]、集成CA与SD模型的FLUS(future land use simulation model)模型[17],以及基于自然气候变化驱动的SMLC(Surface Modeling of Land Cover)模型[3-4, 7].以上这些模型可概括为统计模型、随机模型、动态模型和综合模型4种类型.然而,由于这些模型存在一定的局限性,仅适用于某些研究区域或研究对象.譬如,IMAGE模型主要考虑农业用地需求,未考虑气候变化和社会经济发展对土地覆被变化的驱动影响;CA模型主要用于模拟城市用地变化,侧重于模拟城市发展过程中各种城市用地之间的相互转换,缺乏气候变化对森林、草地等土地覆被类型驱动的有效模拟;SD模型由于考虑的系统要素过于复杂,常用于中小时间尺度的土地覆被变化模拟,因此无法满足在长时间尺度上进行自然和人文因素耦合驱动下的土地覆被情景模拟需求;集成CA模型和SD模型的FLUS模型虽然很好地解决了区域尺度的城市用地模拟,但由于未考虑全球气候变化对土地覆被的驱动影响,在森林、草地、荒地等土地覆被类型的模拟方面具有较大的局限性.现有的SMLC模型能够在长时间尺度上,有效模拟气候变化驱动下的林草荒等人类活动干扰强度相对较低的土地覆被变化情景[3-4, 7, 18].因此,选择SMLC模型可以实现京津冀西部及北部地区的主要土地覆被类型的情景模拟.但是,现有的SMLC模型在实现经济、人口、政策等人文因子对土地覆被变化的驱动效应方面,尤其是在模拟受人类活动干扰强度较大的建设用地耕地等土地覆被类型存在一定的局限性[18]. ...
Scenarios of land cover in Eurasia under climate change
4
2020
... 自20世纪90年代以来,国内外学者从不同视角,结合不同研究目相继构建了系列土地覆被变化情景预测模型.具有代表性的模型主要包括分析区域土地覆被变化经济效用的I-O(Input-Output)模型[11]、模拟农业生态过程的IMAGE(Integrated Model to Assess the Greenhouse Effect)综合模型[12]、模拟土地利用转换及影响的CLUE (Conversion of Land Use and its Effects)[13,14]、模拟城市用地变化元胞自动机(CA)模型[15]和系统动力学(SD)模型[16]、集成CA与SD模型的FLUS(future land use simulation model)模型[17],以及基于自然气候变化驱动的SMLC(Surface Modeling of Land Cover)模型[3-4, 7].以上这些模型可概括为统计模型、随机模型、动态模型和综合模型4种类型.然而,由于这些模型存在一定的局限性,仅适用于某些研究区域或研究对象.譬如,IMAGE模型主要考虑农业用地需求,未考虑气候变化和社会经济发展对土地覆被变化的驱动影响;CA模型主要用于模拟城市用地变化,侧重于模拟城市发展过程中各种城市用地之间的相互转换,缺乏气候变化对森林、草地等土地覆被类型驱动的有效模拟;SD模型由于考虑的系统要素过于复杂,常用于中小时间尺度的土地覆被变化模拟,因此无法满足在长时间尺度上进行自然和人文因素耦合驱动下的土地覆被情景模拟需求;集成CA模型和SD模型的FLUS模型虽然很好地解决了区域尺度的城市用地模拟,但由于未考虑全球气候变化对土地覆被的驱动影响,在森林、草地、荒地等土地覆被类型的模拟方面具有较大的局限性.现有的SMLC模型能够在长时间尺度上,有效模拟气候变化驱动下的林草荒等人类活动干扰强度相对较低的土地覆被变化情景[3-4, 7, 18].因此,选择SMLC模型可以实现京津冀西部及北部地区的主要土地覆被类型的情景模拟.但是,现有的SMLC模型在实现经济、人口、政策等人文因子对土地覆被变化的驱动效应方面,尤其是在模拟受人类活动干扰强度较大的建设用地耕地等土地覆被类型存在一定的局限性[18]. ...
... 基于年平均生物温度、年平均降水和潜在蒸散比率等关键气候参数,运用自然植被生态系统HLZ(Holdridge life zone)改进模型[43, 47-48],分别实现京津冀地区3种情景SSP1-2.6、SSP2-4.5和SSP5-8.5下1 km×1 km分辨率的2020年、2040年、2070年和2100年4个时段的自然植被生态系统的未来变化情景.在此基础上,深入分析和定量揭示自然植被生态系统类型与土地覆被类型在空间分布上的空间相似性和一致性特征,并结合土地覆被现状及其各类型的空间分布比率量化因子的基础上,综合考虑交通密度、人口密度、人均GDP等人文要素,以及京津冀地区协同发展规划、基本农田保护、自然保护区等政策措施对土地覆被变化的驱动和影响作用,对自然要素和人文要素共同驱动下的土地覆被情景曲面建模(Scenario of Surface Modelling in Land Cover, SSMLC)方法进行构建.该方法主要包括以下3个关键技术步骤. ...
Determination of world plant formations from simple climatic data
2
1947
... 基于年平均生物温度、年平均降水和潜在蒸散比率等关键气候参数,运用自然植被生态系统HLZ(Holdridge life zone)改进模型[43, 47-48],分别实现京津冀地区3种情景SSP1-2.6、SSP2-4.5和SSP5-8.5下1 km×1 km分辨率的2020年、2040年、2070年和2100年4个时段的自然植被生态系统的未来变化情景.在此基础上,深入分析和定量揭示自然植被生态系统类型与土地覆被类型在空间分布上的空间相似性和一致性特征,并结合土地覆被现状及其各类型的空间分布比率量化因子的基础上,综合考虑交通密度、人口密度、人均GDP等人文要素,以及京津冀地区协同发展规划、基本农田保护、自然保护区等政策措施对土地覆被变化的驱动和影响作用,对自然要素和人文要素共同驱动下的土地覆被情景曲面建模(Scenario of Surface Modelling in Land Cover, SSMLC)方法进行构建.该方法主要包括以下3个关键技术步骤. ...
Changes of major terrestrial ecosystems in China since 1960
2
2005
... 基于年平均生物温度、年平均降水和潜在蒸散比率等关键气候参数,运用自然植被生态系统HLZ(Holdridge life zone)改进模型[43, 47-48],分别实现京津冀地区3种情景SSP1-2.6、SSP2-4.5和SSP5-8.5下1 km×1 km分辨率的2020年、2040年、2070年和2100年4个时段的自然植被生态系统的未来变化情景.在此基础上,深入分析和定量揭示自然植被生态系统类型与土地覆被类型在空间分布上的空间相似性和一致性特征,并结合土地覆被现状及其各类型的空间分布比率量化因子的基础上,综合考虑交通密度、人口密度、人均GDP等人文要素,以及京津冀地区协同发展规划、基本农田保护、自然保护区等政策措施对土地覆被变化的驱动和影响作用,对自然要素和人文要素共同驱动下的土地覆被情景曲面建模(Scenario of Surface Modelling in Land Cover, SSMLC)方法进行构建.该方法主要包括以下3个关键技术步骤. ...


