

1 引言
生态空间即生态系统所占据的物理空间、其代谢所依赖的区域腹地空间及其功能所涉多维关系空间[1],承载着满足人类供给、调节、支持、文化等需求[2]。城市生态空间是城市内部及周边提供生态系统服务的地表植被及水体等绿色和蓝色空间[3,4,5],具有缓解城市热岛效应、改善大气与水环境质量、提供休闲娱乐场所等功能[6],对于保障城市生态安全、提升居民生活质量、保障城市健康发展具有重要作用[7]。已有研究聚焦城市生态用地需求规模测算、城市生态空间类型识别[8],生态空间时空变化特征分析、生态空间占用的人类足迹[7, 9-10],结构与服务功能及价值评估[5, 11-13],优化与提升、分区与管控[1, 14]等方面。在单个城市或城市群、中国尺度都开展了生态空间时空变化分析[6, 9-11],并得出生态空间演变过程表现出一定的区域差异和梯度效应,不同区域生态空间变化发生的拐点时间有所不同[10]。
人口快速增长和经济社会快速发展、城乡建设用地不断扩展[15],极大地改变了陆地表层覆盖与生态系统结构[16,17],生态空间被人类活动相关的生产和生活空间大量挤占[18]、生态空间质量不断下降[10],污染加剧、生态退化、资源短缺[19],严重威胁可持续发展和居民生活质量[20]。特别是城市群地区,作为推动国家重大区域战略与区域板块之间融合互动发展的载体[21],集中了中国45%的城镇人口、50%经济总量和60%的外资[21],但同时也集中了中国75%以上的污染产出[22]。城市群生态空间格局变化影响城市群地区生态环境状况,迅速推进的城市化进程使得城市热岛、水污染、大气污染、城市内涝等大量问题不断发生[9, 23-25],成为制约城市群健康发展的重要因素[26,27,28]。
城市群地区生态承载力,是其生态空间提供生态服务、预防生态问题、保障生态安全的能力[29],是生态系统结构、过程及其空间格局决定的生态系统服务所能支撑的具有一定发展水平的人口和经济规模[30],是判断该区域经济社会活动与生态系统协调与否的基础工具[31]。生态承载力评估多采用生态足迹[32]、状态空间[33]、系统模型[34]、生产力消耗[35]、生态系统服务消耗[30]等方法,从定性描述发展到定量分析和机理研究[36],已应用于长株潭、闽三角、长江中游等城市群的生态承载力研究[32,33,34]。基本原理都是利用供需比从供给规模、需求规模上权衡以反映一定空间范围内服务供给与人口需求匹配状况的供需匹配性[37]。目前,难以定量化表征生态系统的供给容纳能力、人类活动与生态系统的相互作用关系,未体现不同区域的生态需求等原因,导致生态承载力评估缺乏针对性并存在极大不确定性[31]。
生态空间的数量、布局、承载能力对于改善城市环境、提供宜居和休闲空间、保障城市生态安全等均具有重要意义。但是,城市生产、生活、生态不同空间在规模配比、空间配置、功能融合等方面的不尽协调问题,严重损害城市发展的系统性、宜居性和可持续性[38]。只有在一定的资源承载力和环境容量支持条件下的生态空间[1]才能成为城市群地区可持续发展的基础,特别是随着人居环境质量关注度的提升[39],人对城市生态空间的感知效益越来越受到重视[7, 40]。因此,依据生态承载力及承载状态、合理优化配置生态空间是统筹解决城镇化与生态保护矛盾的重要途径[11, 41]。然而,已开展的城市群生态承载研究多从供给入手,较少考虑调节和文化方面,难以体现不同城市群生态空间的实际功能,较少开展生态空间模式及阶段演化过程的对比分析。
特大城市群地区既是新型城镇化和经济发展的主体区和核心区,又是生态问题高度集中的敏感区和重灾区[21],城市群的发展需要注重生态环境保护和修复,以达到“生产空间集约高效、生活空间宜居适度、生态空间山清水秀”的可持续发展目标[2, 42]。故而,1978年改革开放以来,中国主要城市群地区生态空间存在何种时空变化规律?生态空间受城镇扩张影响及其区域差异如何?如何从需求的角度衡量城市群地区生态空间的承载水平及其状态?生态空间时空变化对生态承载水平有何影响?这些问题亟需深入研究。本文以京津冀、长江三角洲、粤港澳大湾区、成渝、长江中游这5个国家级特大城市群为研究区,参考生态足迹与生态承载力的评估方法改进了生态承载力供需平衡模型以解决前述不足之处,系统开展了生态空间时空变化、城镇扩张占用生态空间以及生态空间承载水平变化的对比分析,评估了1990—2020年生态承载状态变化的限制因素,为生态文明建设背景下城市群空间结构优化和配置、可持续发展提供科学依据。
2 数据与方法
2.1 研究区概况
京津冀城市群以中国7.3%的人口和2.4%的国土面积产生了10.3%的GDP[43],快速城镇化导致水资源短缺、生态系统退化日益严重[44,45]。长三角城市群以中国11.0%的人口和2.2%的面积产生了18.5%的GDP[46],然而资源紧张、环境污染、生态质量持续下降。粤港澳大湾区以中国5.1%的人口和0.6%的面积产生了12.5%的GDP[47],引起物种多样性降低、洪涝规模增大[48]。成渝城市群以中国6.7%的人口和1.9%的面积产生了5.5%的GDP[49],然而资源利用率低、生态系统退化、自然灾害频发。长江中游城市群以中国8.8%的人口和3.3%的面积产生了8.8%的GDP[50],水资源短缺、土壤污染和水土流失严重[33]。
图1
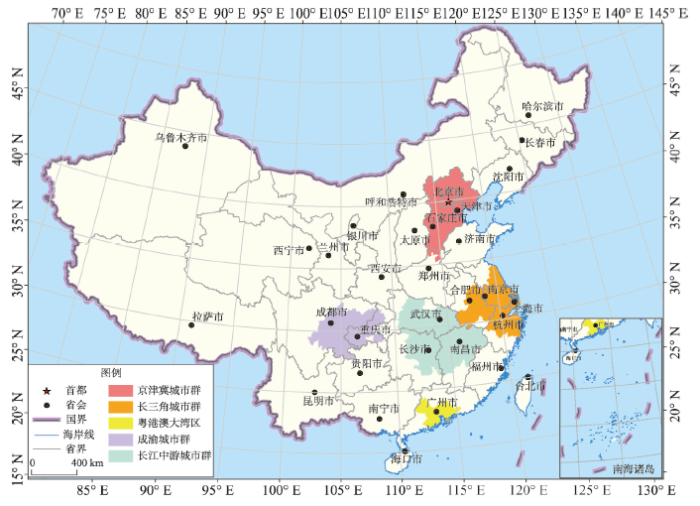
图1
中国国家级特大城市群地区的空间分布
注:基于自然资源部标准地图服务网站审图号为GS(2016)1600号的标准地图制作,底图边界无修改。
Fig. 1
Distribution of five mega-urban agglomerations in China
2.2 数据来源与处理
土地利用数据:城市群地区2020年土地利用现状数据和1990—2000年、2000—2010年、2010—2020年土地利用变化数据源于中国科学院资源环境数据中心(
区域统计数据:从5个城市群地区的各市县统计年鉴、水资源公报等公开数据库收集了县/市域人口数量、地表水资源量、用水量(生活、生产、生态)、污水排放量、二氧化硫排放量等数据。
气象观测数据:基于国家气象科学数据共享平台(
遥感反演数据:MODIS NDVI数据(MOD13Q1)(
表1 城市群所涉及省域的区域水资源产量因子
Tab. 1
| 地区 | 北京 | 天津 | 河北 | 河南 | 上海 | 江苏 | 浙江 | 安徽 | 广东 | 重庆 | 四川 | 湖北 | 江西 | 湖南 |
|---|---|---|---|---|---|---|---|---|---|---|---|---|---|---|
| 产量因子 | 0.77 | 0.41 | 0.40 | 0.78 | 1.39 | 1.02 | 2.81 | 1.54 | 3.21 | 2.04 | 1.76 | 1.68 | 2.71 | 2.45 |
2.3 研究方法
式中:W为与裸地相比得到的森林、草地和有植被湿地涵养水分的增加量(m3);A为森林、草地和有植被湿地面积(hm2);Pr为产流降水量(mm);R为与裸地相比生态系统减少径流的效益系数,根据植被覆盖度计算[65];P为年均降水量(mm);K为产流降水量占降水总量的比例。
生态空间中可消纳废水的主体为湿地[66],比如沼泽湿地减缓废水污水流速以沉淀和排除有毒物质,或湿地植物吸收废水中的有毒物质以净化水质;可吸收大气污染物的主体为森林[67],森林吸收SO2、氮氧化物等有害气体,且有阻滞粉尘的作用[60];可提供休闲游憩的主体为森林、草地、水体与湿地等绿色和蓝色空间[68],即涵盖了城市公园、生态风景区、公共绿地的城市游憩空间,其功能评价及布局配置等也是当前研究热点[37, 59, 68]。城市群地区人类对生态系统服务需求的量化采用如下指标和方法:水资源需求源于生活、生产、生态用水,利用区域用水量表示;水质调节需求源于排放的污水,利用生活和生产污水排放量表示;空气质量调节需求源于排放的大气污染气体,本文中仅利用工业SO2排放量表示[60];休闲游憩功能已有研究侧重功能类型及空间分布,方法多为对公园、风景区等游憩空间点进行样本调查,本文对于休闲游憩的需求基于人口数量和国家生态园林城市标准人均绿地面积(11 m2/人)进行量化。
式中:ECSIi是第i类生态服务的生态承载状态指数;EFi是生态足迹(hm2);ECCi是生态承载力(hm2)。
水资源承载指数:将区域用水量(W)转化为水资源用地面积计算水资源生态足迹(EFwr),将水资源供给量(WR)转化为水资源用地面积计算水资源生态承载力(ECCwr),即:
水质调节承载指数:利用区域污水排放量(Cwc)消纳所需湿地面积计算水质调节生态足迹(EFwc),将湿地水源涵养量(WRw)转化为水资源用地面积计算水质调节承载力(ECCwc),即:
式中:pwc为单位面积水域对污水的平均消纳量(取值为365 t/hm2 [76])。
空气质量调节承载指数:利用吸收区域SO2排放量(
式中:paq为森林对SO2的平均吸收能力(取值为88.65 kg/hm2 [77])。
休闲游憩生态承载计算:区域人口数(N)所需绿地面积即休闲游憩生态足迹(EFr),区域生态空间面积即休闲游憩生态承载力(ECCr)。
表2 生态承载状态分级
Tab. 2
| 生态系统服务项 | 生态承载状态及阈值 | ||||
|---|---|---|---|---|---|
| 非常盈余 | 盈余 | 平衡 | 超载 | 严重超载 | |
| 水资源供给 | 0~0.4 | 0.4~0.8 | 0.8~1.2 | 1.2~5 | >5 |
| 水质调节 | 0~0.4 | 0.4~0.8 | 0.8~1.2 | 1.2~5 | >5 |
| 空气质量调节 | 0~0.2 | 0.2~0.5 | 0.5~1.5 | 1.5~10 | >10 |
| 休闲游憩 | 0~0.4 | 0.4~0.8 | 0.8~1.2 | 1.2~10 | >10 |
3 结果与分析
3.1 特大城市群三生空间结构分布特征
从三生空间面积结构、生活空间扩展演变模式以及生态空间结构类型三个方面分析特大城市群空间结构分布特征。2020年,从“生态—生产—生活”空间面积结构比来看(表3),京津冀和长三角为4∶5∶1,成渝约为3∶6∶1,生产空间占比最高,其中成渝为59.7%,生态空间面积占比约为36.4%;粤港澳约为6∶2∶2,长江中游约为6∶3∶1,生态空间占比最高,分别达到了63.3%和60.0%。生活空间面积占比最大的是粤港澳、长三角和京津冀,分别为14.8%、14.0%和13.2%,成渝和长江中游较小,约为3.9%和4.5%。
表3 2020年中国特大城市群生态、生产、生活空间面积统计
Tab. 3
| 类别 | 统计指标 | 京津冀 | 长三角 | 粤港澳 | 成渝 | 长江中游 |
|---|---|---|---|---|---|---|
| 生态空间 | 面积(106 hm2) | 9.04 | 8.47 | 3.49 | 7.02 | 20.96 |
| 面积占比(%) | 40.54 | 40.16 | 63.33 | 36.38 | 59.96 | |
| 生产空间 | 面积(106 hm2) | 10.33 | 9.68 | 1.20 | 11.53 | 12.42 |
| 面积占比(%) | 46.31 | 45.87 | 21.83 | 59.74 | 35.53 | |
| 生活空间 | 面积(106 hm2) | 2.93 | 2.95 | 0.82 | 0.75 | 1.58 |
| 面积占比(%) | 13.15 | 13.97 | 14.84 | 3.88 | 4.51 |
参考城市群形成发育规律[79],从生活空间结构分布特征来看,除成渝是双中心组合以外,其余4个特大城市群以多中心组合为主,而从生活空间拓展演变规律来看,城市群空间拓展遵循由“煮蛋”(多蛋独煮、立体生长、互不干扰)—“摊蛋”(多蛋平摊、平面延展、空间冲突)—“炒蛋”(多蛋共炒、功能重塑、分工重组)的“蛋型”演变规律,形成多个城市有机联系、相互依存、相互促进的有机融合体[80],其中长江中游是“煮蛋”模式(图2e),成渝为“摊蛋”模式(图2d),而京津冀、长三角、粤港澳则是炒蛋模式(图2a、2b、2c)。特大城市群的生态空间结构分布特征亦不相同,京津冀(北部、西部)和长三角(南部)呈现屏障式生态空间,另外3个城市群为包围式,区别在于粤港澳是紧密包围式、成渝是离散包围式而长江中游为全包围式。
图2
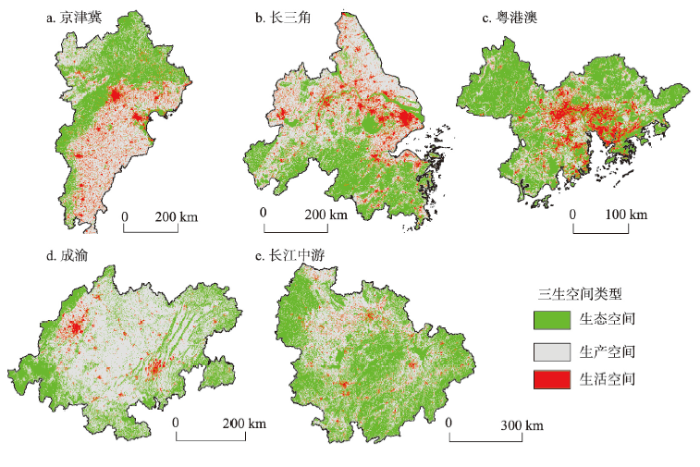
图2
2020年特大城市群生态、生产、生活空间分布
Fig. 2
Distribution of ecological-production-living space in mega-urban agglomerations, 2020
3.2 特大城市群生态空间时空变化分异
1990—2020年5个特大城市群生活空间面积皆持续大幅度增加、生产空间面积皆持续大幅度减少,导致生态空间面积变化存在差异(图3)。除粤港澳外,其他城市群生态空间多呈现增加态势,且2010—2020年增势明显。其中,京津冀1990—2010年持续减少、2010—2020年大幅增加,长三角和长江中游持续大幅度增加,粤港澳1990—2000年微增而2000—2020年持续减少,成渝1990—2000年微减而2000—2020年增加。30年间,特大城市群生活空间的增加主要源于挤占生产空间,但生活空间挤占生态空间的比例在逐渐增加。1990—2000年生活空间挤占生态空间比例较小,2000—2010年减少的生态空间超过一半被生活空间挤占,2010—2020年,生态空间的减少基本为生活空间占用(表4)。
图3
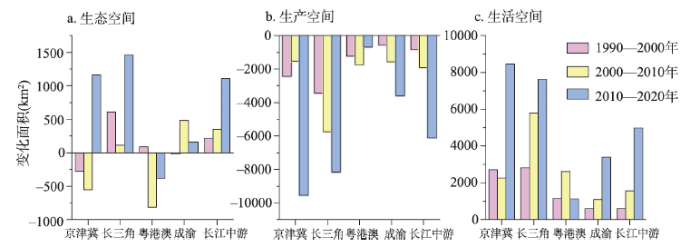
图3
1990—2020年特大城市群生态、生产、生活空间面积变化统计
Fig. 3
The area changes of ecological-production-living space in mega-urban agglomerations, 1990-2020
表4 1990—2020年特大城市群生态空间变化统计
Tab. 4
| 时段 | 统计指标 | 京津冀 | 长三角 | 粤港澳 | 成渝 | 长江中游 | |
|---|---|---|---|---|---|---|---|
| 1990—2000年 | 生态空间面积变化(hm2) | -27799 | 60925 | 8806 | -2235 | 21633 | |
| 面积变化比例(%) | -0.12 | 0.29 | 0.17 | -0.01 | 0.06 | ||
| 生态空间增加的县域占比(%) | 31.75 | 62.80 | 42.86 | 39.58 | 47.60 | ||
| 生态空间不变的县域占比(%) | 25.12 | 7.25 | 2.04 | 6.25 | 0.00 | ||
| 生态空间减少的县域占比(%) | 43.13 | 29.95 | 55.10 | 54.17 | 52.40 | ||
| 生活空间挤占生态空间面积(hm2) | 27775 | 15998 | 43675 | 2346 | 17425 | ||
| 生活空间挤占生态空间比例(%) | 32.96 | 24.06 | 72.22 | 13.11 | 23.66 | ||
| 生活空间挤占生态空间各比例范围,城市群县域的数量占比(%) | ≥ 90 | 6.64 | 16.43 | 34.69 | 11.11 | 8.30 | |
| 50~90 | 12.32 | 17.39 | 24.49 | 9.72 | 17.03 | ||
| <50 | 43.60 | 41.06 | 36.73 | 66.67 | 74.24 | ||
| 无占用 | 37.44 | 25.12 | 4.08 | 12.50 | 0.44 | ||
| 2000—2010年 | 生态空间面积变化(hm2) | -55291 | 10889 | -81350 | 48152 | 34822 | |
| 面积变化比例(%) | -0.28 | 0.02 | -1.55 | 0.25 | 0.10 | ||
| 生态空间增加的县域占比(%) | 23.70 | 39.61 | 20.41 | 74.31 | 58.08 | ||
| 生态空间不变的县域占比(%) | 26.07 | 4.35 | 2.04 | 2.78 | 0.44 | ||
| 生态空间减少的县域占比(%) | 50.24 | 56.04 | 77.55 | 22.92 | 41.48 | ||
| 生活空间挤占生态空间面积(hm2) | 43500 | 49811 | 116735 | 7754 | 50685 | ||
| 生活空间挤占生态空间比例(%) | 53.45 | 63.46 | 99.03 | 69.37 | 60.46 | ||
| 生活空间挤占生态空间各比例范围,城市群县域的数量占比(%) | ≥ 90 | 38.86 | 52.17 | 97.96 | 70.83 | 50.66 | |
| 50~90 | 10.90 | 21.74 | 0.00 | 5.56 | 22.27 | ||
| <50 | 12.80 | 19.32 | 0.00 | 6.25 | 24.45 | ||
| 无占用 | 37.44 | 6.76 | 2.04 | 17.36 | 2.62 | ||
| 2010—2020年 | 生态空间面积变化(hm2) | 115946 | 146102 | -38333 | 16079 | 110911 | |
| 面积变化比例(%) | 0.50 | 0.52 | -0.76 | 0.09 | 0.32 | ||
| 生态空间增加的县域占比(%) | 52.61 | 68.12 | 48.98 | 77.78 | 66.81 | ||
| 生态空间不变的县域占比(%) | 2.84 | 0.97 | 0.00 | 0.00 | 0.00 | ||
| 生态空间减少的县域占比(%) | 44.55 | 30.92 | 51.02 | 22.22 | 33.19 | ||
| 生活空间挤占生态空间面积(hm2) | 12756 | 39322 | 25037 | 13551 | 101289 | ||
| 生活空间挤占生态空间比例(%) | 83.38 | 79.08 | 96.65 | 93.26 | 95.67 | ||
| 生活空间挤占生态空间各比例范围,城市群县域的数量占比(%) | ≥ 90 | 42.65 | 71.01 | 81.63 | 81.94 | 82.10 | |
| 50~90 | 4.74 | 8.21 | 10.20 | 4.86 | 12.66 | ||
| <50 | 3.32 | 6.76 | 0.00 | 4.17 | 1.75 | ||
| 无占用 | 49.29 | 14.01 | 8.16 | 9.03 | 3.49 | ||
图4
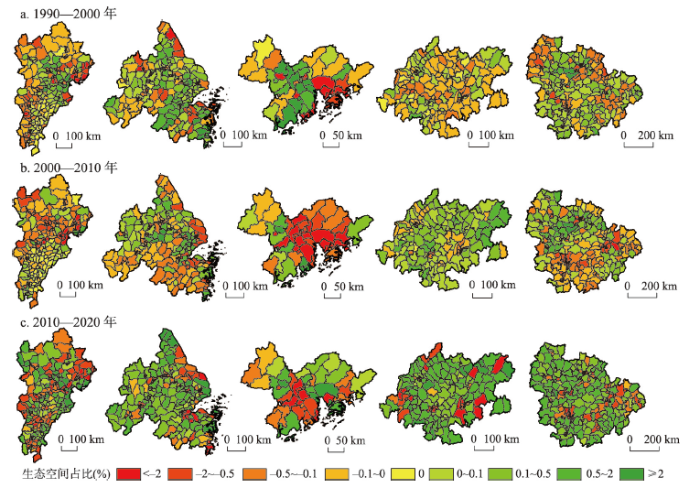
图4
特大城市群县域尺度生态空间面积占比变化
Fig. 4
The proportion changes of ecological space at county scale in mega-urban agglomerations
图5
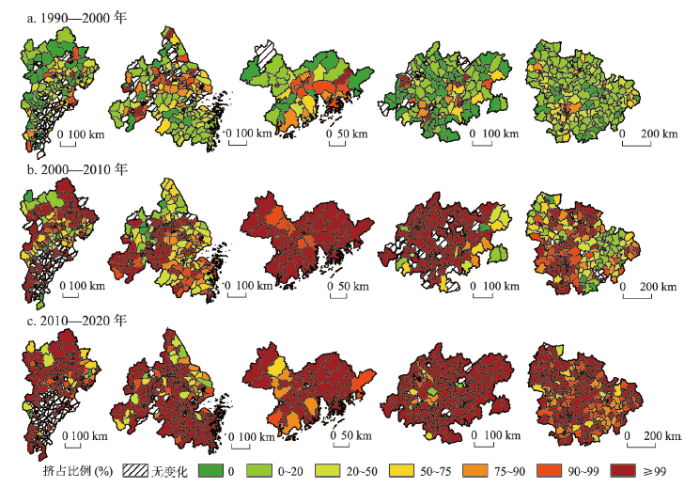
图5
特大城市群县域尺度生活空间挤占生态空间比例
Fig. 5
The proportion of ecological space occupied by living space in mega-urban agglomerations
3.3 生态空间生态承载状态时空变化特征
从生态空间综合承载现状来看(图6e),特大城市群地区的96个市域中,约78.1%市域处于超载或严重超载状态,其中,京津冀、长三角、粤港澳、成渝和长江中游城市群分别有78.6%、73.1%、54.5%、56.3%和25.8%的市域表现为严重超载,主要分布在京津冀东部和南部、长三角东部和北部、成渝中西部以及粤港澳的珠江口;仅6.2%的市域呈现盈余或非常盈余的状态,即长江中游南昌城市圈和粤港澳的肇庆;15.6%市域表现为平衡状态,以长三角东南、长江中游为主。分析单项承载状态,水资源承载状态在约70.8%市域呈现超载或严重超载状态、18.8%市域呈现盈余或非常盈余状态(图6a);水质调节承载状态在59.4%市域超载或严重超载、13.6%表现为盈余或非常盈余(图6b);空气质量调节承载状态在34.4%市域超载或严重超载、45.8%市域盈余或非常盈余(图6c);休闲游憩服务承载状态在57.3%市域超载或严重超载、30.2%市域盈余或非常盈余。
图6
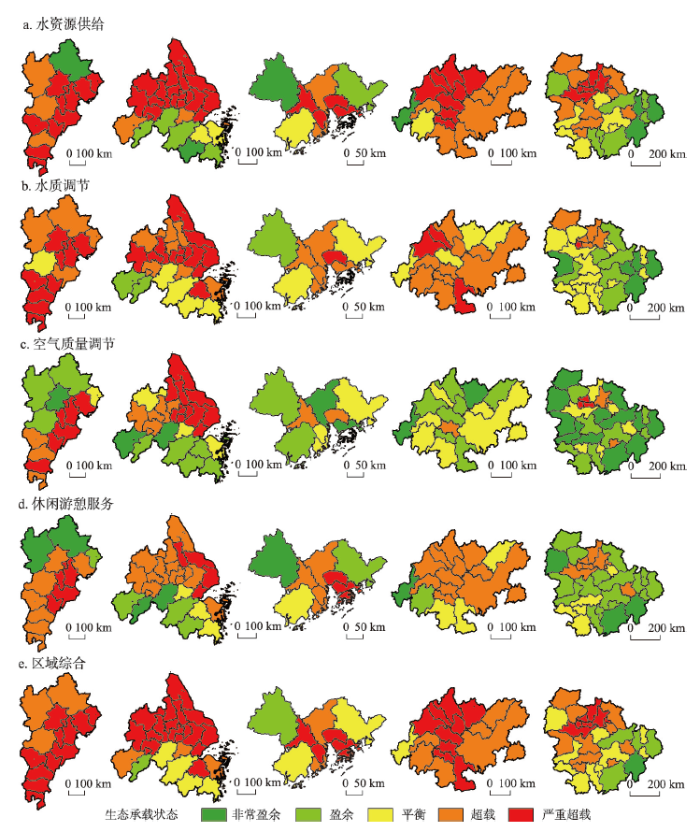
图6
特大城市群生态空间生态承载状态现状空间分布
Fig. 6
Distribution of ecological carrying capacity of ecological space in mega-urban agglomerations
1990—2020年各城市群地区生态空间综合承载状态在71.9%市域维持超载不变,7.3%市域的超载状态趋于缓和甚至转为盈余,4.2%市域超载状态加重,特别是粤港澳东南部、成渝北部(图7e)。从单项生态承载状态来看,水资源供给承载在62.5%市域保持原有超载状态不变,在成渝北部和南部等5.2%市域的超载状态升级,而在京津冀中部、粤港澳等约6.3%市域的超载状态趋于缓和(图7a)。水质调节承载在37.5%市域维持超载不变,长江中游西南部等15.6%市域的超载状态趋于缓和,14.6%市域由盈余或平衡趋向超载或严重超载(图7b)。空气质量调节承载在京津冀西南部、成渝东部和南部、长江中游北部等27.1%市域的超载状态趋于缓和,京津冀中西部、长三角东南部、成渝北部以及长江中游中部等35.4%市域承载状态由超载或平衡变为盈余(图7c)。休闲游憩服务承载在47.9%市域维持超载不变,26.0%市域维持盈余不变,8.3%市域超载状态加重,主要分布于京津冀天津、保定,粤港澳东南部以及成渝重庆等地,而超载状态缓解和盈余状态好转的市域极少,仅占1.0%(图7d)。
图7
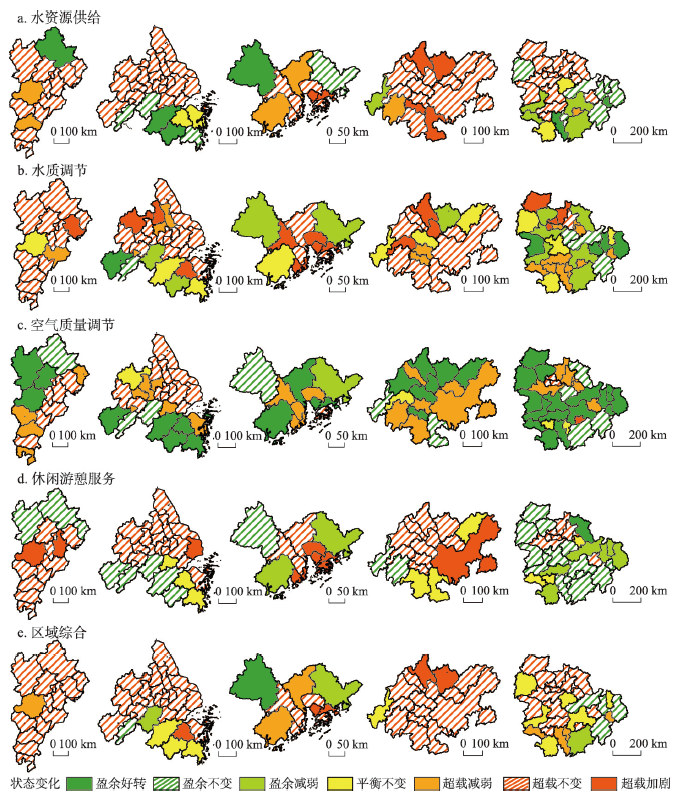
图7
1990—2020年特大城市群生态空间生态承载状态变化的空间分布
Fig. 7
Distribution of the change of ecological carrying capacity in mega-urban agglomerations in 1990-2020
4 结论与讨论
4.1 结论
本文系统分析了1990—2020年京津冀、长三角、粤港澳大湾区、成渝、长江中游特大城市群的三生空间特别是生态空间时空变化过程,并探讨了水资源供给、水质调节、空气质量调节和休闲游憩等生态承载水平变化差异。结果显示5个特大城市群三生空间结构差异显著,呈现4种“生态—生产—生活”空间面积结构比、3种以多中心组合为主的生活空间拓展演变模式,以及4种生态空间结构类型。1990—2020年特大城市群生活空间面积皆持续大幅度增加、生产空间面积皆持续大幅度减少,而生态空间面积变化差异明显,除粤港澳外,城市群均表现出生态空间增加态势,且2010—2020年增势明显。1990—2000年、2000—2010年、2010—2020年生活空间挤占生态空间比例逐渐增加,反映了特大城市群的生产、生态空间功能从供给转向调节和文化。5个城市群分别有78.6%、73.1%、54.5%、56.3%和25.8%市域综合生态承载状态呈现为严重超载,其中水资源供给和水质调节是制约城市群生态承载水平的要因。
4.2 讨论
与已有研究对比可以看出,采用综合评价指标体系法评估长江中游生态承载力得到水资源供给和污染生态承载状态结果与本文基本一致[33];采用水量平衡方程计算京津冀重点生态功能区水源涵养量[29],由于评估方法不同,评估结果与本文存在差异;长三角4个典型城市生态足迹研究表明人均生态足迹和生态压力指数均呈现上升趋势,表明人类活动对自然生态系统压力在增大,可持续发展状况并不乐观[81],这与本文结果呼应。本文存在几个方面的不确定性:① 本文从宏观角度进行了三生空间划分,并未考虑土地的多功能性,基于土地利用类型的面积估算仅考虑水平差异、未考虑垂直结构,同时,受限于数据空间分辨率也未考虑城市群内部生态空间,有待更精细尺度的深入研究。② 利用水资源供给、空气质量、水质和休闲游憩服务的生态承载指数评价其生态承载水平是否超载或盈余,未考虑生物物理和生物化学过程方面的相互关系、生态系统结构与功能组合差异,也未考虑生态服务的区域间流动和不同人群对于生态空间的需求。③ 空气质量调节只考虑SO2吸收,未纳入其他污染物,湿地的水质净化功能在不同区域因地形、景观格局、水深水流、温度、降雨、污染浓度等因素的影响而表现不同,尚需深入开展多维度、多组合、多功能的生态承载力评估。④ 现阶段看来,生态系统功能及其潜在服务的测算方法是合理的,但其局限于采用行政区域的供需关系而未考虑供需端的流动特征及其受益范围差异。
特大城市群是中国经济发展的战略核心区和新型城镇化的主体区[21],城镇化水平高、经济规模大,综合实力强,未来发展仍然要以经济建设为主,但在城镇化过程中也要兼顾生态环境的保护,加强空间管控、优化空间布局。生态空间作为城市群地区生态系统服务的主要提供者,必须尊重在自然规律和供需平衡的原则下,推进生态建设的一体化和景观生态结构的同构同建,实现共享自然环境的生态共建共享目标[82]。开展生态空间生态承载状态的分项与综合评估,有助于我们了解城市群地区生态承载的限制因素,对于超载甚至严重超载的市域,在城镇提质增效过程中需要着重考虑限制因素的影响,有的放矢规划和布局生态空间,以绿色、低碳、宜居为目标,走中国特色的生态、绿色、可持续城镇化道路[83]。
参考文献
Urban eco-complex and eco-space management
DOI:10.1016/j.chnaes.2013.09.003 URL [本文引用: 3]
城市复合生态及生态空间管理
Quantitative function identification and analysis of urban ecological-production-living spaces
DOI:10.11821/dlxb201601004
[本文引用: 2]

The identifying of land multifunctionality is a basic tool for organization, coordination and configuration of urban land, and is a key criterion for urban land functions forms, composite pattern and dynamic tradeoffs. This topic is of important theoretical and practical significance. An available identification system of urban land multifunctionality, however, had not been built for a long time. This paper develops a function classification system for urban ecological-production-living spaces from an integrated perspective of land function, ecosystem services and landscape function. We integrated a value function group of space function based on ecosystem services valuation. A comparison method of vertical and cross direction is proposed to identify dominant function type of urban land. The empirical results show that in the study area, function classification system of urban ecological-production-living spaces can reflect differentiated function types of different land use classes. The identified result of dominant function for urban space is matched with the functions of different land types. Meanwhile, we also found that there are some problems on urban land use, such as the low adjacency degree with different spaces, and poor complementarity with different space functions. The result indicates that the spatial distribution of urban ecological-production-living spaces is congregated in the study area.
城市生态—生产—生活空间功能定量识别与分析
Progress and prospect of research on urban ecological space
DOI:10.18306/dlkxjz.2017.02.007
[本文引用: 1]
Urban ecological space is a main part of urban space, which is the interdisciplinary research topic in the urban planning, ecology and geography domain. Based on the analysis of literature related to urban ecological space(UES) home and abroad, the paper defined the urban ecological space and summarized the advance and limitations of domestic studies, pointed out that the foreign studies made important progresses in the effects of UES on residents' well-being and its mechanism, the UES perception, use behaviors and its influencing factors, economic and socio-cultural impacts of UES, UES governance methods and principles, UES pattern and optimization guided by social justice concept. In addition, humanistic approaches were applied widely. Accordingly, the paper proposed that future researches should focus on residents' well-being and pay more attention to social-ecological interaction and its mechanism, and the governance of public available UES, promote UES pattern and planning research guided by the concept of justice. At the same time, the application of multidisciplinary cross methods (such as humanism and behaviorism methods) should be strengthened.
城市生态空间研究进展与展望
Reduction of disparities in access to green spaces: Their geographic insertion and recreational functions matter
DOI:10.1016/j.apgeog.2015.11.008 URL [本文引用: 1]
Research advance in ecosystem service of urban green space
In this paper, the concept and connotation of urban green space and ecosystem service were expatiated, and the research advance in ecosystem service of urban green space was reviewed. The studies of ecosystem service of urban green space in overseas were focused on improving the quality of urban environment, maintaining biodiversity, providing amenity values, and ecosystem management; while in China, they were focused on the structure and function of urban green space, green quantity and quality, green equivalent, indicator system evaluation, value assessment, and application of CITYgreen model. The shortages and prospects of the researches on ecosystem service of urban green space were put forward.
城市绿色空间生态服务功能研究进展
Ecological protection in urbanization distinct: A case study of Nanjing city, Jiangsu province
城市化地区生态防护研究: 以江苏省、南京市为例
Research on the improvement of urban ecological space service base on landsenses ecology: A case study in Shunyi District, Beijing
基于景感生态学的城市生态空间服务提升研究: 以北京市顺义区为例
Research progress and prospect on measuring urban ecological land demand
DOI:10.11821/dlxb201502013
[本文引用: 1]
As a fundamental supplying carrier of natural ecosystem services in urban areas, ecological land couples human social development and natural ecological succession based on the inherent correlation between land use and land cover. Thus spatial optimization of ecological land has gradually become a vital and comprehensive approach to address the conflicts between urban development and ecological conservation. The measurement of urban ecological land demand can directly determine the equilibrium between supply and demand for ecological land, which is a significant step in overall planning and management of urban ecological land. After a systematic review of the concept of ecological land, the similarities and differences between ecological demands and ecological land demands are discussed in this paper. Then a conceptual space-function framework for measuring urban ecological land demand is proposed. Within this framework methodologies of measuring urban ecological land fall into three categories, namely experimental predication, ecosystem services and spatial patterns. In details, the category of experimental predication includes legal quota and historical trend methods. The methods of ecological footprint and carbon-oxygen equilibrium belong to the category of ecosystem services, while the method of ecological security pattern is included in the spatial patterns category. By methodological principles analysis, the advantages and disadvantages of these methods are comparatively discussed and summarized in terms of comprehensiveness, representativeness, threshold and area, and location. Finally, four key directions of future research are presented: urban ecological land classification related to ecological functions, comprehensive efficiency measurement on urban ecological land focusing on spatial patterns of ecological land, functional tradeoff of urban ecological land using multi-target scenarios, and urban ecological hinterland recognition based on ecological land supply-demand balance analysis.
城市生态用地需求测算研究进展与展望
Relationship between change of ecological spatial pattern and land surface temperature in Beijing-Tianjin-Hebei urban agglomeration
京津冀城市群生态空间格局变化与地表温度关系研究
Pattern and gradient effects of ecological space changes in China since 1990s
20世纪90年代以来中国生态空间演化的时空格局和梯度效应
Spatial structure of urban ecological land and its dynamic development of ecosystem services: A case study in Changzhou City, China
城市生态用地的空间结构及其生态系统服务动态演变: 以常州市为例
Dynamic indicator system for measurement of spatial pattern in landscape ecology
景观生态空间格局动态度量指标体系
Value evaluation of urban natural ecological space and planning implications
城市自然生态空间的价值评估及规划启示
Remote sensing-based analysis of the spatiotemporal characteristics of built-up area across China based on the Plan for Major Function-oriented Zones
基于主体功能区规划的中国城乡建设用地扩张时空特征遥感分析
Spatio-temporal dynamics of ecosystem service value in Wuhan urban agglomeration
Based on the land use vector data of Wuhan Urban Agglomeration in the years 1990, 2000 and 2009, this paper used Costanza' s evaluation formula to estimate the ecosystem service value (ESV) of the study area according to "equivalent value per unit area of ecosystem services in China" and analyze its spatio-temporal characteristics. Then the correlation analysis was applied to explore the association between the ESV evolution and the land use changes. The results showed that due to the substantial growth of water area, the ESV of Wuhan Urban Agglomeration increased by 9.5% during the study period, which showed an overall rising trend. The ESV of water regulation and waste treatment increased obviously. Furthermore, the ESV changes showed obvious regional differences, which were most significant in Xiantao, Xinzhou and Yunmeng. The ESV was higher in the southeast and lower in the northwest. Over time, a Wuhan-centered "low-high-low" hierarchically distributed structure of ESV was formed in the eastern, western and northern parts. The ecologic dominance of the northern mountainous and hilly region was gradually abated, while a structural expansion with a high-ESV cluster had taken place in the southern part of the region in 2009. During the research period, the temporal change of ESV in Wuhan Urban Agglomeration was positively correlated with the area changes of forestland, water, grassland and cultivated land. However, the spatially balanced distribution of ESV was negatively correlated with the dispersion degrees of the cultivated land and unused land.
武汉城市圈生态系统服务价值时空变化特征
Application of ecosystem service value in land use change research: Bottlenecks and prospects
In recent years, the application of ecosystem service value in land use change research is a hot topic in many famous international journals. However, policy makers are seldom taking into account the achievements of the related studies in practice. This paper summarized the three main bottlenecks in applying ecosystem service value in land management practices, i. e., the difficulty in measuring the service values, the complexity of driving factors, and the bias of evaluation criteria. Some solutions on the bottlenecks were provided, and the future research directions in China were prospected. It was suggested that in the studies of land use change based on ecosystem service value, it would be more appropriate to adopt comparative analysis method in small scale case studies, especially focusing on the natural ecological resources and the excessive loss of their values.
生态系统服务价值在土地利用变化研究中的应用: 瓶颈和展望
Ecosystem service values and spatial differentiation changes during urbanization: A case study of Huanghua city
城镇化过程中生态系统服务价值变化及人类活动影响的空间分异: 以黄骅市为例
Several viewpoints on the background of compiling the "National New Urbanization Planning (2014-2020)"
DOI:10.11821/dlxb201502001
[本文引用: 1]
The "National New Urbanization Planning (2014-2020)" (hereinafter referred to as "Planning") marks a significant transformation in China's urbanization development process, with the core of human urbanization, and the general requirement of seeking advance in stability. This paper elaborates the authors' preliminary thoughts on the formation of the "Planning" mainly from the speed and quality aspects of the urbanization development. Urbanization level should be consistent with industrial restructuring, the amount of new jobs, the actual ability of absorbing rural population, and water-soil resource and environment capacity of the urban area, etc. The large scale and high speed urbanization development in China has resulted in severe environment pollution, great pressures on the infrastructure, and huge challenge to the supporting capacity of natural resources. Urbanization is an important frontier scientific issue with obvious cross disciplinary feature, which is also a complex system. The interdisciplinary human economic geography has outstanding advantages and solid research foundation in the field of urbanization research. Therefore, facing the significant realistic demand of the national new urbanization, we should do some in-depth research and tracking studies in this field.
关于“国家新型城镇化规划(2014—2020)”编制大背景的几点认识
Ecological baseline for Beijing's urban sprawl: Basic ecosystem services and their security patterns
北京城市扩张的生态底线: 基本生态系统服务及其安全格局
Theoretical analysis of interactive coupled effects between urbanization and eco-environment in mega-urban agglomerations
DOI:10.11821/dlxb201604001
[本文引用: 4]
Mega- urban agglomerations in China play a vital role in both national economic development strategies and national new-type urbanization, and undertake important historical responsibility with the world economic center transfer to China. However, they suffer a series of increasingly serious eco- environmental problems in the process of development. Thus,studies on the interactive coupled effects between urbanization and eco-environment in megaurban agglomerations are the frontier areas and high priority tasks in the earth system science for the future ten years. This paper analyses the basic theory frame of the interactive coupled effects between urbanization and eco- environment in mega- urban agglomerations systematically. In theoretical aspect, based on the nonlinear relationship and coupling characteristics of the natural and human elements in mega- urban agglomerations system, we could estimate the interactive coercing intensity, nearcoupling and telecoupling mechanism ofthe inside and outside mega-urban agglomerations system after scientific identification of the key elements, and then form the basic interactive coupling theory. Moreover, we could build a spatio- temporal coupling dynamic model, which is integrated with multi- elements, multiscales,multi-scenarios, multi-modules and multi-agents. The model will be used to develop the intelligent decision support system for urban agglomeration sustainable development. In methodology aspect, the mega- urban agglomeration is regarded as an open complex giantsystem. We should establish the standardized shared database for exploring the interactive coupled effects between urbanization and eco- environment. Then using new technology for analyzing big data and the integration methods incorporating of multi- elements, multi- scales,multi- targets, multi- agents, multi- scenarios and multi- modules, we can build a methodology framework to analyze the complex interaction coupling between urbanization and ecoenvironment. The technical route is to analyze spatiotemporal evolution characteristics, identifythe key elements, interpret coupling relationship, reveal the mechanism of coercing effect, find the general rules, filtrate the control variables, solve the critical thresholds, conduct regulation experiments, simulate different scenarios, propose an optimized schemes, and achieve national goals. Furthermore, we could put forward the overall optimization scheme. In general, this research could provide theoretical guidance and method support for the transformation and sustainable development in mega-urban agglomerations.
特大城市群地区城镇化与生态环境交互耦合效应解析的理论框架及技术路径
Progress and the future direction of research into urban agglomeration in China
DOI:10.11821/dlxb201408009
[本文引用: 1]
Urban agglomeration has been the inevitable result of China's rapid industrialization and urbanization over the last 30 years. Since the early 2000s, urban agglomeration has become the new regional unit participating in international competition and the division of labor. China has declared urban agglomeration the main spatial component of new types of urbanization over the next decade as clarified at the first Central Urbanization Working Conference and in the National New-type Urbanization Plan (2014?2020). However, research on urban agglomeration remains weak and needs to be strengthened. From 1934 to 2013, only 19 papers published in Acta Geographica Sinica contained the theme of urban agglomeration (0.55% of the total number of articles published) and the first paper on urban agglomeration appeared less than 10 years ago. Despite a small number of divergent studies, this work has contributed to and guided the formation of the overall pattern of urban agglomeration in China. For example, spatial analyses have promoted the formation of the fundamental framework of China's urban agglomeration spatial structure and guided the National New-type Urbanization Plan; spatial identification standards and technical processes have played an important role in identifying the scope and extent of urban agglomeration; serial studies have facilitated pragmatic research; and problems with the formation and development of urban agglomeration have provided a warning for future choices and Chinese development. Future research into urban agglomeration in China should (1) review and examine new problems in China's urban agglomeration options and cultivation; (2) critically consider urban agglomeration when promoting the formation of the 5+9+6 spatial pattern; (3) rely on urban agglomeration to construct new urbanization patterns such as 'stringing the agglomerations with the axis, supporting the axis with the agglomerations'; and (4) deepen national awareness about resources, environment effects and environmental carrying capacity in high density urban agglomerations, management and government coordination innovation, the construction of public finance and fiscal reserve mechanisms, the technical regulation of urban agglomeration planning, and standards for identifying the scope and extent of urban agglomeration.
中国城市群研究取得的重要进展与未来发展方向
Impact of urbanization and climate change on aquifer thermal regimes
DOI:10.1007/s11269-011-9854-6 URL [本文引用: 1]
Using ISA to analyze the spatial pattern of urban land cover change: A case study in Shenzhen
基于不透水表面指数的城市地表覆被格局特征: 以深圳市为例
Quantitative investigation of the interactive coupling relationship between urbanization and eco-environment
京津冀地区城市化与生态环境交互耦合关系定量测度
The effect of economic growth, urbanization, and industrialization on fine particulate matter (PM2.5) concentrations in China
DOI:10.1021/acs.est.6b02562 URL [本文引用: 1]
Spatial pattern and evaluation of eco-efficiency in counties of the Beijing-Tianjin-Hebei Urban Agglomeration
DOI:10.18306/dlkxjz.2017.01.009
[本文引用: 1]
Urbanization in China has resulted in an increased consumption of resources, energy, and materials and led to negative environmental effects. Urban agglomeration plays pivotal roles in the China's new urbanization. These factors have motivated the widely discussed topic of urban agglomeration's eco-efficiency. This research developed an index system of eco-efficiency and evaluated the eco-efficiency of counties in the Beijing-Tianjin-Hebei Urban Agglomeration using the modified Topsis model for the spatial pattern of consumption of resources, economic benefit, and environmental pollution outputs. We also quantified eco-efficiency by the undesirable-output SBM model in 2006, 2010, and 2014 using environmental pollution as an undesirable output. Spatial autocorrelation index and local Moran's I index were used to analyze the spatial correlation pattern of eco-efficiency at the county level in the study area. The results show that there exist significant spatiotemporal differences of consumption of resources, economic benefit, and environmental pollution outputs. The Beijing-Tianjin-Hebei area had high values of inputs and outputs in the research period. Eco-efficiency of counties in the Beijing-Tianjin-Hebei Urban Agglomeration was relatively low. Mean values of eco-efficiency were 0.324, 0.305, and 0.347 in 2006, 2010, and 2014. It decreased first and then increased. The reasons for the spatial differences of eco-efficiency are location and natural backgrounds, and low economic benefit and high environmental impact are the main factors that restrict the improvement of eco-efficiency. The global Moran's I index values were 0.2539, 0.3007, and 0.3088, indicating that the impact factors of eco-efficiency were not only related to the economic development level of each county unit, but also associated with the eco-efficiency of adjacent counties. The positive agglomeration effect has been increasingly obvious since 2006, and the gap of eco-efficiency of neighboring counties has reduced.
京津冀城市群县域尺度生态效率评价及空间格局分析
Pattern of impervious surface change and its effect on water environment in the Beijing-Tianjin-Tangshan metropolitan area
京津唐城市群不透水地表增长格局以及水环境效应
Evaluation methods and case study of regional ecological carrying capacity for early-warning
DOI:10.18306/dlkxjz.2017.03.005
[本文引用: 2]
Based on the national needs for resources and environment carrying capacity monitoring and early-warning, this article addresses the definition of ecological carrying capacity and its evaluation method for early-warning. A case study was carried out for the Beijing-Tianjin-Hebei region. The article concludes that ecological carrying capacity refers to the ability of ecosystems in providing ecosystem services, preventing ecological problems, and ensuring ecological security. Ecological carrying capacity evaluation for early-warning is to examine the extent of human disturbances that affect ecosystem services supply with regard to water retention, soil retention, sandstorm prevention; produce ecological problems; and affect regional and national ecological security. The main procedures involve indicator and evaluation method selection, threshold identification, status and trend analysis of ecological carrying capacity with reference to early-warning threshold, and cause analysis. The method and case study of ecological carrying capacity evaluation for early-warning proposed in this study can serve as a basis for regional and national assessment.
区域生态承载力预警评估方法及案例研究
Ecosystem-service-based ecological carrying capacity: Concept, content, assessment model and application
基于生态系统服务的生态承载力: 概念、内涵与评估模型及应用
Review of ecological carrying capacity
生态承载力研究进展
Evaluation of the ecological security of Urban Agglomeration on Min Delta based on ecological footprint
基于生态足迹法的闽三角城市群生态安全评价
Analysis of temporal-spatial patterns and influencing factors of urban ecosystem carrying capacity in urban agglomeration in the middle reaches of the Yangtze River
长江中游城市群城市生态承载力时空格局及其影响因素
Security prewarning and regulation of ecological carrying capacity of Chang-Zhu-Tan urban agglomeration based on press-state-response model
基于压力—状态—响应模型的长株潭城市群生态承载力安全预警研究
Human appropriation of net primary production
DOI:10.1126/science.296.5575.1968 URL [本文引用: 1]
Evaluation methods and research trends for ecological carrying capacity
DOI:10.5814/j.issn.1674-764x.2018.02.001 URL [本文引用: 1]
Evaluation and influence factors of spatial accessibility of ecological space recreation service in the Pearl River Delta Urban Agglomeration: A modified Two-step Floating Catchment Area method
珠三角城市群生态空间游憩服务供需匹配性评价与成因分析: 基于改进的两步移动搜寻法
The spatial pattern of urban production-living-ecological space quality and its related factors in China
DOI:10.11821/dlyj020180953
[本文引用: 1]
As the main carrier of population and socio-economic activities, cities are also the places that accumulate the problems from production, living and ecological activities. In order to evaluate the quality of urban production-living-ecological space, this paper develops an evaluation index system based on its theoretical framework, and then analyses the overall characteristics and spatial distribution of the production-living-ecological space quality. Moreover, this paper explores the factors that may affect the quality of urban production-living-ecological space. Using data from 289 prefecture-level cities and above in China in 2015, we find that: (1) the urban production-living-ecological spatial quality is generally at a low level and decreases from the southeast coastal areas to the west and northeast inland areas. (2) The quality levels of production space in the northeast region and living space in the western region are significantly lower than those of other parts of China, and the quality level of ecological space depends on local natural ecology and pollution control. (3) While the quality levels of production and living spaces have a significantly positive correlation, the quality levels of production and ecological spaces show an opposite trend in quite a number of cities. (4) The urban production-living-ecological space quality is associated with the population size and administrative level in an inverted U shape. Specifically, cities with a population size between 10 million and 15 million are more conducive to improve the quality level of production-living-ecological space. Urban production-living-ecological space quality is positively associated with per capita GDP, and cities with comprehensive functions or located in urban clusters have a higher level of production-living-ecological space quality. The above conclusions provide important policy implications for deepening and implementing the planning of China's major function oriented zoning, regional development planning, and even the comprehensive spatial planning under construction from the perspective of production-living-ecological space, as well as directive guidance for urban development strategy and overall planning in different regions. On the whole, the optimization potential of urban production-living-ecological space should be fully released, especially more attention should be paid to the coordination of production-living-ecological space. Different regions should take overall consideration and make up for the shortcomings based on actual conditions respectively.
中国城市生产、生活、生态空间质量水平格局与相关因素分析
Combining natural and human elements to evaluate regional human settlements quality based on raster data: A case study in Beijing-Tianjin-Hebei region
基于栅格的区域人居自然和人文环境质量综合评价: 以京津冀地区为例
Does participating in physical activity in outdoor natural environments have a greater effect on physical and mental wellbeing than physical activity indoors? A systematic review
DOI:10.1021/es102947t URL [本文引用: 1]
Ecological land fragmentation and its connectivity with urbanization in the Yangtze River Delta
长江三角洲生态用地破碎度及其城市化关联
National New Urbanization Plan (2014-2020)
国家新型城镇化规划(2014—2020)
Spatio-temporal trajectories of urban land use change during 1980-2015 and future scenario simulation in Beijing-Tianjin-Hebei urban agglomeration
京津冀1980—2015年城市土地利用变化时空轨迹及未来情景模拟
Spatiotemporal characteristics of water resources exploitation and policy implications in the Beijing-Tianjin-Hebei Urban Agglomeration
DOI:10.18306/dlkxjz.2017.01.006
[本文引用: 1]
The Beijing-Tianjin-Hebei Urban Agglomeration is one of the most competitive support platforms of China in the international economic system. It is also one of the most challenging areas with regard to water security in China and worldwide. Mainly based on data from 2000-2014, we analyzed the spatiotemporal characteristics of water resources exploitation in the Beijing-Tianjin-Hebei Urban Agglomeration using quantitative and qualitative methods, including Theil index, coefficient of variation, curve analysis, and spatial classification analysis. The results show that: (1) The average annual water resources of nearly all cities decreased evidently. The decrease in the north and west were greater than that in the south and east. (2) Water resources are scarce and unevenly distributed in the Beijing-Tianjin-Hebei Urban Agglomeration. The spatial imbalances of water resources first decreased and then increased during the study period. Water scarcities in the central and southern parts of the region were more serious than that in the north. (3) Total water utilizations of nearly all cities showed zero or slow negative growth. The proportion of industrial and agricultural water uses in total water utilization decreased in most cities. However, the spatial imbalances of all types of water use remain relatively stable. (4) Water use efficiencies in all cities increased rapidly. Their spatial differences first increased and then decreased. Based on the above spatiotemporal characteristics, it is recommended that the size of cities and the scale of industrial operations in the Beijing-Tianjin-Hebei Urban Agglomeration should be planned according to water resources carrying capacity, and corresponding urbanization and industrial development policies should be implemented. Water and ecological compensation policies should be improved. Water resource management red line policies should be carried out.
京津冀城市群水资源开发利用的时空特征与政策启示
Development Planning of Yangtze River Delta Urban Agglomerations
2016-06-03. http://www.gov.cn/xinwen/2016-06/03/content_5079264.htm.
长江三角洲城市群发展规划
.2016-06-03. http://www.gov.cn/xinwen/2016-06/03/content_5079264.htm.]
The development plan for Guangdong-Hong Kong-Macao Greater Bay Area
2019-02-18. http://www.gov.cn/gongbao/content/2019/content_5370836.htm.
粤港澳大湾区发展规划纲要
2019-02-18. http://www.gov.cn/gongbao/content/2019/content_5370836.htm.]
Research on the changes of ecosystem services in Guangdong-Hong Kong-Macao Greater Bay Area based on the change of landscape pattern
基于景观格局变化的粤港澳大湾区生态系统服务变化研究
Development Planning of Chengdu-Chongqing City Group
2016-04-27. https://www.ndrc.gov.cn/xxgk/zcfb/ghwb/201605/t20160504_962182.html.
成渝城市群发展规划
2016-04-27. https://www.ndrc.gov.cn/xxgk/zcfb/ghwb/201605/t20160504_962182.html.]
Development Planning of the middle reaches of the Yangtze River
2015-04-13. https://www.ndrc.gov.cn/xwdt/ztzl/xxczhjs/ghzc/201605/t20160512_971938.html.
长江中游城市群发展规划
2015-04-13. https://www.ndrc.gov.cn/xwdt/ztzl/xxczhjs/ghzc/201605/t20160512_971938.html.]
Spatiotemporal characteristics, patterns and causes of land use changes in China since the late 1980s
20世纪80年代末以来中国土地利用变化的基本特征与空间格局
Ecological footprint method in water resources assessment
水资源生态足迹计算方法
Classification evaluation and spatial-temporal analysis of "production-living-ecological" spaces in China
DOI:10.11821/dlxb201707013
[本文引用: 1]
This paper created a land use classification system of production-living-ecological spaces based on analyzing the theories of production-living-ecological spaces and commanding the dialectical relationships between land use types and land use functions. The classification system perfectly connected to the state standard of land use classification. Based on this system, we examined the spatial and temporal patterns of production-living-ecological spaces in China between 1990 and 2010. The results showed that: (1) The production spatial pattern almost unchanged between 1990 and 2010, and the production spaces were mainly distributed in the southeast of the Hu Huanyong Line, including Northeast China Plain, northwest Xinjiang, Ningxia, Lanzhou-Xining, Sichuan Basin, Bohai Rim, Yangtze River Delta, Xiamen-Quanzhou-Zhangzhou, and Pearl River Delta, where China's urban agglomerations and main grain production areas were located in. (2) Living spaces were mainly distributed in China's urban agglomerations and cities, showing a spatial pattern of "high in the east and north regions, while low in the west and south regions". Its spatial expansion varied in different areas. Large-scale expansion of living spaces appeared in the Bohai Rim, Yangtze River Delta and Pearl River Delta, while small-scale and point-type expansion in the major provincial capitals. (3) Ecological spaces were mainly distributed in the northwest of the Hu Huanyong Line, showing a spatial pattern of "high in the west and south regions, while low in the east and north regions". The expansion of ecological spaces were mainly in the Loess Plateau, Hulun Buir Glassland and Tianshan Mountains, while the reduction of ecological spaces were mainly in the Northeast China Plain, North China Plain, Yangtze River Delta, Pearl River Delta, Ningxia and Xinjiang. (4) Industrialization and urbanization were the basic driving powers of changes of China's production-living-ecological spaces. The main reasons for regional spatial differences across China included farmland cultivation in Northwest and Northeast China, rapid urbanization in North China, Bohai Rim, Yangtze River Delta and Pearl River Delta, and reversion of farmland to forestland in the Loess Plateau. This research was valuable for the studies on classification and evaluation of production-living-ecological spaces.
中国“三生空间”分类评价与时空格局分析
An indicator system for biodiversity and ecosystem services evaluation in China
中国生物多样性与生态系统服务评估指标体系
Classification of ecosystem services based on human demand
基于人类需求的生态系统服务分类
Urban ecological infrastructure based on ecosystem services: Status problems and perspectives
基于生态系统服务的城市生态基础设施: 现状、问题与展望
Review and prospective applications of demand, supply, and consumption of ecosystem services
生态系统服务需求、供给和消费研究进展
Spatial relationship between supply and demand of ecosystem services through urban green infrastructure: Case of Xi'an City
城市绿色基础设施生态系统服务供给与需求的空间关系: 以西安市为例
Research progress of urban public recreational space in China
DOI:10.11821/dlxb201810008
[本文引用: 2]
As the main places for urban residents' recreation activity in the era of mass leisure, urban public recreational space (UPRS) is one of the major components of urban public spatial system. Its planning, layout, and the service are the main characters to measure the urban social civilization and the life quality of residents. Meanwhile, in order to meet the current demands for the construction of livable cities and meet the challenges of UPRS development in the process of urbanization, it is important to have a scientific and systematic review on the latest development of UPRS research for promoting the development of this subject. Based on a data from the China National Knowledge Internet during 1985 to 2017, this study examined and summarized the research development of UPRS in China. By using literature quantitative analysis, we divided the China's UPRS related research into three stages of development based on the number and growth rate of papers per year, namely starting period (1985-2000), growth period (2001-2009), and consolidation period (2010-2017). Then, this paper identified nine hot research topics in the UPRS and reviewed their progresses in research by using a knowledge network of UPRS built on the co-occurrence of keywords. These topics include the classifications of UPRS, spatial structure and layout, comprehensive assessment, planning and development strategies, impacts induced by UPRS development, evolution characteristics and their driving mechanism, space imagery features, sustainable utilization, and so on. Moreover, this paper systematically reviewed the research methods and the scale of the China's UPRS related studies. Finally, in response to problems and deficiencies of extant research, this paper put forward some suggestions regarding future research. Chinese UPRS studies should pay more attention to the basic theoretical research. We should construct a new research system with Chinese characteristics based on interdisciplinary and multi-level spatial integration research. Besides, we should develop the humanism philosophy and construct management systems for UPRS that can lead the development of world cities based on the global vision.
中国城市公共游憩空间研究进展
Forest ecosystem services and their valuation in China
中国森林生态系统服务功能及其价值评价
Theory and method to accounting value of forest water conservative
DOI:10.5958/2455-7145.2018.00005.X URL [本文引用: 1]
森林涵养水源的价值核算研究
Estimation of grassland ecosystem services value of China using remote sensing data
中国草地生态系统服务功能价值遥感估算研究
Measurement and dynamic change of ecosystem services value in the farming-pastoral ecotone of northern China
北方农牧交错带生态系统服务价值测算及变化
Assessment of water regulation service of forest and grassland ecosystems in Three-River headwaters region
三江源地区林草生态系统水源涵养服务评估
Study on the impact of land use/land cover change on soil erosion in mountainous areas
山区土地利用/覆被变化对土壤侵蚀的影响
Constructed wetland and its application for industrial wastewater treatment
This paper presents a review of the mechanisms and advantages of the constructed wetland (CW). The wetland as land-intensive biological treatment systems has complicated purificative mechanisms, including physio-chemistry such as substrate adsorption, substrate filtration, plant adsorption, pollutant sediment ion exchange and biochemistry such as plant sorption, microbiology oxidation, microbiology ammunition. Besides the aesthetic aspect of macrophytes to provide wildlife habitats, the advantages of CW are relatively low cost, simple operation with stable effluent quality and good resistance to shock loading. In recent years, these systems have been used in the purification of domestic sewage. Nowadays attention has focused particularly on the use of constructed wetlands for the treatment of industrial effluents. According to the study and present state of constructed wetland for industrial wastewater treatment, feasibility of CW for special industrial wastewater treatment and investigations in the future were discussed.
人工湿地及其在工业废水处理中的应用
Effects of land use/land cover changes on regional ecological environment
土地利用/土地覆被变化对区域生态环境的影响
Comparative analysis on the leisure values of urban ecological recreation spaces: A case study of Changshu city
DOI:10.11821/dlyj201602005
[本文引用: 2]
The planning and construction of ecological recreation spaces are important contents of urban planning and construction, and the enhancement of leisure value is an important task in the construction of urban ecological recreation spaces. By selecting comparable observation corridors in the woodland, grassland, water area with highlighted urban ecological recreation service function in Changshu city, and dynamically observing recreationists' spontaneous recreation behaviors, this study set up the method for evaluating the leisure value of urban ecological recreation space, and the evaluation indexes included leisure tendency to certain eco-space, leisure viscidity, and the adaptability of certain eco-space to recreationists. Using these evaluation indexes, the dynamic comparative analysis of the leisure values of woodland, grassland and water area was carried out. The results showed that: (1) Among the three types of ecological recreation spaces with similar acreages, water area had the highest leisure value in the whole year, followed by grassland and woodland. Woodland had the most advantages in forming better recreational environment when the external macro-conditions were not good for recreation in daylight, followed by water area and grassland. (2) In the whole year, the leisure value distributions of different ecological recreation spaces were different and mutually complementary each other. The factors like visual field, light, activity space and others weakened the leisure value of woodland in the early morning and at nightfall, but grassland and water area had certain comparative advantages in terms of these factors, and formed complementation with woodland. (3) The leisure value of woodland to the elder was most remarkable, while middle-aged people preferred water-area leisure, and the youth and children preferred grassland leisure. What's more, different aged people tended to conduct their most ecological leisure activities in their respective favorite time, which influenced the temporal distribution of the leisure value of each ecological recreation space. (4) In the construction of urban ecological recreation spaces, the mutual complementarity of different ecological recreation spaces in the aspects of recreation servicing time and serving objects should be attached more attention; the configuration scheme of different ecological recreation spaces should be made according to the areal distribution of different aged people in city; the leisure facilities should be scientifically allocated according to the differences in the leisure value of each ecological recreation space; the dynamic management measures should be implemented according to the variation of the leisure value of eco-space; and the leisure value of certain ecological recreation space should be enhanced according to the relevant influencing factors, and so on.
城市生态游憩空间休闲价值对比分析: 以常熟市为例
A review of ecosystem services supply and demand
DOI:10.11821/dlxb201707012
[本文引用: 1]
Natural ecosystems supply tangible products and intangible services, which are demanded and consumed by human beings. Therefore, supply and demand make up the dynamic process of ecosystem services flowing from natural ecosystems to human society. The process of identifying, measuring, mapping and conducting an equilibrium analysis of the supply and demand of ecosystem services is beneficial for the effective management of natural ecosystems and optimal allocation of natural resources. Moreover, this can provide theoretical support to payments for environmental services and ecological compensation, thus promoting ecological security and sustainable development. Although the study of ecosystem services supply and demand is important, related studies are limited in China and are mainly focused on Europe and North America. Based on the theory and case studies conducted in China and other countries, this paper first presented the definition of ecosystem services supply and demand, including actual supply, potential supply, satisfied demand, and total demand. Second, the classifications of ecosystem services were compared based on their spatial characteristics. Third, the methods of mapping ecosystem services supply and demand were divided as follows: (1) land use estimation, which needs simple operation and limited data, may cause errors due to the loss of internal heterogeneity and boundary effects; (2) ecological process simulation is mostly applied in water-related ecosystem services, showing detailed and reliable results with multi-calculation; (3) spatial data superposition, which is an ideal method for mapping ecosystem services with complete spatial data sets; (4) expert knowledge, where the mapping of ecosystem services supply and demand is decided by a group of experts or is based on the previous related findings; however, the mapping principle followed in a local study may not be applicable to studies conducted at other places; and (5) the use of integrated models InVEST (Integrated Valuation of Ecosystem Services and Trade-offs), which is suitable for supply analysis, and ARIES (ARtificial Intelligence for Ecosystem Services), maps service flow from natural ecosystems to human beings. Finally, we discussed the equilibrium analysis framework for ecosystem services supply and demand from three angles: actual supply and potential supply, satisfied demand and total demand, and the spatial and quantitative relation between supply and demand.
生态系统服务供给和需求研究进展
Research and application advances in ecological carrying capacity
生态承载力研究和应用进展
Calculation and analysis of equivalence factor and yield factor of ecological footprint based on ecosystem services value
基于生态系统服务价值的生态足迹模型均衡因子及产量因子测算
Ecological balance between supply and demand in China using ecological footprint method
基于生态足迹的中国生态承载力供需平衡分析
Pollution footprint: A type of ecological footprint based on ecosystem services
污染足迹: 一种基于生态系统服务的生态足迹
Assessment of sustainable development of urban water ecosystems in Dalian
城市水生态系统可持续发展评价: 以大连市为例
Effect of urbanization on the ecological footprint and their interactive coupling relationship
城市化对区域生态足迹的影响及其耦合关系
Improvement of ecological footprint model based on freshwater resource account and pollution accounts
基于淡水资源账户和污染账户的生态足迹改进模型
The land carrying capacity of China based on man-grain relationship
中国基于人粮关系的土地资源承载力研究: 从分县到全国
The theoretical cognition of the development law of China's urban agglomeration and academic contribution
DOI:10.11821/dlxb201804005
[本文引用: 1]
Urban agglomeration refers to a highly integrated city and town group. It comes into being with the development of industrialization and urbanization to the advanced stage. The formation and development of urban agglomeration is a long natural process, which is transformed from competition to cooperation. China is in a new stage of urbanization transition, and has entered a new era of leading the global urban agglomeration development in the 21st century. The research and experience model of China's urban agglomeration has been accepted by global urban agglomeration construction as reference. In this paper, the natural law of urban agglomeration is proposed, including developmental gradual law, multi-scale transmission law of space intensive utilization, the combination law of spatial crystal structure, the natural growth of the breeding tree, and the gradient upgrade law of sustainable development. Following these laws, Chinese geographers have made great contributions to the research and development of China's urban agglomerations, which focuses on academic theory, technical method, decision support and planning practice. We developed and scientifically defined the concept of urban agglomeration, and first adopted the identification standard of urban agglomeration space. We established the spatial intensive development and layout simulation decision support technology chain in urban agglomeration, and developed related software chain. We laid out the new pattern of 5+9+6 in the spatial organization of China's urban agglomerations, and formulated the first China's urban agglomeration planning technical regulation. We completed the development plan of most urban agglomerations in China, which has become an important basis for decision-making at the national level. In the future, geographers will play a growing role and shoulder the responsibility in the development of Chinese urban agglomerations. We should combine qualitative and quantitative methods, and use big data and intelligent decision support technology to solve a series of problems in the development of this cause. Only in this way can Chinese geographers make greater contributions to the development of urban agglomerations.
中国城市群形成发育规律的理论认知与地理学贡献
The basic law of the formation and expansion in urban agglomerations
DOI:10.1007/s11442-019-1686-y URL [本文引用: 1]
Analysis on ecological footprint and evaluation of sustainability of typical cities in Yangtze River Delta based on improved parameters
基于改进参数的长三角城市生态足迹分析及其可持续性评价
Theoretical foundation and patterns of coordinated development of the Beijing-Tianjin-Hebei Urban Agglomeration
DOI:10.18306/dlkxjz.2017.01.002
[本文引用: 1]
Promoting coordinated development of the Beijing-Tianjin-Hebei Urban Agglomeration is not only a major national strategy, but also a long-term complex process. It is necessary to apply scientific theories and respect the laws of nature to realize the strategic target of common prosperity, share a clean environment, share the burden of risk of development, and build a world-class metropolis for the Beijing-Tianjin-Hebei Urban Agglomeration. This article examines the scientific foundation and patterns of coordinated development of the Beijing-Tianjin-Hebei Urban Agglomeration. Synergy theory, game theory, dissipative structure theory, and catastrophe theory are the theoretical basis of coordinated development of the Beijing-Tianjin-Hebei Urban Agglomeration. Synergy theory is the core theory for the coordinated development of the Beijing-Tianjin-Hebei Urban Agglomeration. The coordinated development process of the Beijing-Tianjin-Hebei Urban Agglomeration is a non-linear spiral progress of game, coordination, mutation, game, resynchronization, and mutation. Each game-coordination-mutation process promotes the coordinated development of the urban agglomeration to a higher level of coordination, and the progress fluctuates. This process includes eight stages: assistance phase, cooperation phase, harmonization phase, synergy phase, coordination phase, resonance phase, integration phase, and cohesion phase. Further analysis shows that the real connotation of coordinated development of the Beijing-Tianjin-Hebei Urban Agglomeration is to realize the coordination of planning, transportation, industrial development, urban and rural development, market, science and technology, finance, information, ecology, and the environment, as well as the construction of a collaborative development community. The Beijing-Tianjin-Hebei Urban Agglomeration will achieve advanced collaboration from low-level collaborative phase through regional coordination on planning, construction of traffic network, industrial development, joint development of urban and rural areas, market consolidation, science and technology cooperation, equal development of financial services, information sharing, ecological restoration, and pollution control. This study may provide a scientific foundation and theoretical basis for the coordinated development of the Beijing-Tianjin-Hebei Urban Agglomeration.
京津冀城市群协同发展的理论基础与规律性分析
