

1 引言
生态环境问题是当前人类面临的全球性重要问题之一,全球变暖、土地沙化、森林资源锐减、生物多样性功能衰退等严重影响着人类的生存与发展[1,2]。随着经济高速发展,中国的生态环境问题也日益突出,尤其是21世纪以来,中国的生态环境恶化已经影响到人民的生存安全,成为民生中的大问题[3],引起了党和国家的高度关注[4]。为此,中国共产党十九大报告中特别指出要实施重要生态系统保护和修复重大工程,优化生态安全屏障体系,构建生态廊道和生物多样性保护网络,提升生态系统质量和稳定性。《中共中央关于坚持和完善中国特色社会主义制度,推进国家治理体系和治理能力现代化若干重大问题决定》也明确指出,要开展大规模国土绿化行动,加快生态综合治理,保护生态多样性,筑牢生态安全屏障。生态敏感性评价是生态环境治理和保护的重要参考指标之一,已引起了广泛关注。
生态敏感性是指生态系统对自然环境变化和人类干扰的反应程度,是发生区域生态环境问题的难易程度和可能性大小[5]。生态敏感性评价实质上是对现状自然环境背景和人类干扰背景下潜在生态环境问题进行有效识别的方法之一,能为预防和治理生态环境问题提供有用的信息[6]。生态敏感性较高的区域,当生态系统遇到干扰时,极易产生生态环境问题,是生态环境保护和恢复建设的重点区域[7,8]。目前,关于区域生态敏感性的研究,国内外学者已取得了大量的研究成果,研究内容分为评价指标体系、尺度和方法研究三大部分[9,10,11,12]。① 指标体系。欧洲太空局从土壤、气候、植被和管理质量视角构建评估指标体系,此指标体系适用于沙漠化和土地退化区域的生态敏感性研究(如西亚国家和地中海地区),而对植被较好、土地退化尚不明显的地区该指标体系适用性不强[12];中国学者从土壤侵蚀、土壤盐渍化、土地沙漠化和生物多样性等生态因子视角构建生态敏感性评估指标体系[13,14,15,16],并将最终的评估结果分为5类,比欧洲太空局评价更为细致。不过,其目前存在的问题是缺乏统一的评价指标体系,且对空间尺度依赖程度较高,尺度效应对研究结果的精度影响也较大。② 研究尺度。生态敏感性研究多集中于流域、岛屿和地区尺度,对国家尺度及洲际尺度的大面积宏观探测的研究成果甚少。其中,欧阳志云等[17]选取水土流失、沙漠化、盐渍化和酸雨等指标,刘军会等[8]选取土地沙化、土壤侵蚀和石漠化等指标,对中国全国尺度的生态敏感性状况进行了深入研究,但其研究成果仅反应了当地敏感性的现状情况,没有揭示其纵向、横向的发展变化态势,属于静态性研究[18]。③ 研究方法。当前研究多集中于运用传统的主观权重方法对生态敏感性进行研究,赋权重方法计算步骤复杂且易受主观因素的影响。全排列多边形图示指标法不用专家主观评判权重系数的大小,减少了指标计算过程中的主观随意性[19],且其考虑了临界值对系统综合指标的放大和紧缩效应,能够有效地反映中国陆地生态环境系统的协调性和系统整合性[20]。
2 数据来源与研究方法
2.1 指标选取与数据来源
中国经济快速发展和城镇化步伐加快后对生态环境及生态敏感性产生了一定影响,但其对生态环境产生的影响与经济发展节点相比具有滞后性[21]。本文在综合考虑中国实际生态环境状况以及较大尺度评价数据可获得性的基础上,在数据获取及指标计算时均选取了2000年及以后的数据(由于港澳台地区部分数据缺失,因此本文研究区域不包括港澳台地区)。
图1
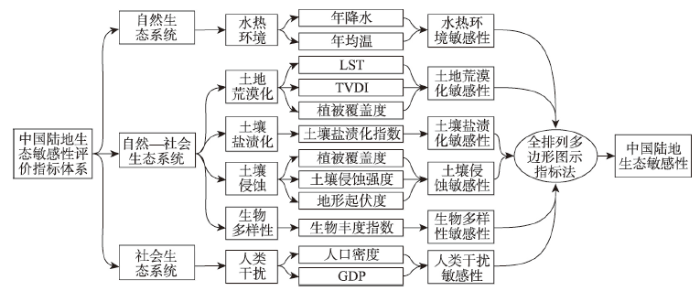
图1
中国陆地生态敏感性评估模型
注:LST为地表温度,TVDI为温度植被干旱指数。
Fig. 1
China's terrestrial ecological sensitivity assessment model
2.1.2 数据来源 ① 遥感数据:2000年、2005年、2010年、2015年和2018年MOD09A1和MOD11A2数据产品来源于NASA官网(
图2
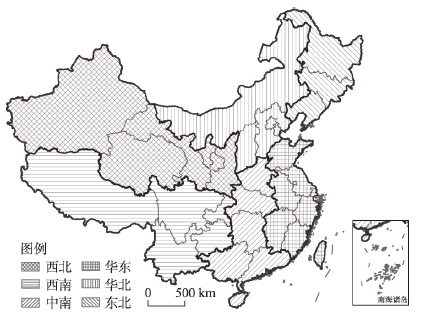
图2
中国六大地理分区
注:基于自然资源部标准地图服务网站审图号为GS(2016)2885号的标准地图制作,底图边界无修改。
Fig. 2
China's six geographical regions
2.2 研究方法
正向标准化:
负向标准化:
式中,Yi为第i因子标准化后的值;Xi为第i因子的原始值。
表1 指标因子标准化统计表
Tab. 1
| 指标 | 指标因子标准化 | 指标 | 指标因子标准化 | |
|---|---|---|---|---|
| 土壤侵蚀敏感性 | 土壤侵蚀强度(+) | 土地荒漠化敏感性 | LST(+) | |
| 地形起伏度(+) | TVDI(–) | |||
| 植被覆盖度(–) | 植被覆盖度(–) | |||
| 人类干预敏感性 | 人口密度(+) | 水热环境敏感性 | 年降水(–) | |
| GDP(+) | 年均温(–) | |||
| 生物多样性敏感性 | 生物丰度指数(–) | 土地盐渍化敏感性 | 土地盐渍化指数(+) |
2.2.2 指标计算 假设在指标系统中有m个指标,有n个指标因子。则其评估矩阵为:
式中:i =1, 2, …, m; j =1, 2, …, n。之后对所有的指标因子进行标准化(表2),并根据信息论中信息熵的定义,对第j个指标因子的信息熵(Ej)进行计算:
常数k = 1/ln(m)时,当rij = 0时,ln(rij)无意义。因此rij被替换为
表2 指标介绍及要素计算
Tab. 2
| 指标层 | 因子层 | 计算公式及数据 | 解释说明 |
|---|---|---|---|
| 土壤侵蚀 | 土壤侵蚀强度 | 土壤侵蚀强度数据产品 | – |
| 地形起伏度 | 由DEM数据计算获得 | – | |
| 植被覆盖度 | NDVI是归一化植被指数;NDVImax为植被的植被指数;NDVImin为裸土的植被指数[25] | ||
| 人类干扰 | 人口密度 | 由统计数据插值获得 | 用克里金插值法中的普通克里金插值方法进行插值[22] |
| GDP | 由统计数据插值获得 | 普通克里金插值方法 | |
| 生物多样性 | 生物丰度指数 | Abio为生物丰度指数归一化系数;BSI为生物丰度指数[26] | |
| 土地荒漠化 | LST | MODIS 11A2数据产品处理获得 | 采用最大值合成法获得年尺度LST数据; |
| TVDI | 式中:TS为地表温度;a1、b1、a2和b2分别为干边与湿边拟合方程系数[27] | ||
| 植被覆盖度 | 同土壤侵蚀植被覆盖度 | – | |
| 水热环境 | 年降水 | 由气象数据插值获得 | 采用克里金插值法中的协同克里金插值方法进行插值[22] |
| 年均温 | 由气象数据插值获得 | 协同克里金插值方法 | |
| 土地盐渍化 | 土地盐渍化指数 | b1、b2分别为MOD09A1中的620~670mm、841~876mm波段反射率;NDVI为归一化植被指数[28];SI为盐分指数[29];SRSI为土壤盐渍化指数 |
因此,熵权法(Wi)计算公式为[24]:
式中:S为敏感性指标;wi为第i个因子的敏感性权重;ai为第i个敏感性因子值。
2.2.3 综合生态敏感性 近年来对于综合生态敏感性的评价指标和模型较多[30],对于各指标权重的确定和综合计算也不尽相同,其中全排列多边形图示指标法在生态评价领域应用较为广泛[30],其方法也较为成熟,在多方法计算、比较后发现,该方法对于尺度较大的生态敏感性评价较为科学合理,并能避免传统权重赋值法对研究结果的影响。因此本文选用全排列多边形图示指标法对中国陆地生态敏感性状况进行研究。其基本原理为:设共有N个标准化指标,以原点0为中心,以标准化的上限值1为半径形成中心N多边形,各指标值在原点与中心N多边形顶点间取值,指标值连线组成不规则N多边形,按分类排列乘法原理,N个指标可形成(N-1)!/2个不同的不规则N多边形[19, 30]。定义各不规则多边形面积的均值与中心多边形的比值为最终评价结果值[19,30](图3)。其计算公式如下:
式中:SEI为综合生态敏感性;Si和Sj为单项指标。
图3
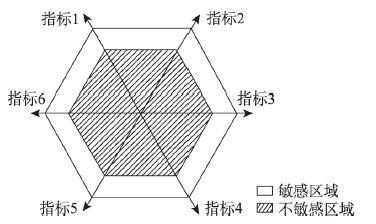
图3
全排列多边形图示指标法示意图
Fig. 3
Schematic diagram of entire-array-polygon indicator method
表3 2018年指标共线性诊断
Tab. 3
| 指标 | p | TOL | VIF |
|---|---|---|---|
| 土壤盐渍化敏感性 | <0.001 | 0.193 | 5.171 |
| 土壤侵蚀敏感性 | <0.001 | 0.290 | 3.453 |
| 土地荒漠化敏感性 | <0.001 | 0.154 | 6.482 |
| 水热环境敏感性 | <0.001 | 0.688 | 1.454 |
| 生物多样性敏感性 | <0.001 | 0.408 | 2.451 |
| 人类干预敏感性 | <0.001 | 0.828 | 1.208 |
式中:ESCI为生态敏感性变化强度;n为样本年数;Codei为前一年生态敏感性代码;Codei+1为后一年生态敏感性代码。当
表4 敏感性分级标准
Tab. 4
| 敏感分级 | 生物多样性 | 水热环境 | 土地荒漠化 | 土壤盐渍化 | 土壤侵蚀 | 人类干预 | 综合生态敏感性 | 赋值 |
|---|---|---|---|---|---|---|---|---|
| 不敏感 | < 0.24 | < 0.35 | < 0.23 | < 0.18 | < 0.14 | < 0.11 | < 0.32 | 1 |
| 轻度敏感 | 0.24~0.41 | 0.35~0.50 | 0.23~0.34 | 0.18~0.30 | 0.14~0.26 | 0.11~0.17 | 0.32~0.36 | 2 |
| 中度敏感 | 0.41~0.59 | 0.50~0.65 | 0.34~0.49 | 0.30~0.44 | 0.26~0.39 | 0.17~0.27 | 0.36~0.42 | 3 |
| 重度敏感 | 0.59~0.81 | 0.65~0.78 | 0.49~0.64 | 0.44~0.59 | 0.39~0.52 | 0.27~0.45 | 0.42~0.47 | 4 |
| 极度敏感 | ≥ 0.81 | ≥ 0.78 | ≥ 0.64 | ≥ 0.59 | ≥ 0.52 | ≥ 0.45 | ≥ 0.47 | 5 |
表5 敏感性变化状况统计表
Tab. 5
| 敏感性涨落分区 | 二级分区 | 编码变化 | 涨落状况描述 |
|---|---|---|---|
| 不变区 | 常年不变区 波动不变区 | 11111, 22222, 33333, 44444, 55555 11121, 11211, 23222, 31233, 43344, 42344, 55445, 55545, 等 | 代码不变的区域 首尾代码一致的区域 |
| 波动升高区 | 波动升高区 | 11112, 12112, 13223, 12343, 21213, 22123, 22323, 23223, 32224, 33234, 34544, 35545, 35454, 43455, 43445, 44345, 45445, 等 | 首尾代码相比,其代码增大的区域 |
| 波动降低区 | 波动降低区 | 21211, 22221, 23221, 23231, 23211, 31321, 32121, 34332, 43223, 43232, 43343, 43432, 45543, 54433, 54332, 54323, 55443, 等 | 首尾代码相比,其代码减小的区域 |
生态敏感性涨落状况计算公式如下[23]:
式中:Change为生态敏感性变化状况;Code为各年生态敏感性代码。
式中:PD, C为影响因素D对生态敏感性C的探测力值;n和
3 结果分析
3.1 综合生态敏感性时空演变特征
中国陆地生态敏感性研究结果表明(图4),2000—2018年间中国陆地生态敏感性总体较低,且呈现出波动下降的发展趋势(图5a),由2000年的0.342下降到2018年的0.333,这主要是21世纪以来中国实施了一系列生态环境治理与预防工作,例如:生态移民安置工程、围栏封育工作等。这一系列工作极大的改善了中国陆地局部区域的生态环境状况,保护了生物多样性,从而极大地减轻了该区域的自然生态系统压力。但值得注意的是,2010—2015年间中国陆地生态敏感性持续升高,由2010年的0.334上升到2015年的0.336,这主要是由于以前及这一时期的中国社会经济快速发展,使得人类对自然生态系统的干扰进一步加强,进而破坏了区域生态系统的自我恢复能力,增加了自然生态系统的压力。而2015年以后,随着中国经济结构调整与转型发展的深入推进,中国陆地生态环境状况得到逐步改善,自然生态系统的压力也随之减轻。
图4
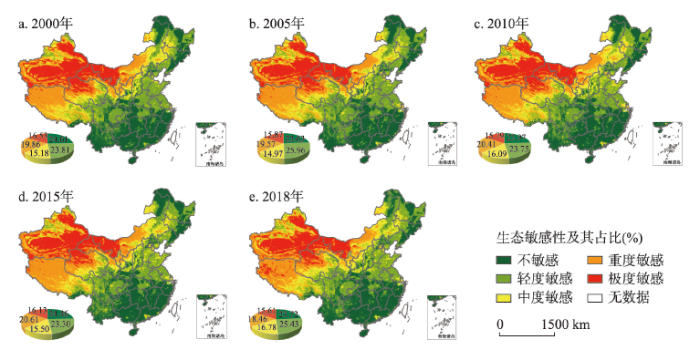
图4
2000—2018年中国陆地生态敏感性空间分布格局
注:基于自然资源部标准地图服务网站审图号为GS(2016)2885号的标准地图制作,底图边界无修改。
Fig. 4
Spatial distribution of China's terrestrial ecological sensitivity from 2000 to 2018
图5
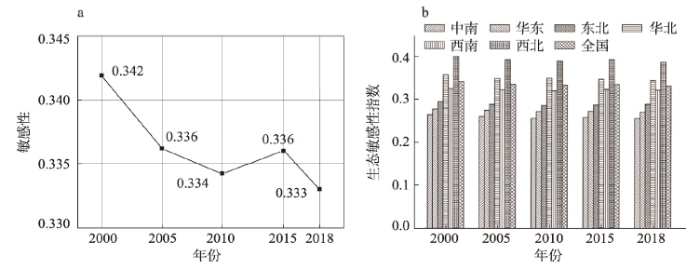
图5
2000—2018年中国陆地生态敏感性变化(a)及六大地理分区生态敏感性指数(b)
Fig. 5
Trends of terrestrial ecological sensitivity change (a) and ecological sensitivity index of the six geographical regions (b) in China from 2000 to 2018
从生态敏感性空间分布来看,研究期内中国陆地生态敏感性总体上呈现出“东南低、西北高”的空间分布格局(图4)。从其区域分布差异来看(图5b),研究期内中国西北地区的生态敏感性最高,其次为华北地区,该二者的生态敏感值均超过了全国平均水平0.33。之后依次为西南地区、东北地区、华东地区和中南地区。其中,中南地区的生态敏感值甚至低于0.26。这主要是由于西北地区地处中国内陆,属于温带大陆性气候,降水稀少、气候干燥、自然条件复杂、植被覆盖度低、生态承载力低,且塔克拉玛干、腾格里、古尔班通古特沙漠等分布广泛。而华北地区毗邻西北地区,且其部分区域坐落于蒙古高原,生态环境承载能力较低,抗干扰能力较差。西南地区生态敏感性较高主要是由于其大部分区域属于青藏高原气候区,海拔较高、温度较低,生态环境自我调节能力较差。而东北地区、华东地区和中南地区大部分区域位于中国第三阶梯,地势相对平坦,且其属于季风气候区,降水较多、植被覆盖度高,生态环境状况较好。因此,该区域的生态敏感性状况相对较低。从六大地理分区生态敏感性空间分布特征来看,中国西北地区总体上呈现出“西北高,东南低”“荒漠区高,山脉区低”的空间分布格局,西南地区、华北地区和东北地区总体上呈现出“西部高东部低”的空间分布格局,而华东地区和中南地区总体上呈现出“北部高,南部低”的空间分布格局。从六大地理分区生态敏感性波动变化状况来看,其均呈现出波动下降的趋势。其中,西北地区的敏感值下降幅度最大,达到了0.013,其次为华北地区,下降幅度达到0.012。这表明21世纪以来中国在西北和华北地区的生态环境治理与保护工作效果更加显著。
3.2 生态敏感性变化强度时空特征分析
从敏感性变化强度空间分布来看(图6a),敏感性变化较强的区域主要分布在内蒙古的东部,云南的中北部,青海和四川的南部以及西藏的东南部。此外,新疆、甘肃和河北等地的局部地区也有分布。从生态敏感性变化强度来看(图6b),2000—2018年间中国陆地生态敏感性以不变区为主体,不变区的面积为650.62×10⁴ km2,占国土面积的68.80%。其次为一次变化区,面积达到了135.37×10⁴ km2,占国土面积的14.31%。而变化最强的4次变化区面积为9.30×10⁴ km2,占国土面积的0.98%。总体来看(图6c),西南地区的生态敏感性变化强度最大,其2次、3次和4次变化区面积均为六大地理分区之最,分别占国土面积的4.38%、1.47%和0.46%,其次为西北地区。这主要是由于中国西南地区大部分区域属于青藏高原气候区,其海拔较高、温度较低,对外部环境因素的影响较为敏感,因此该区域的生态敏感性变化强度比其他区域更为剧烈,而西北地区深居中国内陆,生态承载能力较低,人口稀少,对全球气候变化和政策等因素变动反应较大。
图6
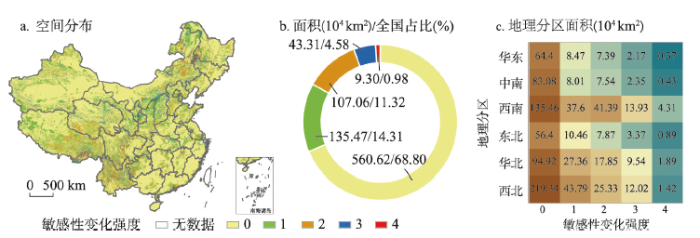
图6
生态敏感性变化强度空间分布、面积占比及地理分区统计
注:基于自然资源部标准地图服务网站审图号为GS(2016)2885号的标准地图制作,底图边界无修改。
Fig. 6
Spatio-temporal distribution, area statistics, and geographical region statistics of the sensitivity change intensity
3.3 生态敏感性涨落变化分析
本文为了监测中国陆地生态敏感性涨落变化状况,通过运用格网编码法,对其2000—2018年间生态敏感性变化趋势进行了分析。并将最终的结果分为波动上升、常年不变、波动不变和波动下降4种类型,并对其结果进行可视化表达(图7a)。研究结果表明:2000—2018年间中国陆地生态敏感性总体稳定,常年不变区的面积为653.78×10⁴ km2,占国土面积的69.13%。波动不变区的面积为111.19×10⁴ km2,占国土面积的11.76%。而波动上升和波动下降的面积比分别为8.06%和11.05%(图7b),这表明进入21世纪以来,中国陆地的生态敏感性呈现出下降的趋势。从空间分布来看,敏感性波动下降的区域主要分布在中国的西北和华北地区,而敏感性波动上升的区域主要分布在中国的西南和东北区域。此外,各大城市群也成为敏感性波动上升的主要分布地。
图7
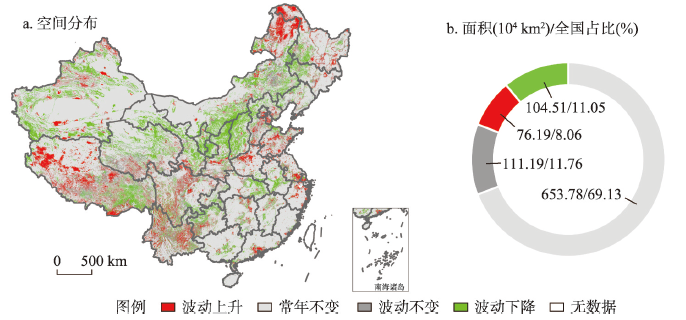
图7
敏感性涨落变化类型空间分布及面积统计
注:基于自然资源部标准地图服务网站审图号为GS(2016)2885号的标准地图制作,底图边界无修改。
Fig. 7
Spatial distribution and area statistics of sensitive fluctuation types
3.4 生态敏感性变动成因探测
本文将各年的综合生态敏感性作为因变量,将生物多样性、水热环境、土壤侵蚀、土壤盐渍化、土地荒漠化和人类干扰指标作为自变量。由于地理探测器计算所需的自变量为类型量,因此本文运用了自然断点法对自变量进行分级,将自变量的数值量转化为类型量,并结合ArcGIS10.6软件对研究区的因子驱动进行了探测。探测结果表明(表6):研究期内土地荒漠化和土壤盐渍化指标对中国陆地生态敏感性的影响最大。土壤侵蚀和生物多样性指标次之。而人类干扰指标的影响最低。从5个时期的q值变化状况来看,虽然各指标的q值变动不大,且其相对重要性并未发生变化。但值得注意的是,人类干扰指标的影响力在逐年增加,这表明人类在经济快速发展,城市化与工业化取得巨大成就的同时,其对生态环境系统的干扰程度也在逐步提升。这也表明生态环境保护制度的健全与完善,人类生产生活活动的行为规范是迫在眉睫、必不可少的,需引起人们的高度关注。
表6 生态敏感性影响因素地理探测结果
Tab. 6
| 指标 | 2000年 | 2005年 | 2010年 | 2015年 | 2018年 | |||||||||
|---|---|---|---|---|---|---|---|---|---|---|---|---|---|---|
| q | p | q | p | q | p | q | p | q | p | |||||
| 生物多样性 | 0.728 | <0.001 | 0.725 | <0.001 | 0.723 | <0.001 | 0.721 | <0.001 | 0.727 | <0.001 | ||||
| 水热环境 | 0.464 | <0.001 | 0.457 | <0.001 | 0.470 | <0.001 | 0.443 | <0.001 | 0.436 | <0.001 | ||||
| 土壤侵蚀 | 0.737 | <0.001 | 0.743 | <0.001 | 0.733 | <0.001 | 0.735 | <0.001 | 0.737 | <0.001 | ||||
| 土壤盐渍化 | 0.785 | <0.001 | 0.762 | <0.001 | 0.795 | <0.001 | 0.768 | <0.001 | 0.789 | <0.001 | ||||
| 土地荒漠化 | 0.866 | <0.001 | 0.862 | <0.001 | 0.826 | <0.001 | 0.836 | <0.001 | 0.828 | <0.001 | ||||
| 人类干扰 | 0.018 | <0.001 | 0.020 | <0.001 | 0.022 | <0.001 | 0.044 | <0.001 | 0.039 | <0.001 | ||||
4 讨论
4.1 敏感性管控分区
当前,国内学术界和国际学术界对生态敏感性做了大量工作,但其主要集中于单一生态系统、单一视角的生态敏感性研究,而对全国陆地范围内复合、多视角耦合生态系统敏感性研究相对偏少。且其对生态敏感性保护区进行划定时,主要依据是单一的“静态”现状或“动态”演变,而对“静态”和“动态”相结合的敏感性保护区划定研究相对偏少。鉴于此,本文从自然生态系统、自然—社会复合生态系统和社会生态系统3个视角出发,耦合土地、生物等多个单一生态系统,构建了基于GIS和RS的空间可视化评价模型,并使用将中国陆地生态敏感性现状(静)与敏感性变化强度(动)相结合的方法(图8),对中国陆地生态敏感性保护区划定进行了初步尝试,以期为生态优先、绿色发展理念指引下的中国生态文明建设提供一种新的思路,并通过对其分异规律的分析,为中国国土空间规划、宏观生态环境综合整治政策的制定提供科学依据。
图8

图8
中国陆地生态敏感性管治分区
注:基于自然资源部标准地图服务网站审图号为GS(2016)2885号的标准地图制作,底图边界无修改。
Fig. 8
Terrestrial ecological sensitivity control zoning in China
在划定敏感性管治分区时,本文将现状生态敏感性和敏感性变化强度依据不同类型分别赋予保护权重1、3、5、7、9,并通过空间栅格数据叠置方法得到了生态敏感性空间管治计算结果,之后通过运用自然断点法对其进行分区,将其分为生态环境优化区、生态环境管控区和生态环境治理区三大类。其中,生态环境优化区为“动静”评分较低(2~4),生态环境状况较好,只需保持现状并对其进行优化的区域;生态环境管控区为“动静”评分居中(6~8),生态环境状况较差,需对其进行严格监控,必要时限制人类干扰的区域;生态环境治理区为“动静”评分较高(10~18),生态环境状况恶劣,需对其进行综合治理,防止其扩张影响人类正常生产生活的区域。从敏感性管控分区的空间分布来看,其呈现出“西高东低”“北高南低”“城区高郊区低”的空间分异规律。其中,生态环境优化区主要集中分布在中国东部区域的中南、华东和东北地区,而生态环境管控区和治理区则主要集中分布在西部区域的西北、西南地区和北部区域的华北地区。从其空间分布结果来看,中国西部、北部地区与城区的生态环境状况仍然严峻,生态环境综合整治与管控仍是当前该区域生态文明建设的主要任务之一,其应严格遵守国家生态环境保护相关政策,积极做好国土空间规划生态红线划定工作等。
4.2 研究结果不确定性
本文从综合生态环境系统视角出发,从自然生态系统、自然—社会复合生态系统和社会生态系统3个方面构建了基于GIS和RS的中国陆地生态敏感性空间分析评价模型,并根据指标因子选取因地制宜、综合性、系统性和主导性等原则,重点遴选了中国陆地生态敏感性评价指标因子,使其具有宏观性、大范围、长时间序列对比分析等特点。但本文在微观视角更加详细的空间差异性分析方面仍存在不足之处,且由于生态敏感性本身的复杂性以及评价因子之间有相互影响、相互作用这一过程,涉及生态、环境、农业、经济、社会等一系列领域,需综合不同领域、不同学科、不同方法和不同思路,并从每个细节认真研究加以解决。这还需在今后的研究中逐步探索解决。
5 结论
(1)本文通过运用全排列多边形图示指标法对中国长时间序列的生态敏感性状况进行研究,结果表明:2000—2018年间中国陆地生态敏感性波动下降,从2000的0.342下降到2018年的0.333。这表明21世纪以来,中国生态环境的治理使得陆地生态环境敏感性状况正在逐步好转。
(2)从敏感性波动变化特征来看,2000—2018年间中国陆地生态敏感性变化强度>0的区域面积占国土面积的31.2%,且敏感性波动上升的区域占国土面积的8.06%。这表明在全球生态环境剧烈变化的大背景下,中国生态环境的治理与预防工作依然任重道远。
(3)中国陆地生态敏感性空间异质性显著,呈现出“东低西高,南低北高”“城区高,郊区低”的空间分布格局。其中,中国西部区域和北方区域生态敏感性高的主要原因是该区域自然环境恶劣,生态承载力低,生态弹性也较低,易受外界因素的影响。而城区虽然自然环境状况较好,生态承载力较高,但由于人类活动的影响,生态弹性较低,敏感性反而较高。
(4)中国陆地生态敏感性空间分布主要受土壤(地)环境状况影响,而人类干扰因素影响相对较低。但值得注意的是,2000—2018年间,人类干扰因素的影响力在逐年增加,这表明在经济快速发展,城镇化与工业化取得巨大成就的同时,人类活动对生态环境系统的干扰程度也在逐步提升。这也表明生态环境保护制度的健全与完善,人类生产生活活动的行为规范是迫在眉睫、必不可少的,需引起人们的高度关注。
参考文献
Complexity and climate
DOI:10.1126/science.284.5411.105 URL [本文引用: 1]
Spatial heterogeneity and formation mechanism of eco-environmental effect of land use change in China
DOI:10.11821/dlyj020180659
[本文引用: 1]

The complex physical elements, socioeconomic elements, regional development strategies, and policy adjustments have formed China's current unbalanced spatial economic development pattern, spatial land use pattern, and spatial eco-environmental quality pattern. The unclear eco-environmental quality formation mechanism would limit the sustainable land use and the effective conservation of the ecological environment in China. Few studies have examined the spatial heterogeneity and the formation mechanism of China's eco-environmental quality at the national scale. This paper uses the eco-environmental quality index method to measure the eco-environmental effects of land use/land cover change (LULCC) to provide an overall review of eco-environmental quality index under complex physical and socioeconomic circumstances in China. We analyze the spatiotemporal evolution features and formation mechanism of eco-environmental quality from 1995 to 2015 with the gravity center analysis method, hot-spots analysis tool (Getis-Ord Gi*), and Geo-detectors tool. The results are as follows: (1) The eco-environmental quality of the eastern monsoon region is higher than that of the alpine region of the Qinghai-Tibet Plateau and the arid region of northwest China. The low-value regions of the eastern monsoon region are mainly distributed in urban areas with dense population and economic agglomeration. The gravity center of eco-environmental quality during the study period moves toward the northwest of China continuously; (2) The hot-spots areas of eco-environmental quality change during 1995-2015 are mainly distributed in Tibet, Xinjiang, Chongqing, Guizhou, and the provinces located in the Loess Plateau (Qinghai, Gansu, Ningxia, Inner Mongolia, Shanxi, Shaanxi, and Henan). The cold-spots areas are mainly distributed in the provinces along the Yangtze River Economic Belt and the coastal regions in the southeast of China. The cold-spots and hot-spots changes in China's eco-environmental quality are closely related to the regional development strategies and the implementation of ecological conservation projects in China; (3) Land use intensity has a stronger effect on the eco-environmental quality than other factors, and the impacts of socioeconomy, traffic road, geographic location in the eastern monsoon region are stronger than those in the alpine region of the Qinghai-Tibet Plateau and the arid region of northwest China; (4) The interactions between physical elements and socioeconomic elements are stronger than the interactions within individual indicators. The interactions between the influencing factors mainly include nonlinear enhancement and bi-factor enhancement, and nonlinear enhancement is the dominant interaction mode.
中国土地利用变化生态环境效应的空间分异性与形成机理
An assessment of China's ecological environment quality change and its spatial variation
中国生态环境质量变化态势及其空间分异分析
Comprehensive evaluation and spatial-temporal changes of eco-environmental quality based on MODIS in Tibet during 2006-2016
基于MODIS的2006—2016年西藏生态质量综合评价及其时空变化
Evaluation of ecological sensitivity in Karamay, Xinjiang, northwest China
新疆克拉玛依市生态敏感性研究
Evaluation of ecological sensitivity of mineral resources city under economic transformation
经济转型视角下矿产资源城市生态敏感性评价
Eco-environmental sensitivity and its spatial distribution in Gansu Province
甘肃省生态环境敏感性评价及其空间分布
Evaluation of ecological sensitivity in China
中国生态环境敏感区评价
GIS-based assessment and division on eco-environmental sensitivity in the Heihe river basin
基于GIS的黑河流域生态环境敏感性评价与分区
Theoretical framework and model design for ecological sensitivity assessment: A case study of Shaanxi province
DOI:10.11821/dlyj020181415
[本文引用: 1]
As human activities continue to occupy ecological space in breadth and depth, ecosystems are facing potential risks from structural damage to functional disorder on the whole. Moreover, the continuous decline of sustainable supply capacity of ecosystem services has a profound impact on human well-being and ecological security. Ecological sensitivity assessment (ESA) can provide decision-making basis for controlling ecological risk and ensuring regional ecological security. However, the current methods of ESA have suffered a lot of criticisms, especially in the framework of ES-LUCC. Hence, we develop the theoretical framework and design the model of ESA to overcome the defects of existing methods based on the definition of ecological sensitivity and economic theory. In this paper, the substitution matrix of odds ratio about land use transition is considered as the sensitive factors instead of that of land area. And then ecological sensitivity index is designed by the absolute value of actual value divided by predicted value of ESV. The results show that the method of ecological sensitivity assessment designed in this paper can not only observe the regional sensitivity factors, but also identify sensitive zones effectively and it still has strong applicability and robustness in small scale. In the list of the most sensitive factors, the negatively ecological factors dominate the ecosystem services such as grassland→cultivated land due to the internal economic driving and the lack of external ecological regulation from 1990 to 2000 in Shaanxi province. However, the Grain for Green Project contributes positively ecological factors to the most sensitive factor such as cultivated land→forestland and cultivated land→grassland in the northern part of the province. Due to the implementation of many water conservancy projects in southern Qinling-Daba Mountains and Guanzhong area, the sensitivity factor coefficient of grassland→water factor is relatively high. The overall sensitivity of the study area presents the basic pattern of orderly interval "Low-High" from south to north, and shows a state of spatial agglomeration and temporal stability. The high-sensitivity areas are mainly distributed along the Qinling Mountains and Ziwuling-Huangling Mountains, and the low-sensitivity areas are mainly in the Guanzhong Plain and the central zone of Yulin city. It is urgent to adjust unreasonable land use distribution and construct an ecological screen according to ecological sensitivity for realizing harmonious coexistence between human and nature.
区域生态敏感性评估的理论框架与模型设计: 以陕西省为例
Coastal wetland ecosystem sensitivity evaluation method research
滨海湿地生态系统敏感性评价方法研究
GIS-based integrated evaluation of environmentally sensitive areas (ESAs) for land use planning in Langkawi, Malaysia
DOI:10.1016/j.ecolind.2015.09.029 URL [本文引用: 2]
RS and GIS-based assessment for eco-environmental sensitivity of the Three Gorges reservoir area of Chongqing
三峡库区重庆段生态与环境敏感性综合评价
Eco-sensitivity assessing and protecting policy in the complex geomorphic region: A case study of Qinzhou city in Guangxi
复杂地貌区域生态敏感区综合评价与保护对策: 以广西钦州市为例
Ecological sensitivity of Jingnanxia-Heishanxia reach of Yellow river
Aiming at the ecological problems such as soil erosion, desertification, and salinization in the Jingnanxia-Heishanxia reach of Yellow River, the single-factorial ecological problem's sensitivity and the comprehensive ecological sensitivity of the reach were analyzed by GIS spatial analysis, grid computing and superposition, and RS image feature extraction. The results showed that the regions with medium- and high ecological sensitivities almost covered the whole study area, including the Wufo Town of Jingtai County, the Beiwan Town, Wulan Town, Mitan Town, Dongwan Town, and Santan Town of Jingyuan County, and the area between Doucheng and Hongliutan of Pingchuan District. The high, medium, and low sensitive areas should be accordingly programmed as forbidden, medium, and deep constructing areas. During the development process of regional hydropower, effective measures should be adopted to protect the ecological environment to achieve the sustainable development of the drainage area.
黄河靖南峡—黑山峡河段的生态敏感性
Spatiotemporal changes of land desertification sensitivity in the arid region of Northwest China
DOI:10.11821/dlxb202009010
[本文引用: 1]
The sensitivity assessment of land desertification is one of important contents of monitoring, preventing and controlling desertification. This paper took the arid region of Northwest China as the study area. Based on the RS and spatial analysis technology of GIS, we built a comprehensive index system of desertification sensitivity for evaluation on "soil-terrain-hydrology-climate-vegetation". The spatial distance model (SDM) was used to calculate the desertification sensitivity index (DSI). Then, spatiotemporal change of land desertification sensitivity in the study area covering 2000, 2005, 2010 and 2017 was quantitatively assessed. On this basis, the main driving factors were analyzed by using the geographic detector. The results showed that: (1) terrain, soil, climate, vegetation and hydrology affected each other, which were the basic conditions for the distribution and changes of sensitivity to desertification in the study area. (2) On the whole, the desertification sensitivity showed a distribution pattern of low around and high inside. The low sensitivity regions were mainly distributed in the five major mountain ranges (i.e. Altai Mountains, Tianshan Mountains, Kunlun Mountains, Altun Mountains and Qilian Mountains), and Junggar Basin, Tarim Basin and Inner Mongolian Plateau belonged to the high sensitivity regions, including the back-land of Taklamakan Desert, Badain Jaran Desert and Tengger Desert. Besides, the spatial distribution of desertification sensitivity had obvious regionality, and high and low sensitivity regions had clear boundary and concentrated distribution. (3) In terms of spatiotemporal evolution, changes of desertification sensitivity since 2000 was mainly stable type, and the overall sensitivity showed a slow decrease trend, indicating that the potential desertification regions decreased year by year and some achievements had been made in the control of regional desertification. (4) Among the driving factors affecting study area, soil and climate played a direct role, which were the most important influencing factors, and vegetation was the most active and basic factor that changed desertification sensitivity. In addition, topography and hydrology played a role in restricting the changes of desertification sensitivity, while socio-economic factors were affecting the regional desertification sensitivity, and their effects were gradually strengthened. In general, desertification has been effectively controlled in the study area, and positive results have been achieved in desertification control. However, against the backdrop of intensified global climate change and new normal of socio-economic development, the monitoring, assessment and control of desertification in China still have a long way to go.
中国西北干旱区土地沙漠化敏感性时空格局
China's eco-environmental sensitivity and its spatial heterogeneity
中国生态环境敏感性及其区域差异规律研究
GIS-based assessment on sensitivity to land desertification in Gansu Province
基于GIS的甘肃省土地沙漠化敏感性评价
The comprehensive evaluation of regional resources and environmental carrying capacity based on PS-DR-DP theoretical model
DOI:10.11821/dlxb201902010
[本文引用: 4]
There are many achievements on the state evaluation of resources and environmental carrying capacity. Most of the studies use the traditional analysis method together with the "Pressure-State-Response" model. This article first constructs a comprehensive evaluation framework system of regional resources and environmental carrying capacity. Then it builds the "PS-DS-DP" hexagon interactional theory model and divides the carrying capacity into three pairs of interaction forces, namely "Pressure-Support", "Destructiveness-Resilience" and "Degradation-Promotion", which correspond to resources supporting ability, environmental capacity and risk disaster resisting ability, respectively. The negative load of carrying capacity includes pressure, destructiveness and degradation, while support, resilience and promotion represent the positive ones. With the changes of the shape and area of the hexagon caused by the interaction forces, the state of regional resources environmental carrying capacity could be measured. This study figures out that the state value of carrying capacity is equal to the ratio of the positive contribution value to the negative contribution value. The regional load condition shows good if the ratio is over 1, and the bigger the better. Once the ratio is less than 1, it has to be warned. Regional carrying capacity rating standards in this paper are delimited by 4 levels: Ⅰ(≤0.30), Ⅱ(0.30-0.70), Ⅲ(0.70-0.85) and Ⅳ(≥0.85) corresponding to a lower level balance load for a region with an approximate stable state, an unstable state caused by the high speed increasing, an ideal carrying capacity of an approximate stable state, and a full load with the system collapse. A perfect state is not to reach the limit while remaining the system stable. Based on the above theoretical models and the earlier achievements, this research applies the classified-array polygon method to explore the state change of resources environmental carrying capacity of Beijing from 2010 to 2015. According to the general research hypothesis, the increasing population will add to the regional resources pressure. But Beijing's resource pressure has a slight decrease as the city's population grows, which differs from the conclusions that the city was overloaded. The result shows that Beijing is getting close to a perfect state. The state value of carrying capacity was 1.0143 in 2010 and increased to 1.1411 in 2015, suggesting that Beijing's carrying capacity turned better in 2010-2015. Compared to 2010, the negative factor forces became weakened and the positive ones continued to enhance in 2015. With the average rank value achieving 0.7025 in 2015, Beijing reached the optimal load threshold and still had space for further carrying. Finally, these results give a theoretical support for Beijing to control the population within 23 million by 2020.
基于PS-DR-DP理论模型的区域资源环境承载力综合评价
Urban land intensive use assessment based on the entire-array-polygon indictor method
基于全排列多边形图示指标法的西宁市土地集约利用评价
Evolution and operating orientation of Chinese urbanization strategies
我国城镇化战略的演进轨迹和操作取向
Spatiotemporal characteristics of fractional vegetation coverage and its influencing factors in China
中国植被覆盖度时空特征及其影响因素分析
Spatial distribution characteristics and influencing factors of eco-environmental quality based on RS and GIS in Shiyang River Basin, China
基于RS和GIS的石羊河流域生态环境质量空间分布特征及其影响因素
Evaluation of the natural attenuation capacity of urban residential soils with ecosystem-service performance index (EPX) and entropy-weight methods
DOI:S0269-7491(17)35336-8
PMID:29558656
[本文引用: 1]
Soils provide the service of attenuating and detoxifying pollutants. Such ability, natural attenuation capacity (NAC), is one of the most important ecosystem services for urban soils. We improved the ecosystem-service performance index (EPX) model by integrating with entropy weight determination method to evaluate the NAC of residential soils in Beijing. Eleven parameters related to the soil process of pollutants fate and transport were selected and 115 residential soil samples were collected. The results showed that bulk density, microbial functional diversity and soil organic matter had high weights in the NAC evaluation. Urban socio-economic indicators of residential communities such as construction age, population density and property & management fee could be employed in kinetic fittings of NAC. It could be concluded urbanization had significant impacts on NAC in residential soils. The improved method revealed reasonable and practical results, and it could be served as a potential measure for application to other quantitative assessment.Copyright © 2018 Elsevier Ltd. All rights reserved.
Eco-environmental quality assessment of Ruoergai County in Sichuan Province based on multi-sources remote sensing data
四川省若尔盖县生态环境质量评价
Research on the spatial quantitative evaluation and coupling coordination degree of ecological carrying capacity in Gansu Province
甘肃省生态承载力空间定量评价及耦合协调性
Method for remote sensing monitoring of desertification based on MODIS and NOAA/AVHRR data
基于MODIS和NOAA/AVHRR的荒漠化遥感监测方法
Remote sensing monitoring and spatial-temporal characteristics analysis of soil salinization in agricultural area of northern Xinjiang
北疆农区土壤盐渍化遥感监测及其时空特征分析
Remote sensing monitoring models of soil salinization based on NDVI-SI feature space
基于NDVI-SI 特征空间的土壤盐渍化遥感模型
The indices and the evaluation method of eco-city
生态城市指标体系与评价方法
Temporal and spatial evolution of ecological sensitivity in arid inland river basins of northwest China based on spatial distance index: A case study of Shiyang River Basin
基于空间距离指数的中国西北干旱内陆河流域生态敏感性时空演变特征: 以石羊河流域为例
Geodetector: Principle and prospective
DOI:10.11821/dlxb201701010
[本文引用: 3]
Spatial stratified heterogeneity is the spatial expression of natural and socio-economic process, which is an important approach for human to recognize nature since Aristotle. Geodetector is a new statistical method to detect spatial stratified heterogeneity and reveal the driving factors behind it. This method with no linear hypothesis has elegant form and definite physical meaning. Here is the basic idea behind Geodetector: assuming that the study area is divided into several subareas. The study area is characterized by spatial stratified heterogeneity if the sum of the variance of subareas is less than the regional total variance; and if the spatial distribution of the two variables tends to be consistent, there is statistical correlation between them. Q-statistic in Geodetector has already been applied in many fields of natural and social sciences which can be used to measure spatial stratified heterogeneity, detect explanatory factors and analyze the interactive relationship between variables. In this paper, the authors will illustrate the principle of Geodetector and summarize the characteristics and applications in order to facilitate the using of Geodetector and help readers to recognize, mine and utilize spatial stratified heterogeneity.
地理探测器: 原理与展望
