柏中强 , 王卷乐, 杨雅萍
BAI Zhongqiang, WANG Juanle, YANG Yaping
通讯作者:
收稿日期: 2014-08-17
修回日期: 2015-05-4
网络出版日期: 2015-08-20
版权声明: 2015 《地理学报》编辑部 本文是开放获取期刊文献,在以下情况下可以自由使用:学术研究、学术交流、科研教学等,但不允许用于商业目的.
基金资助:
作者简介:
作者简介:柏中强, 博士, 主要从事区域人口格网化时空模拟。E-mail: baizq@lreis.ac.cn
展开
摘要
人口空间分布具有典型的尺度特征,精细尺度的人口分布是当前人口地理学研究的热点和难点。乡镇(街道)是中国人口普查数据公开发布的最小行政单元,乡镇级人口密度计算及其分布特征研究能够更客观、精细地刻画中国人口分布的空间格局和态势,为促进中国人口的合理优化布局提供科学依据和决策支持。本文收集处理了2000年中国25个省(直辖市、自治区)的乡镇(街道)级行政边界数据,基于第五次人口普查乡镇(街道)人口统计数据,计算了乡镇级平均人口密度。采用Lorenz曲线、空间分析及样带分析的方法,分析了研究区乡镇(街道)人口分布的疏密结构、空间集聚性、纬向和经向规律。利用相关分析和逐步回归分析,分省探究了地形起伏度、水网密度、路网密度及社会经济发展水平(利用夜间灯光指数表征)等4个因素对于乡镇级人口分布的影响。研究表明:① 乡镇级平均人口密度能够有效区分出县域内部的人口密度高低差异,整体不均衡性高于基于县级平均人口密度的研究结果;② 乡镇(街道)人口分布总体规律是西北稀疏东南密集,同时,东南密中有疏,西北疏中有密;③ 乡镇(街道)人口分布的经纬向规律变异较大,既受中国三级阶梯地貌大势的影响,也受局部微地形及区域中心城市的影响,并和海岸线、交通枢纽及大江大河的分布具有一定的空间耦合性。④ 乡镇级平均人口密度与地形起伏度、水网密度、路网密度及夜间灯光指数等显著相关,省级平均相关系数分别为-0.56、0.28、0.61、0.69。⑤ 在乡镇尺度上,地形条件及区域发展水平对辽、吉、京、津、沪、冀、豫、陕、晋、鲁、皖、苏、湘、鄂、赣、浙、闽、粤、琼等省份的人口分布具有较强的决定作用。⑥ 对于藏、青、蒙、滇、黔等5省或自治区,需要引入更多的自然环境及社会因素来解释其人口分布的特殊规律。本研究扩充了中国人口地理学的研究尺度和维度,并引入了新的定量分析和空间分析方法,所构建的覆盖中国25省(直辖市、自治区)的乡镇(街道)级人口分布科学数据集丰富了中国人口地理学的2000年本底数据资源。
关键词:
Abstract
Spatial pattern of population distribution has a typical character of scale dependency. Fine-scale estimation of the population distribution has been a huge challenge in the field of population geography. In China, township is the finest administrative unit in official population census data. Thus, population density data at township level can be used to describe and characterize the population spatial pattern and changes elaborately, and support optimized layout plan of Chinese population, and government policy decision making. Township boundaries across 25 provinces in China had been collected in this study. The 5th national population census data was spatially joined to the boundary layer for population density calculation. Methods of Lorenz curve, geo-spatial analysis, and latitude/longitude transect had been applied to reveal the agglomeration degree, spatial patterns of population distribution with latitude and longitude. Based on the correlation and stepwise regression analysis, four variables, including relief degree of land surface (RDLS), water system density (WSD), road system density (RSD) and nighttime light index (NTL), were introduced to check the variety of population distribution in each province. The results showed that: (1) the variety of population distribution can be distinguished clearly by the mean population density on township scale than that of county level. (2) The overall population distribution can be characterized as dense in the southeast and sparse in the northwest, while lower population density occurs in some part of southeastern China, and vice versa. (3) The population density at township level along six designed longitude and latitude transects varies greatly. The possible impact factors include the three-level landscape features, local topography, regional economy, and the proximity to coastline, transportation hub, and hydrological systems. The correlation coefficient at provincial level, between the RDLS, WSD, RSD, NTL, and the population density has been identified as 0.56, 0.28, 0.61, and 0.69, respectively. At township level, topography and economy exert more impacts on population distribution in Liaoning, Jilin, Beijing, Tianjin, Shanghai, Hebei, Henan, Shaanxi, Shanxi, Shandong, Anhui, Jiangsu, Hunan, Hubei, Jiangxi, Zhejiang, Fujian, Guangdong, and Hainan. In addition to the four factors mentioned above, it is necessary to introduce more natural or social factors to explore the population distribution pattern in Tibet, Qinghai, Inner Mongolia, Yunnan, and Guizhou. This study expanded the research scale and dimension of the research in population geography research in China. The resulted population density dataset in 2000 is expected to enrich the baseline data resources for population geography development in China and the world.
Keywords:
人口分布是指人口在某一特定时间内于某一地理空间的集散状态,或称之为人口的空间形式。人口密度是表现人口分布最主要的形式和衡量人口分布地区差异的主要指标[1],其空间分布格局及演变过程与气候、资源及环境等要素关系密切,具有典型的尺度特征[2]。中国幅员辽阔,自然环境和资源禀赋差异显著,人口众多,区域社会经济发展不均衡。
科学刻画中国人口分布状况及格局,揭示自然环境和社会经济因素对于人口分布的影响,对于深入理解人口分布规律和人地关系,协调区域发展和生态环境保育具有十分重要的指导意义。
1935年,中国人口地理学家胡焕庸提出了黑河(瑷珲)—腾冲一线,生动刻画了中国东南和西北人口分布疏密差异之悬殊[3]。葛美玲等利用第5次人口普查分县数据分析了2000年中国人口分布格局,与胡先生的研究结果对比,2000年中国人口分布大势依然是西疏东密,未有根本改变[4]。多年来,学界利用人口密度、人口分布重心、人口集聚度、人口潜力、人口分布不均匀性等指标对人口分布状况进行了深入研究,例如刘德钦等采用人口地理信息系统对分县人口密度、人口潜力等进行了三维显示[5];韩嘉福等利用经济学中的Lorenz曲线对中国人口空间分布的不均匀性进行分析及制图[6];葛美玲等基于人口密度分级的多圈层叠加分析表明,中国人口分布总体上是从高密度区向低密度区过渡的[7];刘睿文等分析了中国人口空间分布的集疏格局[8]。对于人口分布与自然环境及社会经济因素的关系研究可分为两个方面。一方面是探讨人口分布与自然因素的关系,以服务于人口承载力及人居环境评价,例如高志强等分析了土地资源、生态环境质量与人口分布的关系[9];封志明等分析了地形起伏度与人口分布的相关性[10];樊杰等分析了经济人口重心的耦合态势及其对区域发展的影响[11];方瑜等分析了以年均温、年均降水量、干燥度、地表粗糙度、距海岸线距离等16个指标组成的自然因素组合与人口分布的关系[12]。另一方面则是为了人口分布空间化建模而确立人口与相关因素的数量关系,如刘纪远等考虑净初级生产力(NPP)、数字高程、城市和交通基础设施空间分布等因素,模拟了中国人口空间分布[13];田永中考虑土地生产力与人口的相关性,分县、分城乡、分区建模来模拟人口分布[14];卓莉等分析了夜间灯光影像灯光强度与人口分布的关系[15]。这些研究多是基于县级单元尺度进行的空间分析或统计建模。在省级尺度上,吕安民等研究了人口增长率及其空间关联关系[16];马妍等基于聚类分析研究了中华人民共和国成立60年以来的中国省级人口时空演变过程[17];邓羽等考虑自然增长和人口迁移,研判了中国人口空间格局的发展情景和演化特征[18]。近年来,结合智慧城市、城市格网管理等发展需求,在精细化信息获取技术的支持下,乡镇尺度的人口数据获取与分析受到关注,乡镇级尺度的人口地理学研究逐渐得到关注,如张志斌等研究了1982-2009年兰州乡镇(街道)级城市人口空间结构演变格局及调控路径[19],梁昊光等分析了2000-2010年北京乡镇街道尺度人口变化格局特征,并借助CA-MAS对未来城市人口分布格局进行情景模拟[20]。
由上可见,当代人口地理学研究主题和可持续发展、资源短缺、生态退化及城镇化等问题的联系越来越紧密,空间化、定量化、精细化分析为人口地理学发展增加了新的活力[21-24]。其中,人口数据空间化是21世纪人口地理学研究的前沿领域之一[25],包括全球、洲际及国家尺度的数据集生产与发布[26-29],多种人口分布模拟方法的发展[30-32],以及作为从基础输入数据辅助于灾害风险评估与救援、健康科学及气候变化影响评估等研究[33-34],这些研究反映出的热点和难点在于人口分布的精细化模拟,包括支撑这种模拟的基础数据获取、精细尺度下人口分布规律研究及结果验证等[35-36]。
不同尺度的人口问题需要相应尺度的数据支持。当前,中国的人口地理学研究尺度以省级和县级为主,乡镇级尺度的人口地理研究需求越来越强。这主要在于:① 乡镇(街道)处于中国行政体系的基层位置,是人们开展生活和生产的基础单元,较县域单元反映出更多的空间异质性;② 乡镇(街道)是中国人口普查数据发布的基本单元,普查数据包含众多人口指标,能更精确客观地反映中国的人口地理国情;③ GIS和遥感技术,尤其是高分影像的广泛运用,大幅提升了人口空间分布表达的空间分辨率和精度,乡镇级人口统计数据的估计有了更新、更快的遥感信息源支撑;④ 人口密度与分布格局、变化过程存在尺度依赖关系,可塑性面积单元问题直接导致了不同尺度的人口密度所刻画的人口分布规律相互冲突[37],乡镇尺度的人口分布研究作为县级行政单元和公里格网人口分布的一种补充是不可或缺的。基于以上认识,本文针对21世纪的本底年,以2000年为基准,收集处理了中国25省乡镇级行政界线数据,利用国家统计局发布的第五次人口普查乡镇(街道)级人口普查数据,计算乡镇平均人口密度,从比例结构、空间集聚性和经纬向规律三方面分析其空间分布特征,并选取在县级尺度上被关注较多的地形起伏度、路网密度、水网密度及夜间灯光等4个影响人口分布的地理环境因子,探讨它们在乡镇尺度上与人口分布的关系。预期通过本研究能从乡镇(街道)尺度发掘中国人口的基本分布格局和空间分异特征,发展小尺度人口地理学的定量分析和空间分析方法,丰富中国人口地理学的2000年本底乡镇(街道)级科学数据集,为人口分布精细尺度模拟和相关人口管理提供科学依据和决策支持。
乡镇界线数据来源于国家科技基础条件平台—地球系统科学数据共享平台(http://www.geodata.cn/Portal/metadata/viewMetadata.jsp?id=100101-46)。该数据集是全国各省区乡镇界线的数字化成果,数据来源、时间和比例尺不完全相同,资料收集以1:25万、2000年的数据为参考原则,数据质量总体良好。黑龙江、广西、甘肃、新疆四省区暂无数据,四川、重庆数据可用性差,剔除之后,本研究的乡镇界线数据覆盖辽宁、吉林、内蒙古(部分地区)、北京、天津、上海、河北、河南、陕西、山西、山东、安徽、江苏、浙江、湖南、湖北、江西、浙江、福建、广东、海南、云南、贵州、青海、西藏等25个省(直辖市、自治区)。香港、澳门、台湾地区未包含在内。人口统计数据来源于国家统计局发布的全国第五次人口普查乡、镇、街道数据(2000年)(http://www.stats.gov.cn/tjsj/ndsj/renkoupucha/2000jiedao/jiedao.htm)。
数字高程模型(DEM)数据来源于USGS和NASA联合发布的GLS2005数据集中的GLSDEM数据集,空间分辨率为90 m。交通道路和河流水系数据来源于国家测绘局发布的1:25万全国基础地理矢量数据库(2002年版)。夜间灯光数据来源于美国国家航空航天局地球物理数据中心,空间分辨率约为850 m(http://www.ngdc.noaa.gov/eog/dmsp/downloadV4composites.html)。
2.2.1 数据预处理 本研究中的空间数据统一采用Albers Equal Area投影,地理参考为WGS84坐标系。乡镇界线数据的预处理包括坐标系转换、调整投影等。DEM数据的预处理包括拼接、裁剪等,并重采样到100 m。夜间灯光数据经裁剪和重投影等预处理后,重采样到100 m以减少统计误差。
2.2.2 数据关联 以2000年中国分省行政界线为基准,结合全国县界数据,分省进行几何精校正(各省约选取350到500个配准点)。在ArcGIS中,利用手动编辑功能,将省界周围的乡镇级行政界线调整与省界一致。由于所选25个省的乡镇级行政界线数据表征时间从1999-2003年不等,需结合行政变迁及第五次人口普查数据记录的行政单元信息,对行政界线或普查数据进行查错和合并。调整一致后,将属性数据(乡镇(街道)级人口统计数据)与空间数据(乡镇(街道)级行政界线)通过乡镇代码关联,共得到28 252个乡镇街道单元,总人口数为991 293 629人。需要说明的是,青海、西藏缺少部分县的乡镇街道数据(共计22县),考虑到该地区人烟稀少,缺少的部分用县级行政界线补充。
2.2.3 人口密度计算 乡镇平均人口密度(人/km2)计算公式如下:
式中:PD为人口密度(人/km2);Np为乡镇(街道)人口数量(人);A为乡镇(街道)面积(km2)。
2.2.4 地形起伏度计算 地形起伏度(Relief Degree of Land Surface, RDLS),又称地表起伏度,是区域海拔高度和地表切割程度的综合表征[38]。基于DEM数据,采取以下公式计算地形起伏度:
式中:RDLS为地形起伏度;ALT为某一栅格单元为中心一定区域内的平均海拔高度(m);Max(H)和Min(H)分别为区域内的最高与最低海拔(m);P(A)为区域内坡度小于等于5°的地域面积(称为平地,km2);A为区域总面积,在本研究中确定1 km×1 km栅格为基本评价单元,则A值为1 km2。ALT、Max(H)、Min(H)通过ArcGIS空间分析模块中的Neighborhood模块实现,P(A)通过Slope和Reclass命令实现,RDLS通过Map Algebra模块计算实现。
2.2.5 河网密度计算 河网密度(Water system density, WSD)计算公式如下:
式中,WSD为河网密度(km/km2);Nw为各乡镇单元内的总河流长度(km);A为各乡镇单元面积。Nw利用ArcGIS中的intersection和summarize命令提取。
2.2.6 路网密度计算 路网密度(Road system density, RSD)计算公式如下:
式中:RSD为路网密度(km/km2);Nr、Nne、Npe、Ncr、Ntr分别为各乡镇内铁路、国家主干道、省级公路、县道和乡道长度(km);A为乡镇单元面积。考虑到不同等级公路的运输容量和通行能力的差异,参考相关文献,将各等级道路里程换算为标准县道长度[39],式中3、3、2、1、0.4分别为铁路、国家主干道、省级公路、县道和乡道的换算系数。各道路长度利用ArcGIS中的intersection和summarize命令提取。
2.2.7 分区统计 分区统计方法采用ArcGIS中的Zonal Statistic模块,分区计算各乡镇地形起伏度和夜间灯光指数的平均值。
利用计算得到的研究区乡镇级人口密度数据,制作中国25省乡镇级人口密度图,并分区间统计不同人口密度区间的人口数量及面积,以此来分析乡镇级人口分布的基本格局及人口密度结构。利用Lorenz曲线法分析乡镇级人口分布的不均匀性。Lorenz曲线作法如下:按照乡镇平均人口密度从小到大排序,计算各乡镇的人口累积比例及面积累积比例,以人口累积比例为横轴,面积累积比例为纵轴,绘制研究区的人口分布的Lorenz曲线[40]。Lorenz曲线的弯曲程度表示人口分布的均衡性大小:曲线越接近对角线,弯曲程度越小,表示人口分布越均匀;曲线弯曲程度越大,越偏离对角线,则表示人口分布不均衡程度越严重。在此基础上,通过计算研究区人口分布的空间自相关系数(全局Moran's I指数)来判断是否存在空间集聚情况。
乡镇级人口的经向规律性和纬向规律性分析采用样带梯度分析方法。具体做法是以特定的间隔梯度为基本单元,分别计算从南到北处于不同纬度及从西到东不同经度的样带内各乡镇单元的平均人口密度。为展现具体的空间分异规律,借鉴文献[10]关于中国地形起伏度经纬向规律分析的做法,并参考南北方向中国三个人口集聚的大都市广州、上海、北京及从东到西北京、西安、拉萨三个区域中心城市所处的位置和研究区的覆盖范围,选择25.5°N、31.5°N、41°N及91°E、109°E、116.5°E为中心线,宽度为1°的缓冲区为典型样带,以经度或纬度为横坐标,以典型样带内乡镇的平均人口密度为纵坐标,将分析结果绘制于笛卡尔坐标系中。结合具体地区的地理环境本底情况,分析该区域人口密度曲线的走势、分布及峰值等。
选取地形起伏度、路网密度、水网密度及夜间灯光等4个因子,利用SPSS软件,分省分析乡镇人口密度与各因素的相关关系;以各乡镇单元人口密度为因变量,以与人口分布显著相关的因素为自变量,分省进行逐步回归分析,得到拟合方程,根据各因素对人口分布的贡献率,分析不同省份的影响机理。
图1为中国25省(直辖市、自治区)2000年乡镇级人口平均密度空间分布图。总体而言,研究区的人口密度空间分布趋势为东部高于西部,南部高于北部,最高值出现在上海市老西门街道。沿海岸线、长江三角洲、珠江三角洲、黄淮海平原、京津冀地区、北京至沈阳铁路沿线、关中平原、晋中盆地、银川平原为人口聚集地区,该区域一半以上的乡镇平均人口密度高于400人/km2;东南丘陵(包括江南丘陵、浙闽丘陵、广东丘陵等)、辽东丘陵、山东丘陵及云贵高原地区人口密度介于100~400人/km2之间,分布较均匀,偶有零星城市及其周边区域人口分布聚集,出现高值;内蒙古高原及青藏高原地区人口密度较低,大部分地区的人口密度低于25人/km2,部分地区的人口密度甚至低于1人/km2。在格局细节上,乡镇级平均人口密度对于人口分布疏密程度区分度高,不仅清晰地标识出中国主要城市圈及若干省会城市人口聚集分布格局,在各县市内部也区分出了人口密度高低差异,较县级人口密度图更为客观、详尽。
图1 2000年中国25省乡镇街道级人口平均密度分布图
Fig. 1 The population density at township level over 25 provinces in China in 2000
表1统计了不同密度区间的乡镇人口总数与面积,并计算了其比例结构。由表1可见,不同区间内的人口与面积比例严重失衡。图2是研究区人口数量和面积累积的Lorenz曲线,其弯曲程度较大,严重偏离对角线,这和图1及表1相互印证。结合表1分析图1,当人口累积总数达到37%时,累积面积百分比约为3.5%,对应800人/km2以上的人口密集区,该部分曲线几乎垂直于横坐标轴而起,对应中国都市群及城镇核心区;当人口累积达到80%时,累积面积百分约为22%,符合“二八法则”,此时对应的人口密度约为200人/km2;当人口累积达到90%时,面积累积百分比约为41%;余下的59%的面积则只积累了约10%的人口,人口密度低于50人/km2。对比韩嘉福等人基于县级数据的中国人口分布不均衡性的Lorenz曲线分析结果[41],乡镇级人口分布表现出了更大的不均衡性。
表1 人口密度各值域范围总人口及面积统计
Tab. 1 The total population and area of each population density range at township level
| 人口密度值域(人/km2) | 统计单元个数 | 总人口 | 人口占比(%) | 总面积(m2) | 面积占比(%) |
|---|---|---|---|---|---|
| 0~1 | 186 | 356016 | 0.035914 | 1201187.5 | 22.42 |
| 1~25 | 1306 | 7381681 | 0.744651 | 1147617.9 | 21.42 |
| 25~50 | 1448 | 13261169 | 1.337764 | 352827.9 | 6.58 |
| 50~100 | 3520 | 45756518 | 4.615839 | 621186.9 | 11.59 |
| 100~200 | 5353 | 104297661 | 10.52137 | 726212.1 | 13.55 |
| 200~400 | 6101 | 178520688 | 18.00886 | 621046.8 | 11.59 |
| 400~600 | 4137 | 160010916 | 16.14163 | 326480.6 | 6.09 |
| 600~800 | 2506 | 118583652 | 11.96252 | 172208.9 | 3.21 |
| 800~1000 | 1086 | 60013297 | 6.054038 | 68053.7 | 1.27 |
| 1000~1500 | 974 | 69480221 | 7.009045 | 58056.9 | 1.08 |
| 1500~2000 | 405 | 38712399 | 3.90524 | 22352.7 | 0.42 |
| > 2000 | 1231 | 194919411 | 19.66314 | 40953.3 | 0.76 |
图2 中国25省乡镇人口分布Lorenz曲线
Fig. 2 The population distribution of Lorenz curve at township level over 25 provinces in China
经计算,中国25省乡镇级人口密度空间自相关系数—全局Moran's I指数为0.204364,随机分布检验的标准化Z值为415.3,达到极显著水平,说明乡镇水平上人口空间分布存在一定的正自相关性,呈现出一定的空间集聚特征,即高值区和高值区相邻,低值区和低值区相邻。
图3为研究区人口密度随经度变化曲线。研究区人口密度从西向东逐渐增加(图3a),曲线的变化符合中国西部青藏高原地区人口稀少,东部平原区人口稠密,东西结合地区为低山、丘陵及谷地地区,人口密度居中的特点。
图3 研究区人口密度随经度变化图
Fig. 3 The change of population density at township level with the increase of longitude
图3b、3c、3d分别为以25.5°N、31.5°N、41°N纬度线为中心线的1°缓冲区内的乡镇平均人口密度随经度变化曲线,具体位置对应图1由南向北三条红色样带。25.5°纬线西起云南腾冲,横贯云贵高原,在110°E至111.5°E之间因缺少广西省数据,出现断裂,之后依次穿过湖南、江西、福建南部,这部分人口密度在100~400人/km2之间波动,主要地貌类型为中高山及低山丘陵,在114.5°E人口密度上升到800人/km2,对应的是区域中心城市—江西省赣州市,而到了118.5°E之后人口密度出现飙升,达到1660人/km2左右,对应的是福建莆田、福清等沿海人口密集地区。31.5°纬线西起西藏自治区札达县,从79°E至98°E均为青藏高原境内,平均人口密度小于10人/km2;98°E至109°E之间为四川省和重庆市境内,缺乏乡镇级行政界线数据,出现断裂;109°E之后依次穿过湖北西部神农架地区,襄樊谷地,到达江汉平原,人口密度从100人/km2逐渐上升至600人/km2,之后掠过大别山地区到达安徽省的合肥、芜湖等地,人口密度持续上升,向东进入江苏省境内后,经过张家港、苏锡常等地区到达上海市,人口密度陡增,出现两个峰值,生动地诠释了长三角地区人口分布稠密的特征。41°纬线西起内蒙古自治区磴口县,110°E、112°E、115°E、120°E、123°E极大值分别对应内蒙古自治区包头市、呼和浩特市和河北省张家口市及辽宁省锦州市、鞍山市等区域性人口聚集中心,东达吉林省南部边境山区时,人口密度锐减,此带内人口分布密度波动较大。
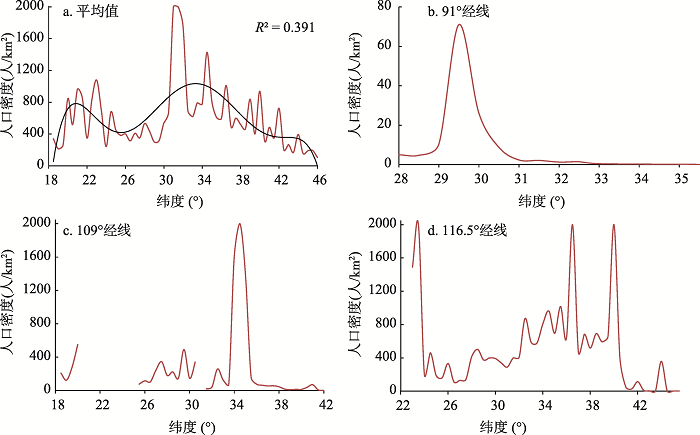
图4为研究区人口密度随纬度变化曲线。由图4a可见,中国人口分布由南向北呈现先上升,而后趋于平缓(约在400人/km2附近),在30°~33°N之间高度聚集之后,再向北呈现波动下降趋势。30°~33°N之间为中国人口密集分布地区,包含了武汉、南京、上海、杭州等大城市或城市群,该区域为长江流域的核心地区,地势平坦,降水充沛,气温适宜,适合于人类生产和生活。
图4 研究区人口密度随纬度变化图
Fig. 4 The change of population density at township level with the increase of latitude
图4b、4c、4d分别为以91°E、109°E及116.5°E为中心的1°缓冲区内乡镇人口密度随纬度变化曲线,其位置如图1中从西向东三条红色样带所示。91°E纵贯青藏高原地区,除29.5°N附近的拉萨地区人口密度约70人/km2之外,其他地区人口密度均低于5人/km2。109°E南起海南岛乐东黎族自治县,在海南岛内由南向北人口密度递增;在22°~26°N之间缺少广西省乡镇行政界线数据,曲线出现断裂;26°~30°N之间依次为贵州东部和湖北西南部山区,人口呈现波动式上升,约在100~500人/km2之间;31°N为重庆市东北部无数据区;从32°N进入秦岭山区之后,人口密度低至20人/km2左右,翻过秦岭进入关中平原的西安、铜川地区人口分布逐渐稠密,密度峰值达到4500人/km2;继续向北穿过延安地区达到内蒙古乌审旗、乌拉特旗,人口密度逐渐降低。116.5°E南起广东省潮阳、汕头地区,人口密度高达1500~2000人/km2;向北进入福建江西两省交界山区人口密度迅速降低,在100~300人/km2内波动;进入鄱阳湖盆地及大别山南麓地区之后,人口密度回升到400人/km2左右;到达32°N之后进入到淮北平原及豫东鲁西黄泛平原区,人口分布密度增加,均值在500~1000人/km2,峰值出现在山东省济南地区;向北延伸到华北平原境内,平均人口密度约600人/km2,第二个高值区出现在北京市境内,实际值约为3300人/km2;再往北人口密度锐减,除了锡林浩特市区人口密度达到300人/km2之外,其他地区人口密度均小于25人/km2。
由以上对人口分布的经、纬向规律性分析可以看出,中国人口分布由密到疏的地形依次是近海平原、内陆平原、丘陵山区、高原地区,这种疏密大势不仅和中国三级阶梯地形地貌特征吻合,还受到微地形及区域中心城市的影响。
自然地理环境和社会人文因素对于人口分布的影响是一个复杂非线性问题,需要从多维度进行分析。目前,已有许多文献在县级尺度上开展了相关研究。限于可定量获取的数据源及分析能力,本文参考的文献[10、12、15、42]等代表性研究成果,选择其中受到关注较多的地形起伏度、水网密度、路网密度和夜间灯光指数等4个因子,分别分析其对于乡镇尺度的人口分布的影响。考虑到人口密度数据具有较大变程,将人口密度取自然对数之后再进行相关分析及逐步回归分析。图5对比展现了中国乡镇平均地形起伏度(图5a)、河网密度(图5b)、路网密度(图5c)及平均夜间灯光指数(图5d)。结合图1可以看出,乡镇人口分布的高值区和地形起伏度的低值区、路网密度的高值区具有一定的空间耦合性。进一步地,利用相关分析及回归分析,分省探讨了这4个因素与乡镇级人口分布的定量关系。
图5 研究区域乡镇级平均地形起伏度(a)、河网密度(b)、路网密度(c)及平均夜间灯光指数(d)
Fig. 5 The township level average relief degree of land surface (a), water system density (b), road system density (c) and nighttime light over 25 provinces in 2000
表2分省列出了乡镇(街道)人口密度与这4个因素的相关系数。整体而言,各省的人口密度与这4个因素均存在显著相关关系,但各相关系数的正负及数值差异较大。其中,除江苏、贵州、内蒙古之外,各省的乡镇级人口密度与地形起伏度呈现较强的负相关关系,即随着地形起伏度的增加,人口密度有减少的趋势,省际间的相关系数数值差异也较大,相关系数绝对值较大的省,其省内的地形起伏相对差异也较大;而人口密度与路网密度、夜间灯光指数有较强的正相关关系,且相关系数基本大于0.5,在经济较发达的省份,人口密度与夜间灯光指数的相关系数均大于0.7;除江苏、上海之外,各省乡镇级人口密度与水网密度成一般正相关关系,江苏、上海两省则呈现负相关关系。可见,在乡镇尺度上,人口倾向聚集于海拔较低、地表起伏不大、区域经济发展水平高,交通发达的地区。
表2 人口分布与自然及社会因素相关关系
Tab. 2 Correlation coefficients of population density, natural and social factors in 25 provinces
| RDLS | WSD | RSD | NTL | |
|---|---|---|---|---|
| 安 徽 | -0.632** | 0.329** | 0.547** | 0.590** |
| 北 京 | -0.727** | 0.371** | 0.732** | 0.871** |
| 福 建 | -0.766** | 0.648** | 0.402** | 0.774** |
| 广 东 | -0.697** | 0.491** | 0.631** | 0.753** |
| 贵 州 | 0.043 | 0.122** | 0.513** | 0.631** |
| 海 南 | -0.691** | 0.441** | 0.715** | 0.685** |
| 河 北 | -0.840** | 0.256** | 0.545** | 0.663** |
| 河 南 | -0.614** | 0.123** | 0.634** | 0.682** |
| 湖 北 | -0.680** | 0.490** | 0.626** | 0.661** |
| 湖 南 | -0.679** | 0.308** | 0.594** | 0.625** |
| 吉 林 | -0.441** | 0.084* | 0.595** | 0.657** |
| 江 苏 | -0.046 | -0.205** | 0.652** | 0.865** |
| 江 西 | -0.600** | 0.394** | 0.584** | 0.632** |
| 辽 宁 | -0.491** | 0.184** | 0.727** | 0.818** |
| 内蒙古 | -0.036 | 0.430** | 0.603** | 0.564** |
| 宁 夏 | -0.267** | 0.562** | 0.543** | 0.698** |
| 青 海 | -0.850** | -0.072 | 0.517** | 0.459** |
| 山 东 | -0.229** | -0.021 | 0.676** | 0.813** |
| 山 西 | -0.725** | 0.091** | 0.615** | 0.720** |
| 陕 西 | -0.773** | 0.294** | 0.662** | 0.722** |
| 上 海 | 0.692** | -0.711** | 0.730** | 0.829** |
| 天 津 | -0.158* | -0.131 | 0.593** | 0.831** |
| 西 藏 | -0.358** | 0.493** | 0.594** | 0.381** |
| 云 南 | -0.368** | 0.299** | 0.589** | 0.617** |
| 浙 江 | -0.820** | 0.522** | 0.586** | 0.745** |
计算表2中显著水平p值为0.01的各省的人口密度与地形起伏度、水网密度、路网密度和夜间灯光指数相关系数的平均值,分别为-0.53,0.28,0.61,0.69。可以认为,地形起伏度、路网密度和夜间灯光指数对人口分布具有较强的影响。地形起伏度表征了最基本的自然地理特征,影响土壤与植被的形成与发育过程,反映土地利用与土地质量的优劣,总体制约着区域自然生产力水平和人居环境质量[43]。路网密度反映区域与外部的交流能力和区域内部通达水平,平均夜间灯光指数表征区域经济总量[44-45],由于许多农村地区夜间灯光指数为0,可将平均夜间灯光指数和路网密度结合起来反映区域经济发展水平。由平均相关系数可知,区域发展水平对于人口分布的影响比自然环境因素更大。可以预见,随着中国城镇化进程加速,人口将近一步向区域经济发展水平更高,交通更为便利的区域聚集。
为量化各因子对于人口分布的影响大小,多维度区分不同省份的主导因子,利用逐步回归分析法,在各省选择显著相关的因子,建立人口密度与这几个因子的拟合方程。各因素进入回归方程的显著性p值设为0.05,剔除的显著性p值设为0.1。方程最终表现形式中,各因子按照标准化系数绝对值大小评定其贡献大小,顺序出现在方程中。
表3列出各拟合方程的具体形式及主要参数。各方程引入的变量通过T检验,显著性p值小于0.001,表明拟合是可信的。各省拟合方程中,除贵州、内蒙古、青海、西藏、云南等5省区之外,平均调整后决定系数(adj_R2)约为0.72,拟合方程的标准估计误差(SEE)约为对应区域统计数据标准差的1/3到3/4,表明这种拟合是高效的,且方程中的因子可解释各省区的人口密度格局80%以上的成因。贵州、内蒙古、青海、西藏、云南等5省区的调整后决定系数小于0.5或标准估计误差大于整个研究区的标准估计误差,推测其主要原因是:云贵高原大部分属于高山深谷区,具有独特的垂直人口分布景观;内蒙古和青藏高原地区人口分布更多地受气候和植被覆盖等自然条件的制约,人口趋向于集中于生产力更高的地区[42]。对于这5个省区,需要引入更多的自然环境要素来刻画其人口分布的影响因素。
表3 人口密度与影响因素的拟合方程
Tab. 3 The fitting equations of population density and influencing factors
| 逐步回归方程 | 调整决定系数 | 标准估计误差 | |
|---|---|---|---|
| 安 徽 | 5.62-1.203*RDLS+0.047*NTL+0.306*RSD+0.083*WSD | 0.609 | 0.5383 |
| 北 京 | 5.557+0.039*NTL-1.23*RDLS+0.304*RSD-0.623*WSD | 0.821 | 0.6446 |
| 福 建 | 5.719+0.054*NTL-1.283*RDLS+0.493*WSD | 0.744 | 0.6693 |
| 广 东 | 5.735+0.036*NTL-1.535*RDLS+0.46*RSD | 0.727 | 0.6235 |
| 贵 州 | 4.679+0.109*NTL+0.281*RSD+0.11*RDLS+0.164*WSD | 0.414 | 0.5055 |
| 海 南 | 5.061+0.514*RSD-1.526*RDLS+0.059*NTL | 0.752 | 0.4864 |
| 河 北 | 6.041-1.365*RDLS+0.043*NTL-0.266*WSD+0.15*RSD | 0.814 | 0.4604 |
| 河 南 | 5.954+0.054*NTL-1.163*RDLS+0.254*RSD+0.098*WSD | 0.736 | 0.4158 |
| 湖 北 | 5.6-0.755*RDLS+0.068*NTL+0.378*RSD | 0.709 | 0.5052 |
| 湖 南 | 5.81-1.09*RDLS+0.063*NTL+0.318*RSD | 0.67 | 0.5171 |
| 吉 林 | 4.29+0.076*NTL-1.097*RDLS+0.708*RSD+0.384*WSD | 0.563 | 0.7151 |
| 江 苏 | 5.968+0.05*NTL-2.145*RDLS+0.109*RSD | 0.759 | 0.5119 |
| 江 西 | 5.3-1.11*RDLS++0.088*NTL0.355*RSD+0.229*WSD | 0.625 | 0.5632 |
| 辽 宁 | 4.981+0.06*NTL-0.854*RDLS+0.309*RSD-0.189*WSD | 0.726 | 0.5853 |
| 内蒙古 | -1.006+2.775*WSD+0.123*NTL+1.949*RDLS+1.431*RSD | 0.58 | 1.1525 |
| 宁 夏 | 2.886+0.116*NTL+1.131*WSD+0.429*RDLS+0.395*RSD | 0.632 | 0.6729 |
| 青 海 | 9.688-1.918*RDLS+0.818*RSD+0.936*WSD | 0.759 | 0.9864 |
| 山 东 | 5.797+0.046*NTL+0.185*RSD-0.47*RDLS | 0.683 | 0.4272 |
| 山 西 | 6.183-1.313*RDLS+0.065*NTL+0.291*RSD-0.282*WSD | 0.736 | 0.61 |
| 陕 西 | 6.121-1.315*RDLS+0.048*NTL+0.333*RSD+0.377*WSD | 0.776 | 0.6857 |
| 上 海 | 6.222+0.043*NTL-0.565*WSD+85.432*RDLS+0.158*RSD | 0.826 | 0.7366 |
| 天 津 | 5.327+0.056*NTL | 0.689 | 0.6079 |
| 西 藏 | 1.205+3.975*RSD+2.73*WSD+0.238*NTL-0.309*RDLS | 0.457 | 0.8192 |
| 云 南 | 4.839+0.1*NTL+0.699*RSD-0.373*RDLS+0.345*WSD | 0.491 | 0.6529 |
| 浙 江 | 6.278-1.417*RDLS+0.048*NTL | 0.78 | 0.5322 |
以各方程中贡献率第一位的因子所反映的区域差异为例,对表3中各省乡镇人口密度拟合方程进行分类,以发掘各因素对省际人口分布影响机理的异同。安徽、河北、湖北、湖南、江西、山西、陕西、浙江等省贡献率第一位的因素为地形起伏度,表明在同等条件下,地形起伏度显著影响这些省区乡镇尺度的人口分布,可进一步定量刻画其地形起伏度与人居环境质量和区域资源环境承载力的关系,促进地形起伏度较大、土地贫瘠、生存环境较差山区人口向可扩容或重点开发的平原地区的合理再分布,指导山区扶贫及生态环境保护工作。北京、天津、上海、福建、广东、河南、吉林、江苏、辽宁、宁夏、山东等省区对应的方程中夜间灯光指数贡献率最大,可再分为两种情况,其一是区域发展水平较高,且地形起伏度不大的地区,包括北京、天津、上海三个直辖市,它们已经是中国人口最密集的地区之一,并伴随由诸多人口过多带来的“城市病”,必须有效控制其常住人口的增加,并科学规划城市布局,促进内部人口的有效分散;其二是区域内虽然地形起伏度较大,但同时存在人口潜力较大、经济较为发达的沿海岸线地带或者人口较为聚集的大面积内陆平原,包括福建、广东、河南、吉林、江苏、辽宁、宁夏、山东等省区,改革开放以来,比较优势已经推动各区域完成一定程度的人口合理再分布,伴随着新一轮产业升级和深入改革,应进一步优化区域国土资源开发格局,推进地区经济带的建设,促进人口的从业结构及居住区域的合理分布。海南省第一位贡献率因子为路网密度,区域特征明显,说明在2000年左右,该区域的发展活力尚未被完全释放,岛上还处于基础建设时期。
(1)较县级平均人口密度,乡镇平均人口密度能够更客观、细致地刻画人口分布,不仅更直观地区分出了若干人口聚集区,也能区分出县域内部人口密度的差异;研究区的乡镇级人口分布总体趋势是西北稀疏东南密集,人口密度由密到疏的地形依次为近海平原、内陆平原、低山丘陵地区、高原地区;人口密度较大的乡镇空间分布和海岸线、交通干线及大江大河具有一定的空间耦合性。乡镇级人口分布表现出极大的不均衡性,人口密度大于800人/km2的地区约占整个研究区总面积的3.5%,人口总量约占36.6%;人口密度低于200人/km2的地区约占整个研究区面积的75.56%,人口总量只占17.26%。
(2)研究区人口密度的整体经向规律为从西向东逐步升高,整体纬度规律为偏南或偏北人口密度略低,中部人口密度较高;同时,不同地带的经纬度规律表现出了极强的地带性,折射出高原、平原、山地、盆地等局部微地形的影响。总体来说,人口分布的经纬向规律和中国三级阶梯地貌趋势相吻合,又受到局部微地形及区域中心城市的影响。
(3)在乡镇尺度上,各省人口密度与地形起伏度、水网密度、路网密度和夜间灯光指数显著相关,平均相关系数为-0.53、0.28、0.61、0.69。基于地形起伏度、路网密度、水网密度和夜间灯光指数等拟合的乡镇级人口密度拟合方程能解释除藏、蒙、青、滇、黔之外各省区的85%以上的人口分布格局成因,省际之间的影响机理和作用成因差异较大,对于各省区的人口再分布具有宏观性指导意义。藏、蒙、青、滇、黔等省份由于其人口分布的独特规律,拟合方程有效性有待加强,需要引入更多的自然因素。
未来将在以下两个方面继续深入研究。① 系统收集和处理2010年乡镇空间数据和六普人口数据,提示2010年全国的人口分布格局,并且开展不同年际人口分布的变化研究,以期直接刻画城镇化、人口流动及迁移等人口问题对于2000至2010年人口分布的影响;② 扩展人口分布的影响因素,除了本文重点分析的自然地理因素外,增加经济发展等人文地理因素,全面发掘乡镇尺度上自然、社会、经济发展水平等因素和人口分布之间的复杂非线性关联和影响关系。
The authors have declared that no competing interests exist.
| [1] |
|
| [2] |
Some scaling issues of geography. https://doi.org/10.11820/dlkxjz.2004.02.003 URL [本文引用: 1] 摘要
大量研究证实, 地理学研究对象格局与过程及其时空特征均是尺度依存的, 随着研究工作的不断深入, 尺度问题越来越展示出其重要性。针对地理学各个分支学科都不同程度存在诸如概念模糊、转换模式不统一、转换效果评价缺乏客观标准等与尺度相关问题, 本文对一些有关尺度转换的议题进行了探讨。在评述了尺度及其转换研究的地理学意义后, 着重阐述了地理学尺度研究理论框架的内容和对象, 提出了地理科学中需要解决的 10个关键尺度问题, 并给出了初步的解决方案。
地理尺度转换若干问题的初步探讨 .https://doi.org/10.11820/dlkxjz.2004.02.003 URL [本文引用: 1] 摘要
大量研究证实, 地理学研究对象格局与过程及其时空特征均是尺度依存的, 随着研究工作的不断深入, 尺度问题越来越展示出其重要性。针对地理学各个分支学科都不同程度存在诸如概念模糊、转换模式不统一、转换效果评价缺乏客观标准等与尺度相关问题, 本文对一些有关尺度转换的议题进行了探讨。在评述了尺度及其转换研究的地理学意义后, 着重阐述了地理学尺度研究理论框架的内容和对象, 提出了地理科学中需要解决的 10个关键尺度问题, 并给出了初步的解决方案。
|
| [3] |
|
| [4] |
Research on distribution pattern of population of China in 2000 based on GIS: Compared with Hu Huanyong's research in 1935. 基于GIS的中国2000年人口之分布格局研究: 兼与胡焕庸1935年之研究对比 . |
| [5] |
Spatial distribution and autocorrelation analysis of population in China. https://doi.org/10.1007/s11670-002-0022-7 URL [本文引用: 1] 摘要
利用2000年人口普查信息,介绍了在人口地理信息系统中,通过三维模型显示,罗伦斯曲线,人口重心和人口潜力等方法,分析中国人口分布的特征.在此基础上,用空间相关方法对人口分布的现象进行分析,揭示了其空间地理分布的内在联系.
中国人口分布及空间相关分析 .https://doi.org/10.1007/s11670-002-0022-7 URL [本文引用: 1] 摘要
利用2000年人口普查信息,介绍了在人口地理信息系统中,通过三维模型显示,罗伦斯曲线,人口重心和人口潜力等方法,分析中国人口分布的特征.在此基础上,用空间相关方法对人口分布的现象进行分析,揭示了其空间地理分布的内在联系.
|
| [6] |
Analysis and visualization of uneven distribution of population in https://doi.org/10.3969/j.issn.1560-8999.2007.06.003 URL [本文引用: 1] 摘要
中国人口空间分布的不均匀性是一种客观存在的现象,自从1935年胡焕庸先生提出"爱辉-腾冲线"以来,中国人口东西部的不均匀现象并没有发生显著的变化。这种不均匀不仅仅存在于"胡焕庸线"两侧,而是广泛存在的。本文引用经济学家研究收入分配平均程度常用的LORENZ曲线方法,结合相关图、表,对中国人口空间分布的不均匀性进行研究。通过对曲线特征点的分析,结合地图可视化可以形象地反映人口空间分布的特点,同时对人口空间分布进行定量化描述。
中国人口空间分布不均匀性分析及其可视化 .https://doi.org/10.3969/j.issn.1560-8999.2007.06.003 URL [本文引用: 1] 摘要
中国人口空间分布的不均匀性是一种客观存在的现象,自从1935年胡焕庸先生提出"爱辉-腾冲线"以来,中国人口东西部的不均匀现象并没有发生显著的变化。这种不均匀不仅仅存在于"胡焕庸线"两侧,而是广泛存在的。本文引用经济学家研究收入分配平均程度常用的LORENZ曲线方法,结合相关图、表,对中国人口空间分布的不均匀性进行研究。通过对曲线特征点的分析,结合地图可视化可以形象地反映人口空间分布的特点,同时对人口空间分布进行定量化描述。
|
| [7] |
Population distribution of China based on GIS: Classification of population densities and curve of population gravity centers. https://doi.org/10.3321/j.issn:0375-5444.2009.02.007 URL [本文引用: 1] 摘要
依据2000年全国第五次人口普查数据,利用ArcGIS的空间分析功能,将人口密度图分层显示,并形成中国人口分布图系。在此基础上,建立人口重心曲线,根据人口重心曲线上点的邻近性实施人口密度再分级,由此获得了更具空间集聚特征的人口密度图。基于人口密度分级的多圈层迭加分析表明:随着人口密度增大,人口分布重心逐渐由西北向东南移动,由稀疏趋于稠密,中国人口分布多圈层集聚特征明显。人口重心曲线表明,人口分布总体上是从高密度向低密度分布过渡的,其中在低密度中也有高密度地区分布,高密度地区也有相对稀疏的地区。基于人口重心曲线的中国人口密度再分级表明,中国人口密度可以适度划分为9级,据此可以将中国人口地理分布划分为集聚核心区、高度集聚区、中度集聚区、低度集聚区、一般过渡区、相对稀疏区、绝对稀疏区、极端稀疏区、基本无人区等9大类型区。统计表明,中国3/4以上的人口集中分布在不到1/5的国土面积上,半数以上的国土面积上居住着不到2%的人口,研究结果较好地揭示了中国人口分布的空间规律性。
中国人口分布的密度分级与重心曲线特征分析 .https://doi.org/10.3321/j.issn:0375-5444.2009.02.007 URL [本文引用: 1] 摘要
依据2000年全国第五次人口普查数据,利用ArcGIS的空间分析功能,将人口密度图分层显示,并形成中国人口分布图系。在此基础上,建立人口重心曲线,根据人口重心曲线上点的邻近性实施人口密度再分级,由此获得了更具空间集聚特征的人口密度图。基于人口密度分级的多圈层迭加分析表明:随着人口密度增大,人口分布重心逐渐由西北向东南移动,由稀疏趋于稠密,中国人口分布多圈层集聚特征明显。人口重心曲线表明,人口分布总体上是从高密度向低密度分布过渡的,其中在低密度中也有高密度地区分布,高密度地区也有相对稀疏的地区。基于人口重心曲线的中国人口密度再分级表明,中国人口密度可以适度划分为9级,据此可以将中国人口地理分布划分为集聚核心区、高度集聚区、中度集聚区、低度集聚区、一般过渡区、相对稀疏区、绝对稀疏区、极端稀疏区、基本无人区等9大类型区。统计表明,中国3/4以上的人口集中分布在不到1/5的国土面积上,半数以上的国土面积上居住着不到2%的人口,研究结果较好地揭示了中国人口分布的空间规律性。
|
| [8] |
Research on the spatial pattern of population agglomeration and dispersion in China. https://doi.org/10.3724/SP.J.1084.2010.00199 URL [本文引用: 1] 摘要
人口集聚和疏散是人口空间分布 格局最直观和最集中的体现,研究一个地区人口集疏的空间格局,不仅可以揭示该地区人口集疏的内在规律,也有利于深入研究该地区的整体人口分布的态势和规 律,更能够体现出区域内经济格局以及城市化格局的发展。基于人口集聚度的中国人口集疏空间格局的研究,有助于准确把握中国人口空间分布的基本脉络,具有一 定的学术价值和实践意义。本研究采用了人口集聚度分级评价的方法,依据人口集聚度的不同,将各个地区划分为不同等级的人口集聚区,并对其分别讨论。在此基 础上,结合中国人口分布格局、自然条件空间格局、人居环境自然适宜性评价结果以及经济发展格局和城市化格局,对中国的人口集疏的空间格局进行了归纳,得出 了中国人口分布"西疏东密"的传统空间格局突出,人口集聚以平原地区为依托并呈现"沿海、沿江、沿线"高度集聚的特征的结论。
基于人口集聚度的中国人口集疏格局 .https://doi.org/10.3724/SP.J.1084.2010.00199 URL [本文引用: 1] 摘要
人口集聚和疏散是人口空间分布 格局最直观和最集中的体现,研究一个地区人口集疏的空间格局,不仅可以揭示该地区人口集疏的内在规律,也有利于深入研究该地区的整体人口分布的态势和规 律,更能够体现出区域内经济格局以及城市化格局的发展。基于人口集聚度的中国人口集疏空间格局的研究,有助于准确把握中国人口空间分布的基本脉络,具有一 定的学术价值和实践意义。本研究采用了人口集聚度分级评价的方法,依据人口集聚度的不同,将各个地区划分为不同等级的人口集聚区,并对其分别讨论。在此基 础上,结合中国人口分布格局、自然条件空间格局、人居环境自然适宜性评价结果以及经济发展格局和城市化格局,对中国的人口集疏的空间格局进行了归纳,得出 了中国人口分布"西疏东密"的传统空间格局突出,人口集聚以平原地区为依托并呈现"沿海、沿江、沿线"高度集聚的特征的结论。
|
| [9] |
The relations analysis between ecological environment quality of Chinese land resources and population. https://doi.org/10.3321/j.issn:1007-4619.1999.01.011 URL [本文引用: 1] 摘要
基于用数字环境模型对中国土地资源生态环境质量评价的基础上,生成了中国土地资源生态环境综合评价图和人口密度分布图。首先分析了中国土地资源生态环境等级面积构成及分布状况,中国土地资源生态环境质量最好的地区全部分布在东南沿海和四川盆地地区,之后,用相关分析方法及关系曲线分析了中国土地资源生态环境质量同人口分布的关系,得出了土地资源生态环境质量指数同人口存在着实质性的相关关系,中国东南沿海和四川盆地地区是中国土地资源生态环境最好的地区,也是人口密度和土度资源利用程度最高的地区,而西北及青藏高原区是中国土地资源生态环境比较差的地区,也是人口密度比较低的地区。
基于遥感和GIS的中国土地资源生态环境质量同人口分布的关系研究 .https://doi.org/10.3321/j.issn:1007-4619.1999.01.011 URL [本文引用: 1] 摘要
基于用数字环境模型对中国土地资源生态环境质量评价的基础上,生成了中国土地资源生态环境综合评价图和人口密度分布图。首先分析了中国土地资源生态环境等级面积构成及分布状况,中国土地资源生态环境质量最好的地区全部分布在东南沿海和四川盆地地区,之后,用相关分析方法及关系曲线分析了中国土地资源生态环境质量同人口分布的关系,得出了土地资源生态环境质量指数同人口存在着实质性的相关关系,中国东南沿海和四川盆地地区是中国土地资源生态环境最好的地区,也是人口密度和土度资源利用程度最高的地区,而西北及青藏高原区是中国土地资源生态环境比较差的地区,也是人口密度比较低的地区。
|
| [10] |
The relief degree of land surface in China and its correlation with population distribution. https://doi.org/10.3321/j.issn:0375-5444.2007.10.007 URL [本文引用: 1] 摘要
基于人居环境自然评价的需要, 运用GIS 技术, 采用窗口分析等方法, 提取了基于栅 格尺度(10 km×10 km) 的中国地形起伏度, 并从比例结构、空间分布和高度特征3 个方面系 统分析了中国地形起伏度的分布规律及其与人口分布的相关性。研究表明: 中国的地形起伏度以低值为主, 63%的区域低于1 (相对高差≤500 m); 空间分布呈现西高东低、南高北低的格局; 随着经度和纬度增高, 地形起伏度呈逐渐下降趋势, 28oN、35oN、42oN 纬线和85oE、102oE、115oE 经线上的地形起伏度符合中国三大阶梯的地貌特征; 随着海拔高度增加, 地形 起伏度呈现逐渐升高趋势。实证分析表明: 中国的地形起伏度与人口密度有较好的对数拟合关系, 拟合度高达0.91; 全国85%以上的人口居住在地形起伏度小于1 的地区, 在地形起伏度大于3 的地区居住的人口总数只占全国0.57%。中国地形起伏度与人口分布的相关性区域差异显著, 东北、华北、华中和华南等地相关性显著, 内蒙古与青藏地区几乎不存在相关性。
中国地形起伏度及其与人口分布的相关性 .https://doi.org/10.3321/j.issn:0375-5444.2007.10.007 URL [本文引用: 1] 摘要
基于人居环境自然评价的需要, 运用GIS 技术, 采用窗口分析等方法, 提取了基于栅 格尺度(10 km×10 km) 的中国地形起伏度, 并从比例结构、空间分布和高度特征3 个方面系 统分析了中国地形起伏度的分布规律及其与人口分布的相关性。研究表明: 中国的地形起伏度以低值为主, 63%的区域低于1 (相对高差≤500 m); 空间分布呈现西高东低、南高北低的格局; 随着经度和纬度增高, 地形起伏度呈逐渐下降趋势, 28oN、35oN、42oN 纬线和85oE、102oE、115oE 经线上的地形起伏度符合中国三大阶梯的地貌特征; 随着海拔高度增加, 地形 起伏度呈现逐渐升高趋势。实证分析表明: 中国的地形起伏度与人口密度有较好的对数拟合关系, 拟合度高达0.91; 全国85%以上的人口居住在地形起伏度小于1 的地区, 在地形起伏度大于3 的地区居住的人口总数只占全国0.57%。中国地形起伏度与人口分布的相关性区域差异显著, 东北、华北、华中和华南等地相关性显著, 内蒙古与青藏地区几乎不存在相关性。
|
| [11] |
The coupling mechanism of the centroids of economic gravity and population gravity and its effect on the regional gap in China. https://doi.org/10.1097/ICO.0b013e3182000add URL [本文引用: 1] 摘要
区域发展差距一直是中国区域协调发展所面临的重要问题,经济和人口的空间分布态势作为区域发展空间均衡过程的体现,与区域差距的形成有密切关联。通过计算1952年至2005年中国经济重心和人口重心的地理坐标以及重心间的空间重叠性与变动一致性,刻画了53年间我国经济和人口空间分布的耦合态势,证明了其与区域差距的大小高度相关。在构建经济、人口重心空间耦合过程的作用机制模型的基础上,用均衡点跃迁和势能差转化解释了区域发展的空间均衡过程,揭示了内生和外部因素在其中的作用机制,提出了区域发展差距的"多阶段倒U形"的演变规律,并据此分析了1952年以来中国区域发展空间均衡过程周期性变化的动因,并对促进区域协调发展的途径进行了讨论。
中国经济与人口重心的耦合态势及其对区域发展的影响 .https://doi.org/10.1097/ICO.0b013e3182000add URL [本文引用: 1] 摘要
区域发展差距一直是中国区域协调发展所面临的重要问题,经济和人口的空间分布态势作为区域发展空间均衡过程的体现,与区域差距的形成有密切关联。通过计算1952年至2005年中国经济重心和人口重心的地理坐标以及重心间的空间重叠性与变动一致性,刻画了53年间我国经济和人口空间分布的耦合态势,证明了其与区域差距的大小高度相关。在构建经济、人口重心空间耦合过程的作用机制模型的基础上,用均衡点跃迁和势能差转化解释了区域发展的空间均衡过程,揭示了内生和外部因素在其中的作用机制,提出了区域发展差距的"多阶段倒U形"的演变规律,并据此分析了1952年以来中国区域发展空间均衡过程周期性变化的动因,并对促进区域协调发展的途径进行了讨论。
|
| [12] |
Natural forming causes of China population distribution. 中国人口分布的自然成因 , |
| [13] |
Wang Ying'an, et al. Digital simulation of population density in China. https://doi.org/10.3321/j.issn:0375-5444.2003.01.003 URL [本文引用: 1] 摘要
运用基于格点生成法的人口密度空间分布模拟模型,通过运行净第一性生产力空间分布、数字高程、城市规模及其空间分布和交通基础设施空间分布等数据集,模拟了中国人口密度的空间分布规律。模拟结果表明,人口密度的最高值集中在北京、上海和郑州之间的三角区(BSZ)及珠江三角洲地区;同时,这个BSZ峰值三角区有发展为以上海-南京-杭州大都市密集区、武汉市、西安市、北京-天津-唐山大都市密集区和沈阳-大连大都市密集区为顶点的五角形峰值区的趋势,珠江三角洲峰值区也正在向外围地区扩展。
中国人口密度数字模拟 .https://doi.org/10.3321/j.issn:0375-5444.2003.01.003 URL [本文引用: 1] 摘要
运用基于格点生成法的人口密度空间分布模拟模型,通过运行净第一性生产力空间分布、数字高程、城市规模及其空间分布和交通基础设施空间分布等数据集,模拟了中国人口密度的空间分布规律。模拟结果表明,人口密度的最高值集中在北京、上海和郑州之间的三角区(BSZ)及珠江三角洲地区;同时,这个BSZ峰值三角区有发展为以上海-南京-杭州大都市密集区、武汉市、西安市、北京-天津-唐山大都市密集区和沈阳-大连大都市密集区为顶点的五角形峰值区的趋势,珠江三角洲峰值区也正在向外围地区扩展。
|
| [14] |
Simulation of Chinese population density based on land use. https://doi.org/10.1007/BF02873097 URL [本文引用: 1] 摘要
土地利用数据综合了影响人口分布的众多因素的信息.根据分县控制、分城乡、分区建模的思路,建立基于土地利用的中国1km栅格人口模型.对农村人口采用线性加权模型进行模拟,根据全国12个农业生态区内人口与各类农业用地之间的相关关系选取指标,采用逐步回归计算各指标的回归系数,并结合土地的生产力及其与人口的相关性,确定各指标的加权系数.对城市人口,建立基于城镇规模的人口距离衰减加幂指数模型.结果分析表明,"胡焕庸"线以东人口占全国的94.58%,人口密度是该线以西的21倍;东部人口集中于黄淮海地区、四川盆地、长江中下游、东北平原及沿海地区,东南沿海又表现为"点轴"分布的特点.验证表明,模拟结果具有较高的精度.
基于土地利用的中国人口密度模拟 .https://doi.org/10.1007/BF02873097 URL [本文引用: 1] 摘要
土地利用数据综合了影响人口分布的众多因素的信息.根据分县控制、分城乡、分区建模的思路,建立基于土地利用的中国1km栅格人口模型.对农村人口采用线性加权模型进行模拟,根据全国12个农业生态区内人口与各类农业用地之间的相关关系选取指标,采用逐步回归计算各指标的回归系数,并结合土地的生产力及其与人口的相关性,确定各指标的加权系数.对城市人口,建立基于城镇规模的人口距离衰减加幂指数模型.结果分析表明,"胡焕庸"线以东人口占全国的94.58%,人口密度是该线以西的21倍;东部人口集中于黄淮海地区、四川盆地、长江中下游、东北平原及沿海地区,东南沿海又表现为"点轴"分布的特点.验证表明,模拟结果具有较高的精度.
|
| [15] |
Modeling population density of China in 1998 based on DMSP/OLS nighttime light image.
Spatial distribution of population density is crucial for analyzing the relationship among economic growth, environment protection and resource utilization. In this study, population density of China in 1998 at 1-km resolution grids was simulated by integrating DMSP/OLS non-radiance calibrated nighttime light image, SPOT/VEGETATION 10-day maximum NDVI data, population census data and vector data of county boundary. Not only the population density in light patches but also that out of them was estimated in four types of areas. For each area, in light patches, the model for population density estimation was developed based on the significant correlation between light intensity an
基于夜间灯光数据的中国人口密度模拟 .
Spatial distribution of population density is crucial for analyzing the relationship among economic growth, environment protection and resource utilization. In this study, population density of China in 1998 at 1-km resolution grids was simulated by integrating DMSP/OLS non-radiance calibrated nighttime light image, SPOT/VEGETATION 10-day maximum NDVI data, population census data and vector data of county boundary. Not only the population density in light patches but also that out of them was estimated in four types of areas. For each area, in light patches, the model for population density estimation was developed based on the significant correlation between light intensity an
|
| [16] |
Population growth rate and its spatial association by province in china. 中国省级人口增长率及其空间关联分析 . |
| [17] |
Empirical research on time and space diffusion process of provincial demographic transition in China.
Using the data of demographic transition on provincial level from 1949 to 2008,we try to draw a picture of time and space diffusion process of provincial demographic transition in China by cluster analysis.Then we find the cluster analysis of time series data indicates the fertility transition,mortality transition and the transition of natural increase are not at the same pace,and they have different transition modes.Besides,the cluster analysis of time point data demonstrates provincial demographic transition diffuses in space and has time lag,and the pace of provincial demographic transition converges more and more quickly.Meanwhile,we test the consistency of provincial demographic transition and provincial economic development,and we find that both the consistency and non-consistency exist in the different provinces,and the economic development isn' t the determined factor of provincial demographic transition.
中国省级人口转变的时空演变过程: 基于聚类分析的实证研究 .
Using the data of demographic transition on provincial level from 1949 to 2008,we try to draw a picture of time and space diffusion process of provincial demographic transition in China by cluster analysis.Then we find the cluster analysis of time series data indicates the fertility transition,mortality transition and the transition of natural increase are not at the same pace,and they have different transition modes.Besides,the cluster analysis of time point data demonstrates provincial demographic transition diffuses in space and has time lag,and the pace of provincial demographic transition converges more and more quickly.Meanwhile,we test the consistency of provincial demographic transition and provincial economic development,and we find that both the consistency and non-consistency exist in the different provinces,and the economic development isn' t the determined factor of provincial demographic transition.
|
| [18] |
Spatial pattern and its evolution of Chinese provincial population and empirical study. https://doi.org/10.11821/dlxb201410007 URL [本文引用: 1] 摘要
中国正在经历着史无前例的城镇 化过程,2011年全国城镇人口已达6.91亿人,城镇化率攀升至51.27%。按2030年城镇化水平到70%计算,还将有接近3亿人口从农村流动至城 市。与此同时,由于总生育率受社会经济发展水平、生态环境以及社会思潮的共同作用,人口自然增长率正在减少,"单独二胎"政策即是国家对人口发展战略的重 大战略调整。由此可见,对正处在城镇化、工业化和全球化加速推进的中国而言,人口自然增长与空间迁移正在且必将持续重塑人口空间格局,因而科学地认识中国 人口自然增长和空间迁移的区域差异、准确地把握人口空间格局及其演化趋势,对于科学编制城镇化发展、土地利用、生态环境保护等各类空间规划和制订流动人 口、区域协作等各项空间管理政策具有重要意义。本文构建了一种全新的自上而下的人口预测方法,考虑人口自然增长和空间迁移两种影响因素,着重对一级单元 (全国)和次级单元(省级)在2010-2050年间的人口总量进行预测,并进一步研判我国人口空间格局的发展情景和演化特征:从各省人口密度变化来看, 中国人口空间分布密度继续保持了东部高、中部次之、东北再次、西部最低的总体格局。东部省份中上海、北京、天津及江苏的人口密度始终保持在一至四位,最末 三位依次是新疆、青海和西藏。根据本文提出的省际人口变化强度及其主导类型的测算指标和量化结果,可将中国划分为人口快速变化区(净迁入主导型、净迁出主 导型、自然增长主导型)、人口低速变化区(净迁入型、净迁出型)以及人口平稳区。净迁入主导型人口快速变化区将吸纳99%的未来新增流动人口,其中上海、 北京、浙江至2030年时人口密度达到顶峰,而广东的人口密度持续增加到2035年;净迁出主导型人口快速变化区,包括河南、安徽、重庆、湖北,75%的 新增流动人口将由此类型区域迁出;辽宁和山东同属于自然增长主导型人口快速变化区,其新增流动人口比重极小,由人口自然增长变化主导区域的人口快速变化态 势。在低速变化区中,除福建和海南作为少有的流动人口净迁入型省份,其余省份人口密度不断降低则缘于大量的劳动力输出和逐渐走低的生育率;大部西北和西南 省份属于人口平稳区,其人口密度呈现出稳中有减的态势,人口密度平均值大多在100人/km2以下。
中国省际人口空间格局演化的分析方法与实证 .https://doi.org/10.11821/dlxb201410007 URL [本文引用: 1] 摘要
中国正在经历着史无前例的城镇 化过程,2011年全国城镇人口已达6.91亿人,城镇化率攀升至51.27%。按2030年城镇化水平到70%计算,还将有接近3亿人口从农村流动至城 市。与此同时,由于总生育率受社会经济发展水平、生态环境以及社会思潮的共同作用,人口自然增长率正在减少,"单独二胎"政策即是国家对人口发展战略的重 大战略调整。由此可见,对正处在城镇化、工业化和全球化加速推进的中国而言,人口自然增长与空间迁移正在且必将持续重塑人口空间格局,因而科学地认识中国 人口自然增长和空间迁移的区域差异、准确地把握人口空间格局及其演化趋势,对于科学编制城镇化发展、土地利用、生态环境保护等各类空间规划和制订流动人 口、区域协作等各项空间管理政策具有重要意义。本文构建了一种全新的自上而下的人口预测方法,考虑人口自然增长和空间迁移两种影响因素,着重对一级单元 (全国)和次级单元(省级)在2010-2050年间的人口总量进行预测,并进一步研判我国人口空间格局的发展情景和演化特征:从各省人口密度变化来看, 中国人口空间分布密度继续保持了东部高、中部次之、东北再次、西部最低的总体格局。东部省份中上海、北京、天津及江苏的人口密度始终保持在一至四位,最末 三位依次是新疆、青海和西藏。根据本文提出的省际人口变化强度及其主导类型的测算指标和量化结果,可将中国划分为人口快速变化区(净迁入主导型、净迁出主 导型、自然增长主导型)、人口低速变化区(净迁入型、净迁出型)以及人口平稳区。净迁入主导型人口快速变化区将吸纳99%的未来新增流动人口,其中上海、 北京、浙江至2030年时人口密度达到顶峰,而广东的人口密度持续增加到2035年;净迁出主导型人口快速变化区,包括河南、安徽、重庆、湖北,75%的 新增流动人口将由此类型区域迁出;辽宁和山东同属于自然增长主导型人口快速变化区,其新增流动人口比重极小,由人口自然增长变化主导区域的人口快速变化态 势。在低速变化区中,除福建和海南作为少有的流动人口净迁入型省份,其余省份人口密度不断降低则缘于大量的劳动力输出和逐渐走低的生育率;大部西北和西南 省份属于人口平稳区,其人口密度呈现出稳中有减的态势,人口密度平均值大多在100人/km2以下。
|
| [19] |
Population spatial structure evolution pattern and regulation pathway in Lanzhou city. https://doi.org/10.11821/yj2012110013 URL [本文引用: 1] 摘要
以街道和乡镇层面的人口统计数据为基础,综合应用ArcGIS和GS+Version7等软件对兰州市人口空间演变进行定量分析。结果表明:自1982年 至2009年,兰州市人口呈逐年“向心聚集”态势,但不同阶段、不同街区人口空间增长存在显著差异;街道和乡镇人口密度差距逐年增大,高密度街区个数增 多、范围扩大;距离人口高密度中心越远,人口密度的正相关性逐渐削弱,负相关性则逐渐增强,空间自相关范围不断增大;人口空间分布整体呈“东密西疏”格 局,并呈现“双中心”空间结构。人口的极不均衡分布,带来了环境污染、交通拥挤、住宅紧张、就业困难等一系列问题。通过构建多中心城市结构、调整产业空间 布局、平衡配置基础设施和引导人口有序流动等方面进行综合调控,不断优化人口空间分布,保障城市的可持续发展。
兰州城市人口空间结构演变格局及调控路径 .https://doi.org/10.11821/yj2012110013 URL [本文引用: 1] 摘要
以街道和乡镇层面的人口统计数据为基础,综合应用ArcGIS和GS+Version7等软件对兰州市人口空间演变进行定量分析。结果表明:自1982年 至2009年,兰州市人口呈逐年“向心聚集”态势,但不同阶段、不同街区人口空间增长存在显著差异;街道和乡镇人口密度差距逐年增大,高密度街区个数增 多、范围扩大;距离人口高密度中心越远,人口密度的正相关性逐渐削弱,负相关性则逐渐增强,空间自相关范围不断增大;人口空间分布整体呈“东密西疏”格 局,并呈现“双中心”空间结构。人口的极不均衡分布,带来了环境污染、交通拥挤、住宅紧张、就业困难等一系列问题。通过构建多中心城市结构、调整产业空间 布局、平衡配置基础设施和引导人口有序流动等方面进行综合调控,不断优化人口空间分布,保障城市的可持续发展。
|
| [20] |
Study on spatio-temporal change and simulation of population in Beijing based on census data,
This study mainly aims to explore the spatio-temporal patterns and to simulate the future scenario of population change in Beijing based on the fifth and sixth census data at township level. The main contents and results were summed up as follows:(1) The resident population of Beijing increased with an average annual rate of 3.5% between 2000 and 2010,and the population increased by 0.6 million every year. Beijing was one of the megacities which were classified into the first range for their great amount of increased population.(2)There was an obvious circle structure in space. The population of inner city was almost stagnant; it had a rapid growth in the suburbs, and a high rate in the outer city. However, it had an increase only in the county seat and the key towns in the ecological conservation region of Beijing.(3) In terms of the CA/MAS scenario simulation analysis, in the spontaneous layout scenario, employment opportunities will be further agglomerated to the inner city, while population is suburbanized constantly. This will increase the city's commuter stress and aggravate the condition of city traffic block. When adjusting the parameters of employment and thus strengthening the guide policy of urban population living in working function, the problem of imbalance between industrial space and residential space in the urban internal space scale can be solved. At the same time, the formation of cluster of small towns can be promoted and urban commuter pressure can be reduced. Then comes the city's radiation and diffusion effect. The authors suggest that, in order to optimize the spatial distribution of population in Beijing, more efforts should be made to coordinate the relationship between employment and residents. An important way is to accelerate regional coordinated development, and to plan multi-centers development as groups.
北京市人口时空变化与情景预测研究 .
This study mainly aims to explore the spatio-temporal patterns and to simulate the future scenario of population change in Beijing based on the fifth and sixth census data at township level. The main contents and results were summed up as follows:(1) The resident population of Beijing increased with an average annual rate of 3.5% between 2000 and 2010,and the population increased by 0.6 million every year. Beijing was one of the megacities which were classified into the first range for their great amount of increased population.(2)There was an obvious circle structure in space. The population of inner city was almost stagnant; it had a rapid growth in the suburbs, and a high rate in the outer city. However, it had an increase only in the county seat and the key towns in the ecological conservation region of Beijing.(3) In terms of the CA/MAS scenario simulation analysis, in the spontaneous layout scenario, employment opportunities will be further agglomerated to the inner city, while population is suburbanized constantly. This will increase the city's commuter stress and aggravate the condition of city traffic block. When adjusting the parameters of employment and thus strengthening the guide policy of urban population living in working function, the problem of imbalance between industrial space and residential space in the urban internal space scale can be solved. At the same time, the formation of cluster of small towns can be promoted and urban commuter pressure can be reduced. Then comes the city's radiation and diffusion effect. The authors suggest that, in order to optimize the spatial distribution of population in Beijing, more efforts should be made to coordinate the relationship between employment and residents. An important way is to accelerate regional coordinated development, and to plan multi-centers development as groups.
|
| [21] |
Advances in Regional Demography: Information, Forecasts, Models . |
| [22] |
Population geography: Does geography matter in fertility research? https://doi.org/10.1191/0309132503ph452pr URL 摘要
Focuses on the role played by population geography in fertility research in Great Britain and the United States. Historical patterns of population change presented by geographers; Persuasive argument against the dominant role of social class and occupation in explaining fertility change; Geographical perspectives of understanding fertility and family decision-making.
|
| [23] |
Gender role beliefs and family migration. Population, |
| [24] |
Residential mobility and social capital. |
| [25] |
Review of population geography in the past century. https://doi.org/10.11820/dlkxjz.2011.02.001 URL [本文引用: 1] 摘要
20世纪之前的人口地理学只是从属于传统地理学的人口地理研究。进入20世纪,人口地理研究尚未从人文地理学中独立出来,内容上延续了拉采尔的人类地理学思想;二战以后,人口地理研究逐步向人口地理学纵深发展,50年代人口地理学逐步成形。20世纪后半叶,人口地理学得到了持续快速发展:出生率与老龄化、迁移与流动、人口与脆弱性等世界性人口问题成为热点研究主题。未来人口地理学家仍将关注人口差异、脆弱性及空间分析,加强人口统计数据空间化方法研究,从不同地理尺度与地理维度应对人口地理学的新挑战。
20世纪人口地理学研究进展 .https://doi.org/10.11820/dlkxjz.2011.02.001 URL [本文引用: 1] 摘要
20世纪之前的人口地理学只是从属于传统地理学的人口地理研究。进入20世纪,人口地理研究尚未从人文地理学中独立出来,内容上延续了拉采尔的人类地理学思想;二战以后,人口地理研究逐步向人口地理学纵深发展,50年代人口地理学逐步成形。20世纪后半叶,人口地理学得到了持续快速发展:出生率与老龄化、迁移与流动、人口与脆弱性等世界性人口问题成为热点研究主题。未来人口地理学家仍将关注人口差异、脆弱性及空间分析,加强人口统计数据空间化方法研究,从不同地理尺度与地理维度应对人口地理学的新挑战。
|
| [26] |
Determining global population distribution: Methods, applications and data. https://doi.org/10.1016/S0065-308X(05)62004-0 URL PMID: 3154651 [本文引用: 1] 摘要
Evaluating the total numbers of people at risk from infectious disease in the world requires not just tabular population data, but data that are spatially explicit and global in extent at a moderate resolution. This review describes the basic methods for constructing estimates of global population distribution with attention to recent advances in improving both spatial and temporal resolution. To evaluate the optimal resolution for the study of disease, the native resolution of the data inputs as well as that of the resulting outputs are discussed. Assumptions used
|
| [27] |
LandScan: A global population database for estimating populations at risk. |
| [28] |
|
| [29] |
|
| [30] |
Dasymetric modelling of small-area population distribution using land cover and light emissions data. https://doi.org/10.1016/j.rse.2006.11.020 URL [本文引用: 1] 摘要
Despite the improvements made in census procedures over recent decades, the availability of detailed population data is limited. For many applications, including environmental and health analyses, methods are therefore needed to model population distribution at the small-area level. With the development of GIS and remote sensing techniques, the ability to develop such models has greatly improved. This paper describes a GIS-based approach using remotely sensed land cover and nighttime light emissions data to model population distribution at the land parcel level across the European Union. Light emission data from the DMSP satellites were first resampled and modelled using kriging and inverse distance weighting methods to provide a 200-m resolution light emissions map. This was then matched to CORINE land cover classes across the EU. Regression methods were used to derive models of relationships between census population counts (at NUTS 5 level) and land cover area and light emissions. Models were developed at both national and EU scale, using a range of different modelling strategies. Model performance, as indicated by the regression statistics, was seen to be good, withtypically in the order of 0.8–0.9 and SEE ca. 4000 people. In southern countries, especially, incorporation of light emissions data was found to improve model
|
| [31] |
Integration of GP and GA for mapping population distribution. https://doi.org/10.1080/13658810802186874 URL 摘要
Mapping population distribution is an important field of geographical and related research because of the frequent need to combine spatial data representing socio-demographic information across various incompatible spatial units. However, the research may become very complex and difficult when a population in multiple places is estimated by various factors. Previous efforts in the field have contributed to the selection of appropriate independent variables and the creation of different population models. However, the level of accuracy obtainable with these studies is limited by the spatial heterogeneity of population distribution within the individual census districts, particularly in large rural areas. A high-accuracy modelling method for population estimation based on integration of Genetic Programming (GP) and Genetic Algorithms (GA) with Geographic Information Systems (GIS) is presented in this paper. GIS was applied to identify and quantify a set of natural and socioeconomic factors which contributed to population distribution, and then GP and GA were used to build and optimise the population model to automatically transform census population data to regular grids. The study indicated that the proposed method performed much better than the stepwise regression analysis and adapted gravity model methods in estimating the population of both urban and rural areas. More importantly, this proposed method could provide a single, unified approach to mapping population distribution in various areas because the paradigms of these algorithms are general.
|
| [32] |
Population density estimation using regression and area-to-point residual kriging. |
| [33] |
Modeling and analysis of global epidemiology of avian influenza. https://doi.org/10.1016/j.envsoft.2008.06.011 URL [本文引用: 1] 摘要
The World Health Organization has activated a global preparedness plan to improve response to avian influenza outbreaks, control outbreaks, and avoid an H5N1 pandemic. The effectiveness of the plan will greatly benefit from identification of epicenters and temporal analysis of outbreaks. Accordingly, we have developed a simulation-based methodology to analyze the spread of H5N1 using stochastic...
|
| [34] |
The rising tide: Assessing the risks of climate change and human settlements in low elevation coastal zones. https://doi.org/10.1177/0956247807076960 URL [本文引用: 1] |
| [35] |
The grid scale effect analysis on town leveled population statistical data spatialization .https://doi.org/10.1017/S0004972710001772 URL [本文引用: 1] 摘要
The gird scale effect is one of the basic issues on population data spatialization.For the demand of all kinds of spatial population data in the fields of resources and environment and global change models,a lot of researches have been done based on remote sensing and GIS technology both at home and abroad.But the models used are mostly on global(such as GPW,1995,5km),national(such as national population database,2000,1km) or provincial scale,and their resolution ranges from 1km to several kilometers.In recent years,there are studies on local distribution of population by using of high-resolution images.For all the researches,both the method of data source selection according to specific application and the analysis on production suitability are deficient.So,many uncertainties exit in population data application,especially in county level and secondary or tertiary rivers.To solve the problems mentioned above,in this article we mainly propose the method of scale effect analysis on population data spatialization.Taking Yiwu City,Zhejiang Province as the study area,using CBERS and IRS-P5 images we extract land use information and build a spatialization model to the statistical population data of rural towns,then get a set of population data gird ranging from 20m to 1km.Moreover,by comparing population data by grid and statistical population data in rural towns,the grid scale effect analysis is made;by comparing population data by grid and statistical population data in villages,the remote sensing data source scale effect analysis is made.The result of scale effect analysis shows: by using CBERS as data source,the suitable grid scale of production is 200m and its precision is 76%;by using P5 as a data source,the suitable grid scale of production is 100m and its precision is 84%.The method of scale effect analysis in spatial distribution of statistical population is argued in this paper and it can provide basic technical solutions and examples to optimum scale selection in the process of humanistic factors(such as population) spatialization.
乡镇级人口统计数据空间化的格网尺度效应分析: 以义乌市为例 .https://doi.org/10.1017/S0004972710001772 URL [本文引用: 1] 摘要
The gird scale effect is one of the basic issues on population data spatialization.For the demand of all kinds of spatial population data in the fields of resources and environment and global change models,a lot of researches have been done based on remote sensing and GIS technology both at home and abroad.But the models used are mostly on global(such as GPW,1995,5km),national(such as national population database,2000,1km) or provincial scale,and their resolution ranges from 1km to several kilometers.In recent years,there are studies on local distribution of population by using of high-resolution images.For all the researches,both the method of data source selection according to specific application and the analysis on production suitability are deficient.So,many uncertainties exit in population data application,especially in county level and secondary or tertiary rivers.To solve the problems mentioned above,in this article we mainly propose the method of scale effect analysis on population data spatialization.Taking Yiwu City,Zhejiang Province as the study area,using CBERS and IRS-P5 images we extract land use information and build a spatialization model to the statistical population data of rural towns,then get a set of population data gird ranging from 20m to 1km.Moreover,by comparing population data by grid and statistical population data in rural towns,the grid scale effect analysis is made;by comparing population data by grid and statistical population data in villages,the remote sensing data source scale effect analysis is made.The result of scale effect analysis shows: by using CBERS as data source,the suitable grid scale of production is 200m and its precision is 76%;by using P5 as a data source,the suitable grid scale of production is 100m and its precision is 84%.The method of scale effect analysis in spatial distribution of statistical population is argued in this paper and it can provide basic technical solutions and examples to optimum scale selection in the process of humanistic factors(such as population) spatialization.
|
| [36] |
Generation of fine-scale population layers using multi-resolution satellite imagery and geospatial data. https://doi.org/10.1016/j.rse.2012.11.022 URL [本文引用: 1] 摘要
A gridded population dataset was produced for Pakistan by developing an algorithm that distributed population either on the basis of per-pixel built-up area fraction or the per-pixel value of a weighted population likelihood layer. Per-pixel built-up area fraction was calculated using a classification and regression trees (CART) methodology integrating high- and medium-resolution satellite imagery. The likelihood layer was produced by weighting different geospatial layers according to their effect on the likelihood of population being found in the particular pixel. The geospatial layers integrated into the likelihood layer were: 1) proximity to remotely sensed built-up pixels, 2) density of settlement points in a fixed kernel, 3) slope, 4) elevation, and 5) heterogeneity of landcover types found within a search radius. The method for weighting these layers varied according to settlement patterns found in the provinces of Pakistan. Differences in zonal population estimates generated from the 100-meter gridded population layer resulting from this study, , and CIESIN's Gridded Population of the World and Global Rural Urban Mapping Project (GPW and GRUMP) are examined. Population estimates for small areas produced using this paper's method were found to differ from census counts to a lesser degree than those produced using LandScan, GPW, or GRUMP. The root
|
| [37] |
The many faces of population density. |
| [38] |
The relief degree of land surface and population distribution in Guanzhong-Tianshui Economic Region using GIS.
With the degeneration of environment and acceleration of urbanization,human environment has attracted great attention worldwide.As one of the key factors,the relief degree of land surface is an important indicator for natural evaluation,and it also has high accuracy and practical application in small scale residential environmental evaluation.Based on lattice digital elevation model of scale 1鈭25 0000 in Guangzhong-Tianshui economic region,using the window analysis and spatial analysis model of ARCGIS software,this article extracts the relief degree of land surface and population distribution in Guanzhong-Tianshui economic region.From the characteristics of proportion,spatial distribution and height,it also systematically analyzes the discipline of the relief degree of land surface and its relationship with the distribution of population in Guanzhong-Tianshui economic region.The study has shown that: 1) The relief degree of land surface in Guanzhong-Tianshui economic region is dominated by middle and low value,and its topographic area is less than 2.4 occupying 96.66% of the total area,and the average proportion occupying 32.4% of the whole area.The higher is the relief degree of land surface,the lower is the proportion of plains,and vice versa;2) The relief degree of land surface in Guanzhong-Tianshui economic region presents such spatial patterns that the south and north are higher and the middle is lower,and there is the maximum value in Taibai Country in Baoji City and the minimum value in Guanzhong plains.The variation is not apparent on the longitude,and the degree of latitude increases after the first drop no matter from South to North or from North to South;3)As the altitude increased,the degree presents a rising trend but has not much change;4) The relief degree of land surface has a strong impact on the regional distribution,nearly 90% residents in Guanzhong-Tianshui economic region lived in the area where less than 1.5 degree,the curved fitting of population density and topographic is very high;5) The relational area of topographic and population distribution have significant difference,the topographic has obvious relation with population distribution,but the relationship of the topographic is smaller in four countries in Shangluo and Tianshui cities.To sum up,the relief degree of land surface can better reflect the topographic feature and reveal its regularities of space in Guanzhong-Tianshui economic region.Empirical research shows that,as one of the key factors,the relief degree of land surface is an important indicator for natural evaluation;it also has high accuracy and practical application in small scale residential environmental evaluation.In summary,the RDLS model established in this paper can not only reflect the natural environment suitability for human settlements in Guanzhong-Tianshui economic region,but also can illustrate the spatial distribution rules of it very well.
基于GIS的关中—天水经济区地形起伏度与人口分布研究 .
With the degeneration of environment and acceleration of urbanization,human environment has attracted great attention worldwide.As one of the key factors,the relief degree of land surface is an important indicator for natural evaluation,and it also has high accuracy and practical application in small scale residential environmental evaluation.Based on lattice digital elevation model of scale 1鈭25 0000 in Guangzhong-Tianshui economic region,using the window analysis and spatial analysis model of ARCGIS software,this article extracts the relief degree of land surface and population distribution in Guanzhong-Tianshui economic region.From the characteristics of proportion,spatial distribution and height,it also systematically analyzes the discipline of the relief degree of land surface and its relationship with the distribution of population in Guanzhong-Tianshui economic region.The study has shown that: 1) The relief degree of land surface in Guanzhong-Tianshui economic region is dominated by middle and low value,and its topographic area is less than 2.4 occupying 96.66% of the total area,and the average proportion occupying 32.4% of the whole area.The higher is the relief degree of land surface,the lower is the proportion of plains,and vice versa;2) The relief degree of land surface in Guanzhong-Tianshui economic region presents such spatial patterns that the south and north are higher and the middle is lower,and there is the maximum value in Taibai Country in Baoji City and the minimum value in Guanzhong plains.The variation is not apparent on the longitude,and the degree of latitude increases after the first drop no matter from South to North or from North to South;3)As the altitude increased,the degree presents a rising trend but has not much change;4) The relief degree of land surface has a strong impact on the regional distribution,nearly 90% residents in Guanzhong-Tianshui economic region lived in the area where less than 1.5 degree,the curved fitting of population density and topographic is very high;5) The relational area of topographic and population distribution have significant difference,the topographic has obvious relation with population distribution,but the relationship of the topographic is smaller in four countries in Shangluo and Tianshui cities.To sum up,the relief degree of land surface can better reflect the topographic feature and reveal its regularities of space in Guanzhong-Tianshui economic region.Empirical research shows that,as one of the key factors,the relief degree of land surface is an important indicator for natural evaluation;it also has high accuracy and practical application in small scale residential environmental evaluation.In summary,the RDLS model established in this paper can not only reflect the natural environment suitability for human settlements in Guanzhong-Tianshui economic region,but also can illustrate the spatial distribution rules of it very well.
|
| [39] |
GB/T 919-2002. Code for Highway Classification .GB/T 919-2002. 公路等级代码. . |
| [40] |
Method of measuring the concentration of wealth. |
| [41] |
Classification method of population density map based on Lorenz curve .https://doi.org/10.1016/S1874-8651(10)60080-4 URL [本文引用: 1] 摘要
与传统上地图分级的研究重点关注分级统计精度和图面效果不同,本文提出了一种用于表达和传输 人口密度空间分布知识的自动化地图分级方法。该方法基于人口密度分布Lorenz曲线,根据知识传递的需要确定制图分级数,通过Lorenz曲线化简的方 法确定分级间隔,以更好地表达人口空间分布的规律性知识,增强地图信息的传输效果。试验表明,分为两级时该方法能够自动地得出"胡焕庸线"的基本轮廓,分 为多级时能够很好地体现人口空间分布的基本规律和特例知识。
基于Lorenz曲线的人口密度地图分级方法 .https://doi.org/10.1016/S1874-8651(10)60080-4 URL [本文引用: 1] 摘要
与传统上地图分级的研究重点关注分级统计精度和图面效果不同,本文提出了一种用于表达和传输 人口密度空间分布知识的自动化地图分级方法。该方法基于人口密度分布Lorenz曲线,根据知识传递的需要确定制图分级数,通过Lorenz曲线化简的方 法确定分级间隔,以更好地表达人口空间分布的规律性知识,增强地图信息的传输效果。试验表明,分为两级时该方法能够自动地得出"胡焕庸线"的基本轮廓,分 为多级时能够很好地体现人口空间分布的基本规律和特例知识。
|
| [42] |
A discussion on correlation of geographical parameter with spatial population distribution .https://doi.org/10.3969/j.issn.1000-3177.2002.04.014 URL [本文引用: 1] 摘要
通过建立包括居民地、公路、铁 路、水系、高程带、坡度带、坡向带、土地覆盖等要素内容的地理因子库 ,以及包括国民经济和社会发展主要指标的经济因子库 ,提取在一定区域内与人口分布密切相关的因子组成 ,并以其归一化相关系数作为定量分析的权重系数。本文提出的是实现人口在空间单元内遵循人口分布规律的空间化分布的一种尝试。
地理因子与空间人口分布的相关性研究 .https://doi.org/10.3969/j.issn.1000-3177.2002.04.014 URL [本文引用: 1] 摘要
通过建立包括居民地、公路、铁 路、水系、高程带、坡度带、坡向带、土地覆盖等要素内容的地理因子库 ,以及包括国民经济和社会发展主要指标的经济因子库 ,提取在一定区域内与人口分布密切相关的因子组成 ,并以其归一化相关系数作为定量分析的权重系数。本文提出的是实现人口在空间单元内遵循人口分布规律的空间化分布的一种尝试。
|
| [43] |
Extraction and application of relief of China based on DEM and GIS method. https://doi.org/10.3969/j.issn.1000-288X.2001.01.015 URL [本文引用: 1] 摘要
基于全国 1:10 0万的栅格数字高程模型 ( DEM)数据 ,在 ARC/ INFO的 GRID模块支持下 ,利用窗口分析方法 ,经过采样统计 ,确定中国水土流失地形起伏度的最佳分析窗口大小为 5 km× 5 km;基于 5 km× 5 km的分析窗口 ,提取了中国水土流失地形起伏度 ,完成了中国水土流失地形起伏度制图 ;最后对中国水土流失地形起伏度进行了适用性分析 ,并将其初步应用于中国潜在水土流失评价
中国地形起伏度的提取及在水土流失定量评价中的应用 .https://doi.org/10.3969/j.issn.1000-288X.2001.01.015 URL [本文引用: 1] 摘要
基于全国 1:10 0万的栅格数字高程模型 ( DEM)数据 ,在 ARC/ INFO的 GRID模块支持下 ,利用窗口分析方法 ,经过采样统计 ,确定中国水土流失地形起伏度的最佳分析窗口大小为 5 km× 5 km;基于 5 km× 5 km的分析窗口 ,提取了中国水土流失地形起伏度 ,完成了中国水土流失地形起伏度制图 ;最后对中国水土流失地形起伏度进行了适用性分析 ,并将其初步应用于中国潜在水土流失评价
|
| [44] |
Relation between satellite observed visible near infrared emissions, population, economic activity and electric power consumption. |
| [45] |
Overview of researches based on DMSP/OLS nighttime light data. https://doi.org/10.11820/dlkxjz.2012.01.002 URL [本文引用: 1] 摘要
DMSP/OLS夜间灯光数据 主要包括稳定灯光数据、辐射标定夜间灯光强度数据、非辐射标定夜间灯光强度数据3种产品。该数据产品具有获取容易、能够探测低强度灯光、不受光线阴影影 响、方便为城市化强度及其时空分异分析提供条件等优点。目前,关于DMSP/OLS数据的研究成果已有很多,主要集中于城市发展研究、人类活动及效应研 究、生态环境影响研究等方面,但对成果的系统归纳总结性研究却几乎没有。基于此,本文分析比较了现有DMSP/OLS数据研究实例,针对已有成果研究目 的、技术方法以及方法优缺点等进行归纳总结,探索DMSP/OLS夜间灯光平均强度数据的应用前景。最后,总结了该数据的未来研究趋势:①对数据本身处理 方法深入研究;②数据应用领域应进一步扩展;③DMSP/OLS数据与其他数据模型的集成研究应进一步深化;④将现有研究成果结合,进一步研究地理现象机 制问题。
DMSP/OLS数据应用研究综述 .https://doi.org/10.11820/dlkxjz.2012.01.002 URL [本文引用: 1] 摘要
DMSP/OLS夜间灯光数据 主要包括稳定灯光数据、辐射标定夜间灯光强度数据、非辐射标定夜间灯光强度数据3种产品。该数据产品具有获取容易、能够探测低强度灯光、不受光线阴影影 响、方便为城市化强度及其时空分异分析提供条件等优点。目前,关于DMSP/OLS数据的研究成果已有很多,主要集中于城市发展研究、人类活动及效应研 究、生态环境影响研究等方面,但对成果的系统归纳总结性研究却几乎没有。基于此,本文分析比较了现有DMSP/OLS数据研究实例,针对已有成果研究目 的、技术方法以及方法优缺点等进行归纳总结,探索DMSP/OLS夜间灯光平均强度数据的应用前景。最后,总结了该数据的未来研究趋势:①对数据本身处理 方法深入研究;②数据应用领域应进一步扩展;③DMSP/OLS数据与其他数据模型的集成研究应进一步深化;④将现有研究成果结合,进一步研究地理现象机 制问题。
|

/
| 〈 |
|
〉 |


