×
模态框(Modal)标题
在这里添加一些文本
Close
Close
Submit
Cancel
Confirm
×
模态框(Modal)标题
×
Journal
Article
Figure
Search
EN
中文
Home
About Journal
About Journal
Indexed in
Awards
Editorial Board
Guide for Authors
Browse
Current Issue
Online First
Archive
Highlights
Topic
Archive by Subject
Most Viewed
Most Download
Most Cited
E-mail Alert
RSS
Subscribe
Advertisement
Contact us
EN
中文
Figure/Table detail
Carbon peak prediction for Yangtze River Delta urban agglomeration based on spatially embedded GA-LSTM model
SHI Changfeng, YU Yue, YAO Xiao, PANG Qinghua
Acta Geographica Sinica
, 2024, 79(
11
): 2895-2914. DOI:
10.11821/dlxb202411013
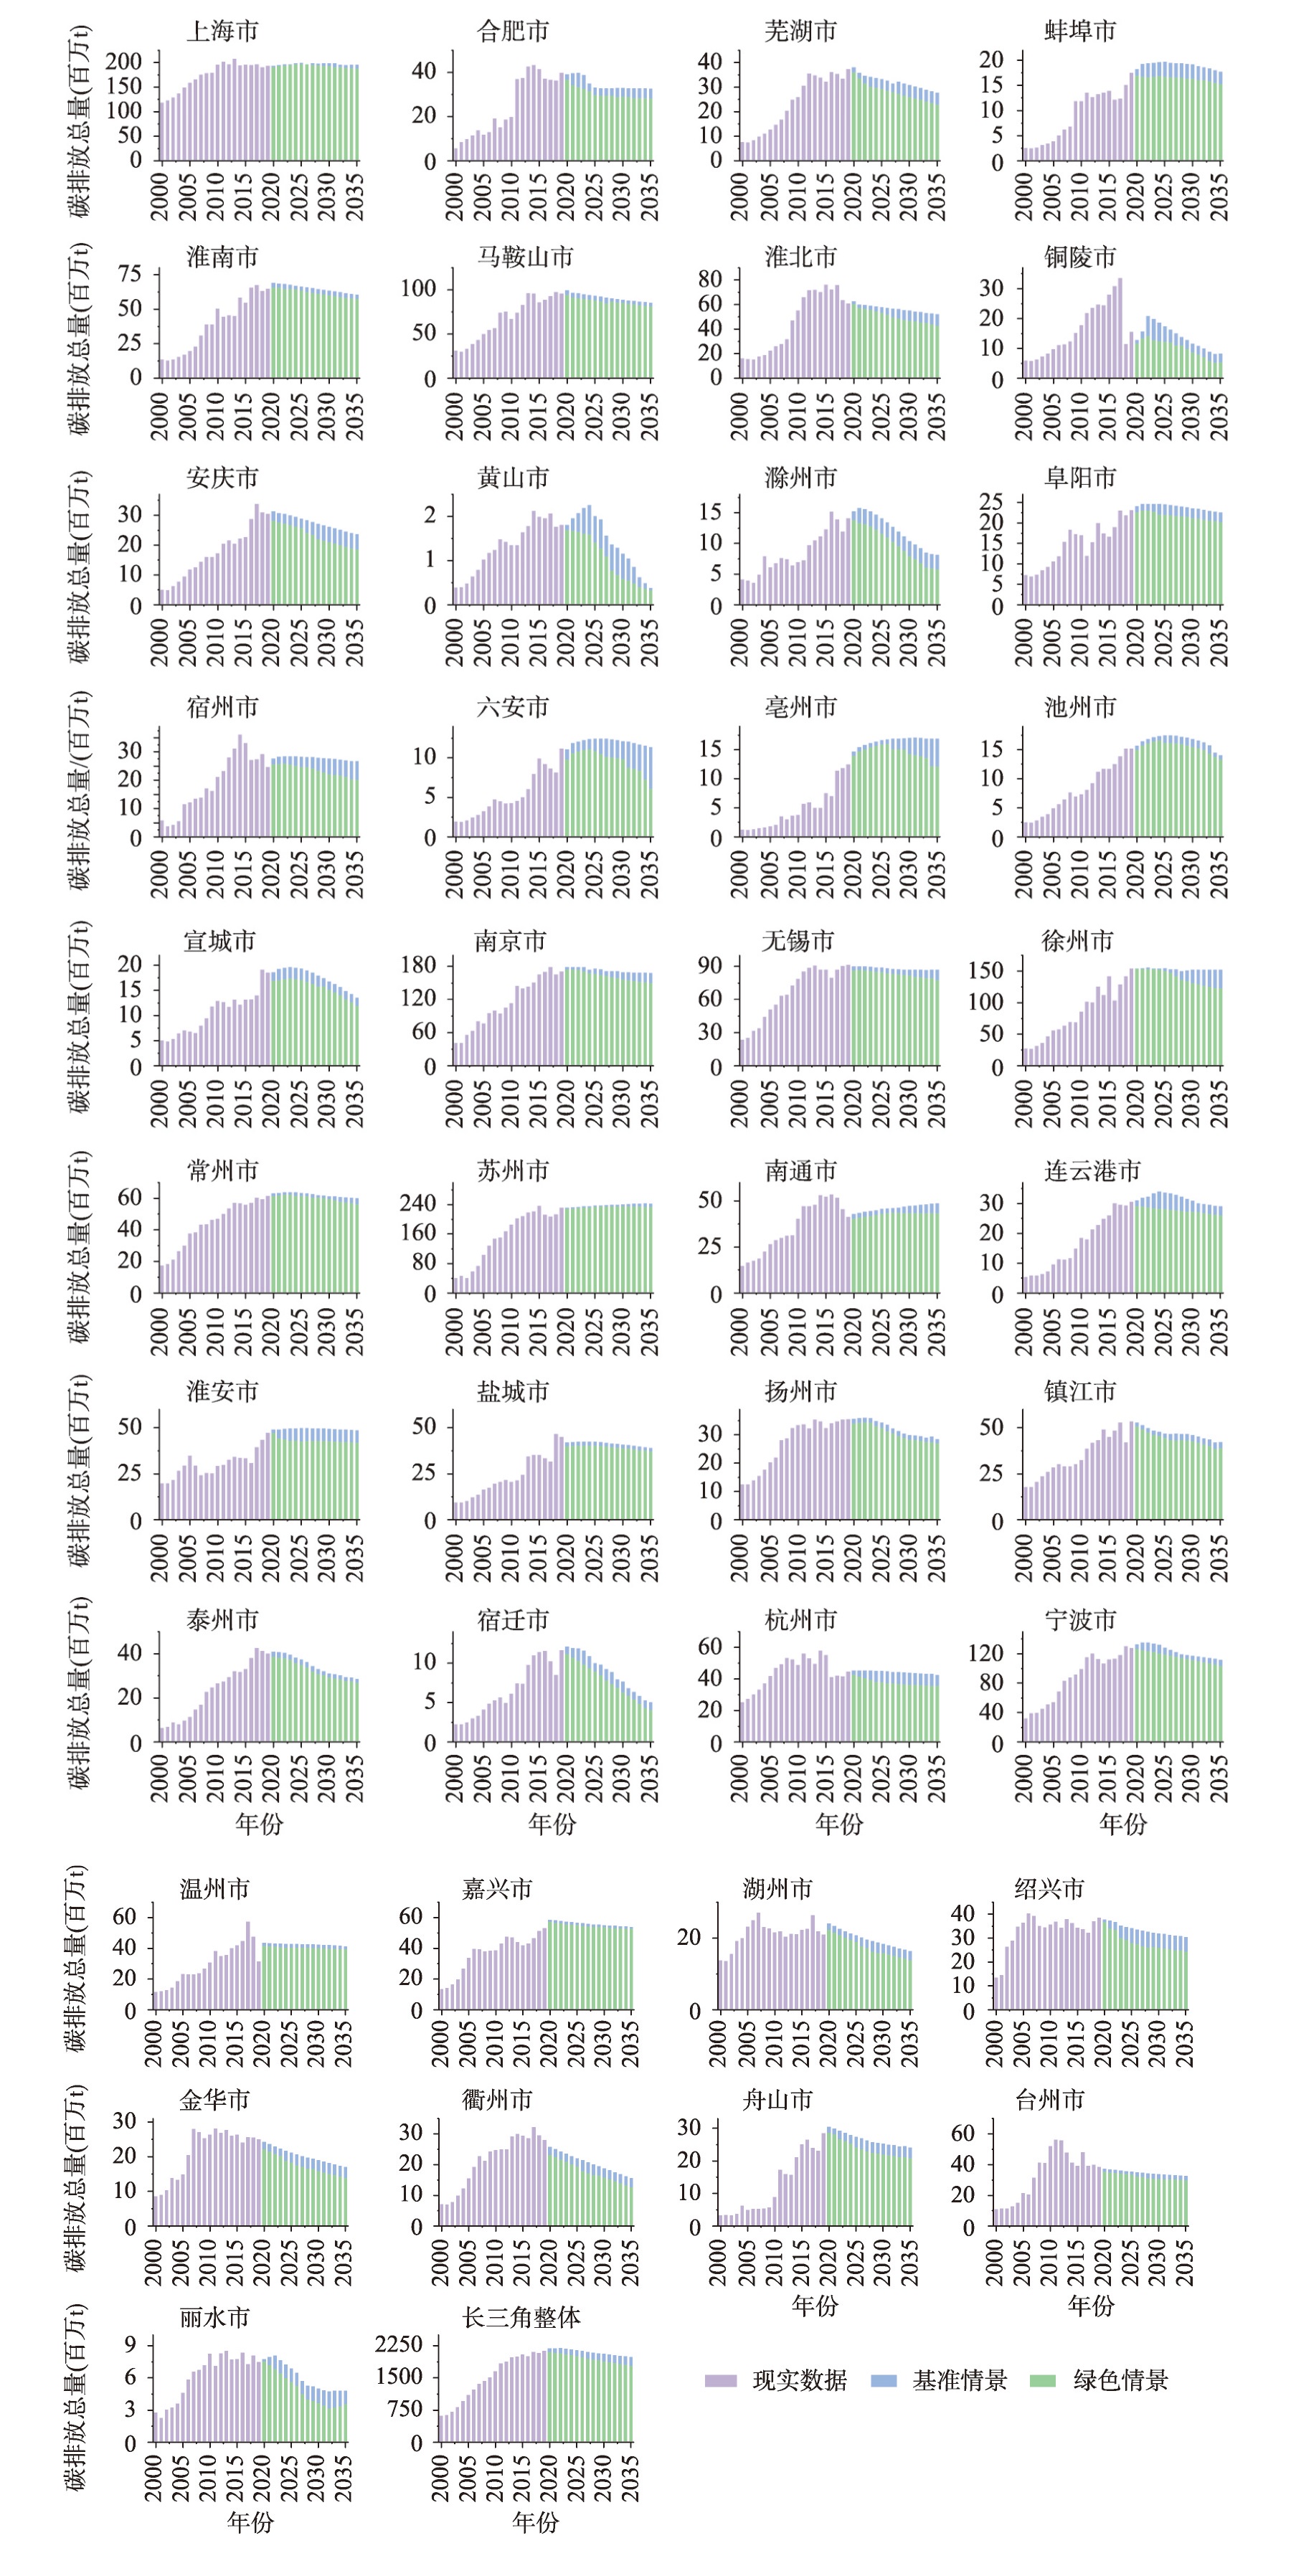
Fig. 7
Comparison of prediction results based on spatially embedded GA-LSTM model under baseline and green scenarios
Other figure/table from this article
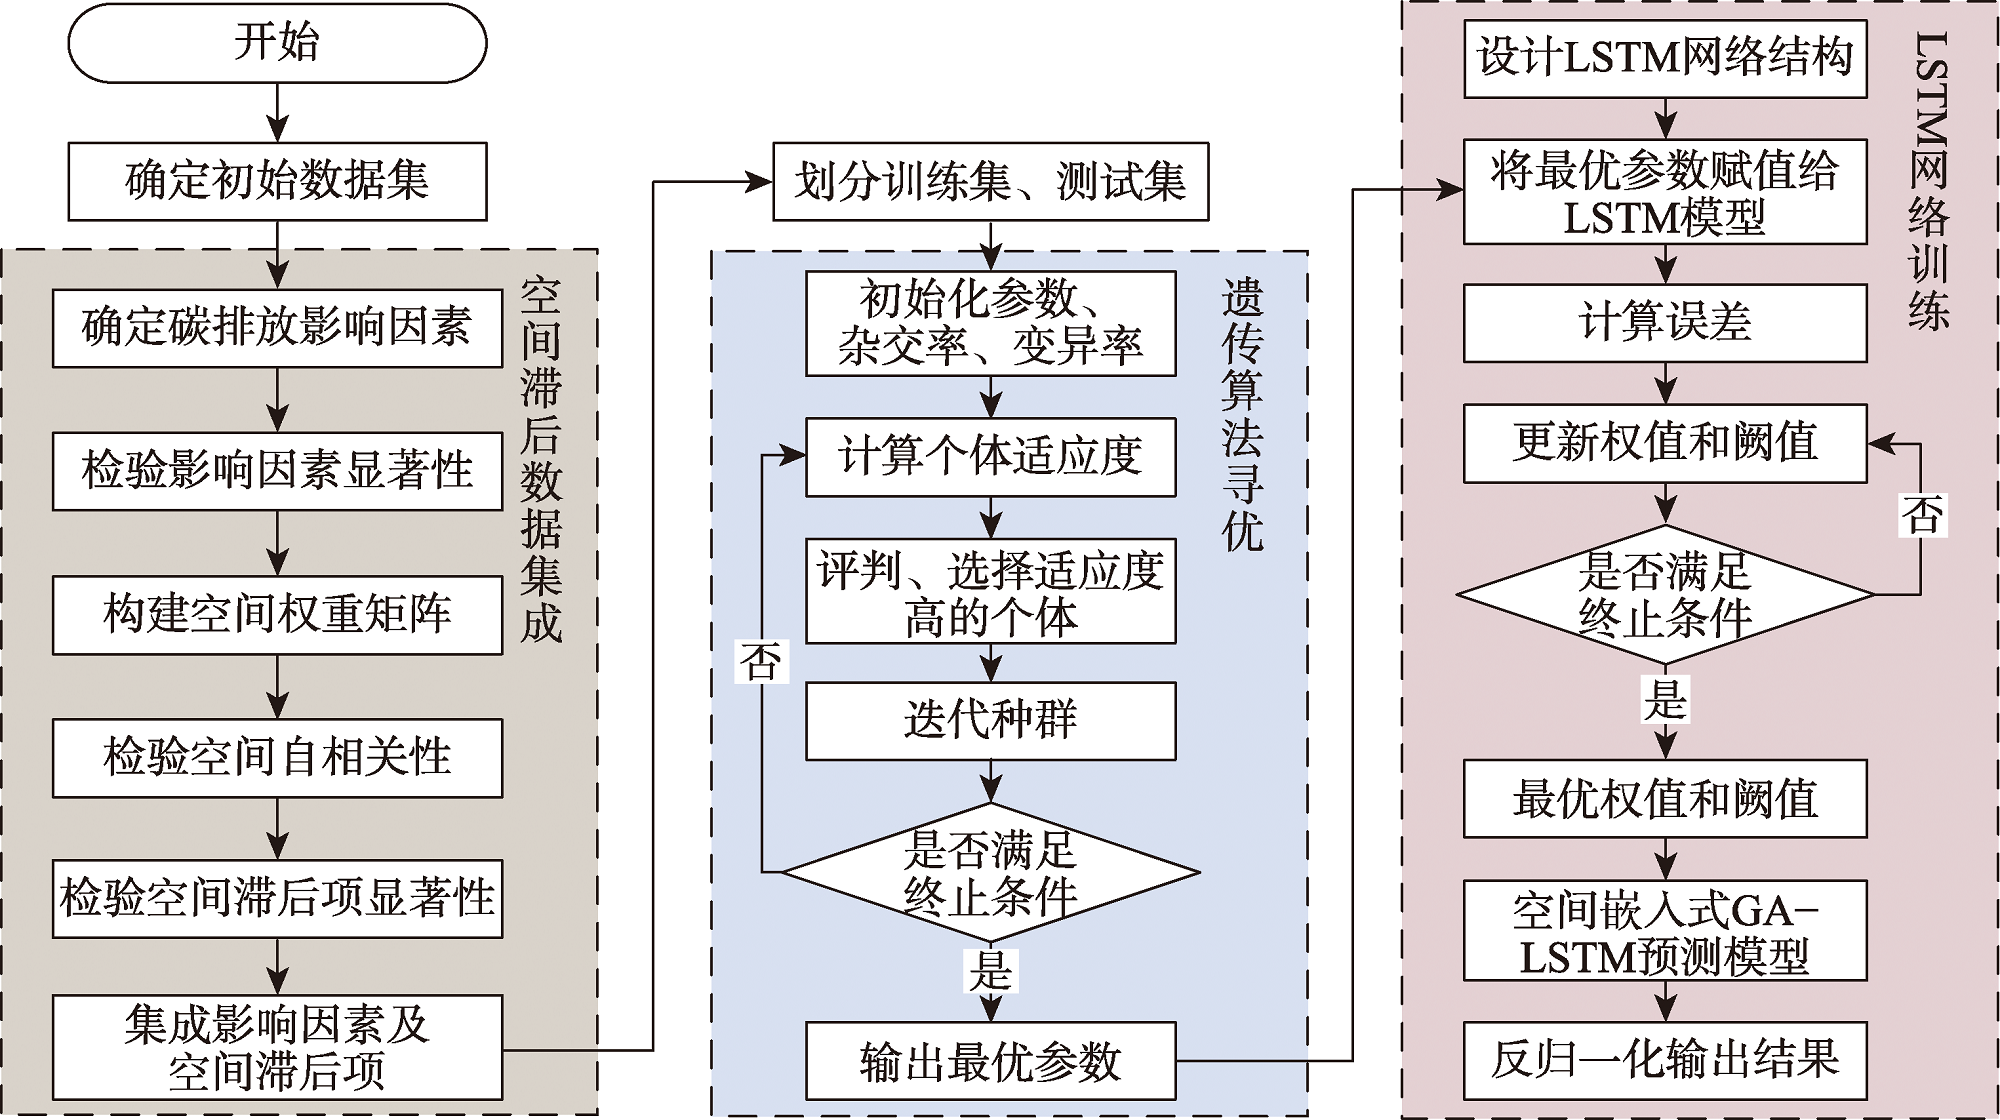
Fig. 1
Flowchart of spatially embedded GA-LSTM model
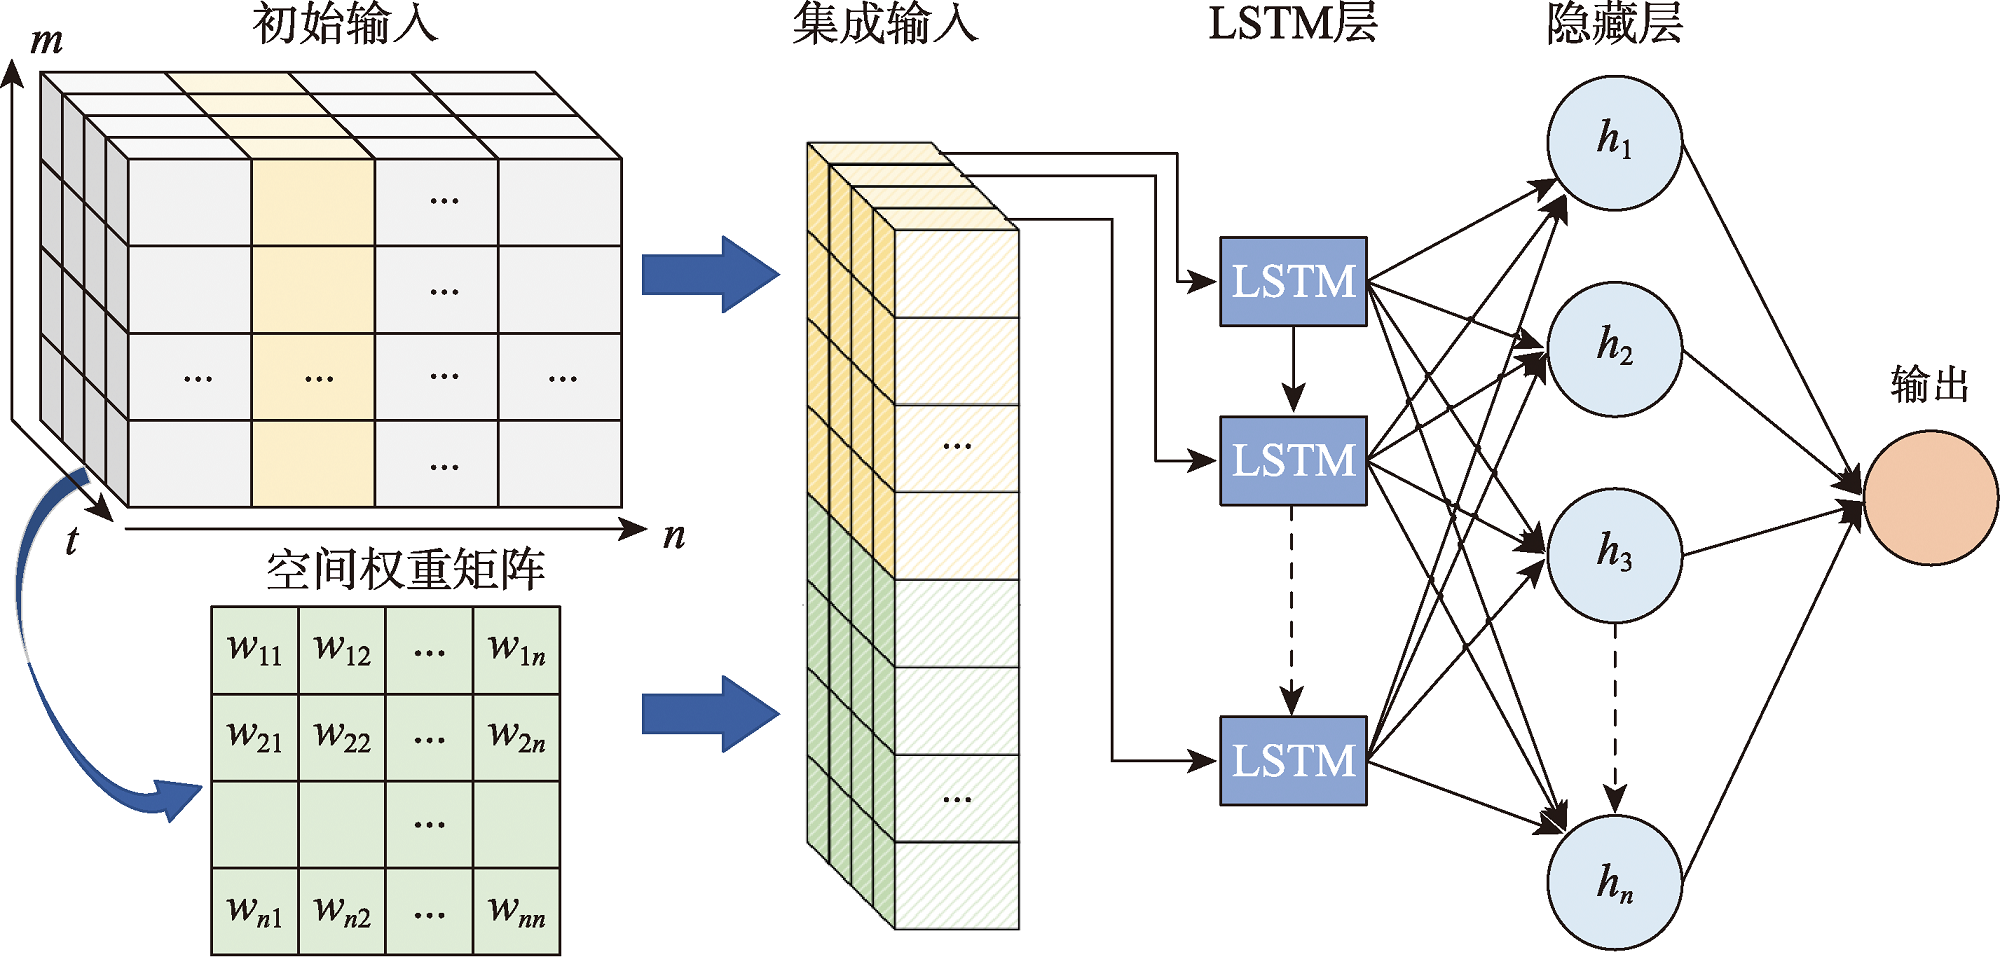
Fig. 2
Structure of spatially embedded LSTM model
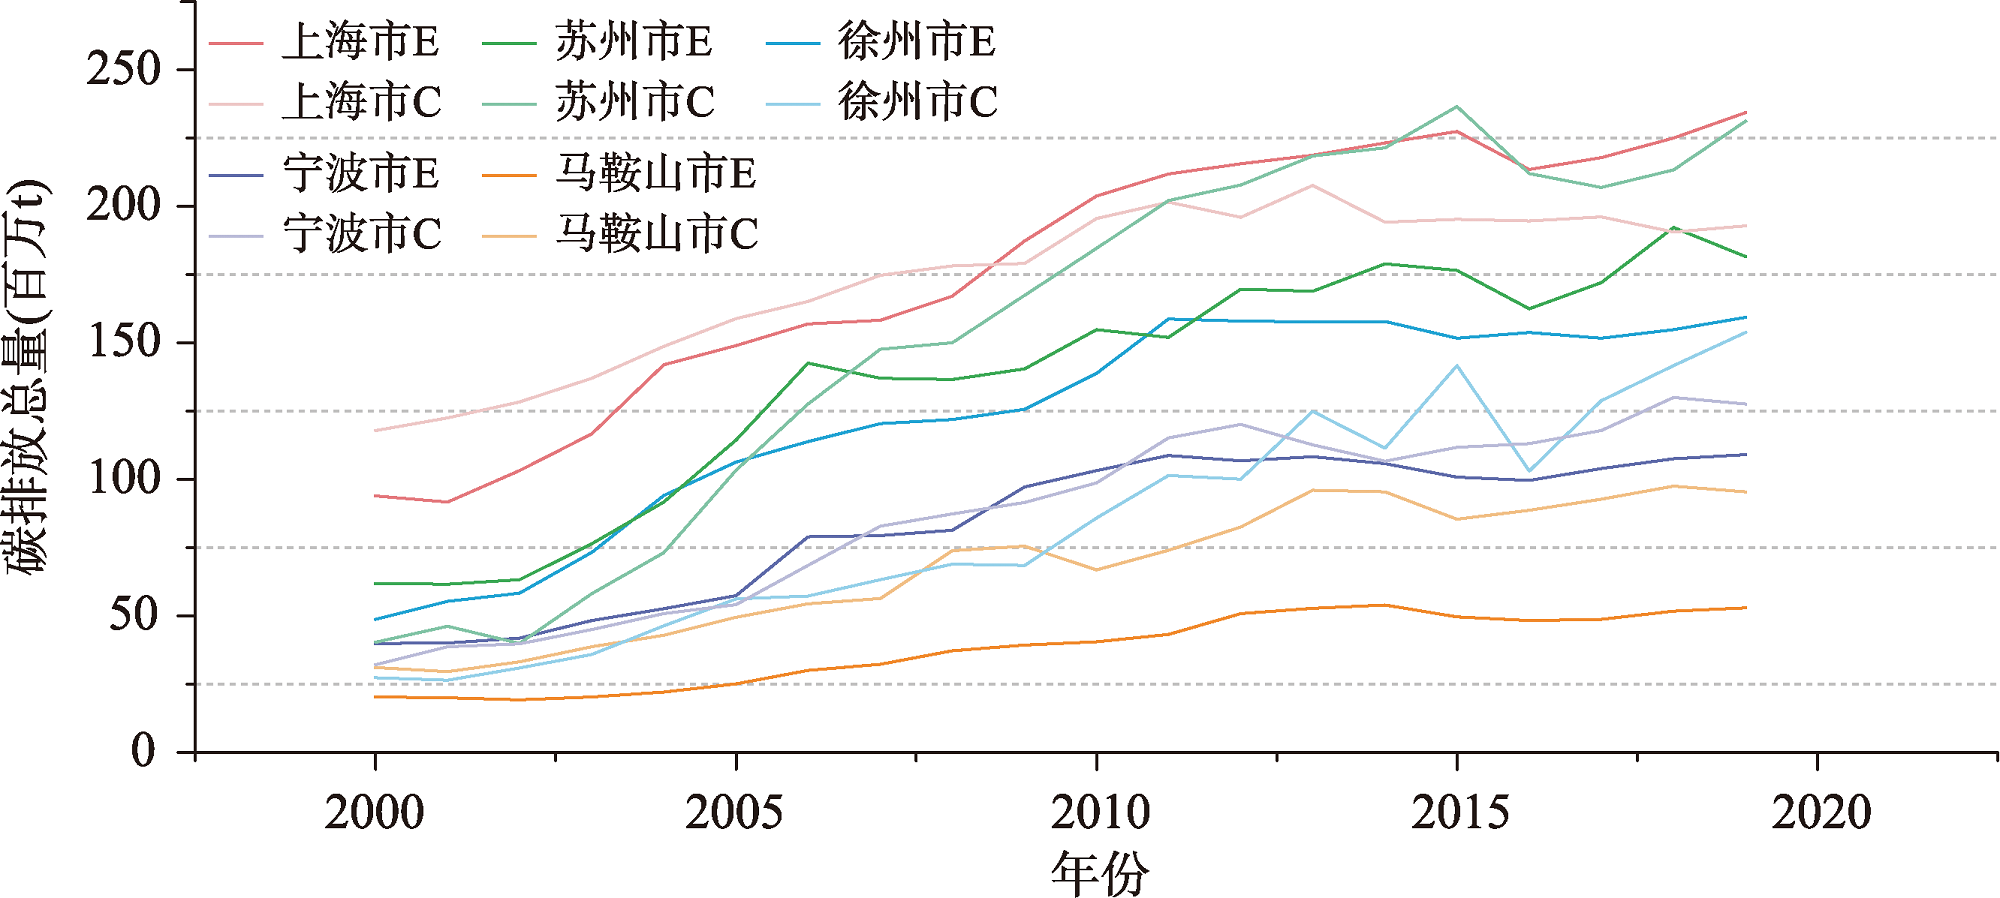
Fig. 3
Comparison of city carbon emission trends from two data sources
Tab. 1
Scenario variables setting for Shanghai
Tab. 2
Spatial autocorrelation test of carbon emissions in the Yangtze River Delta urban agglomeration, 2000-2019
Tab. 3
Verification of spatial panel models
Tab. 4
Estimated results of regression model
Tab. 5
Performance evaluation of different predictive models
Tab. 6
Metrics for ablation experiments based on spatially embedded GA-LSTM model
Fig. 4
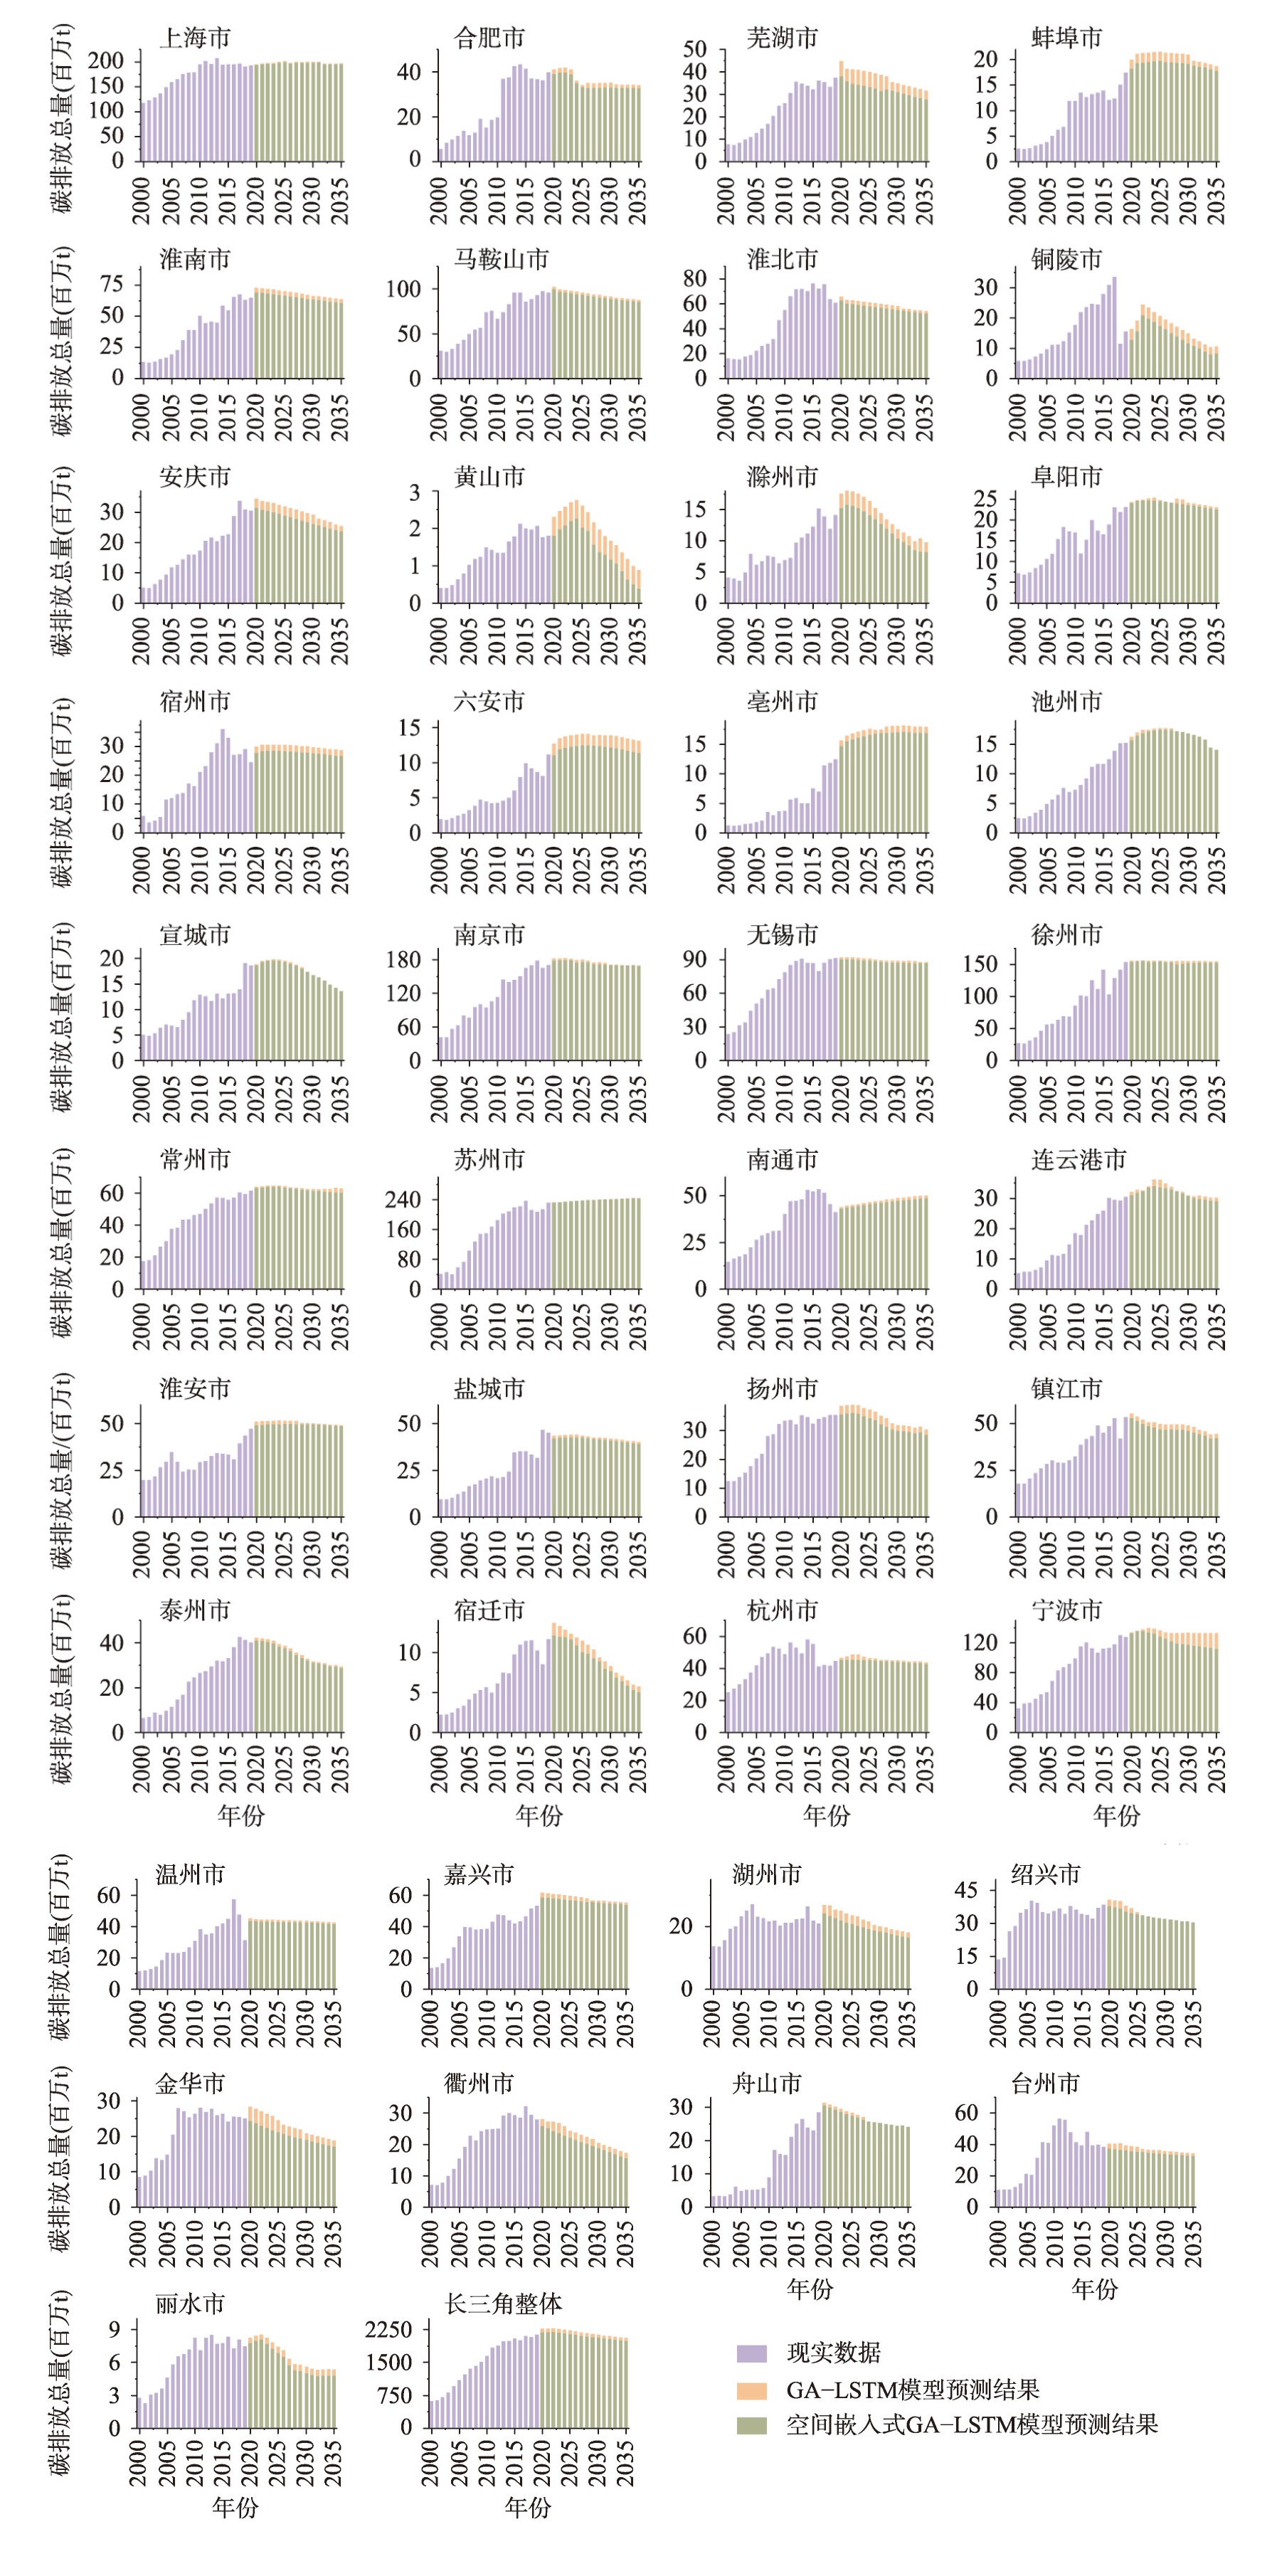
Comparison of prediction results based on spatially embedded GA-LSTM model and GA-LSTM model
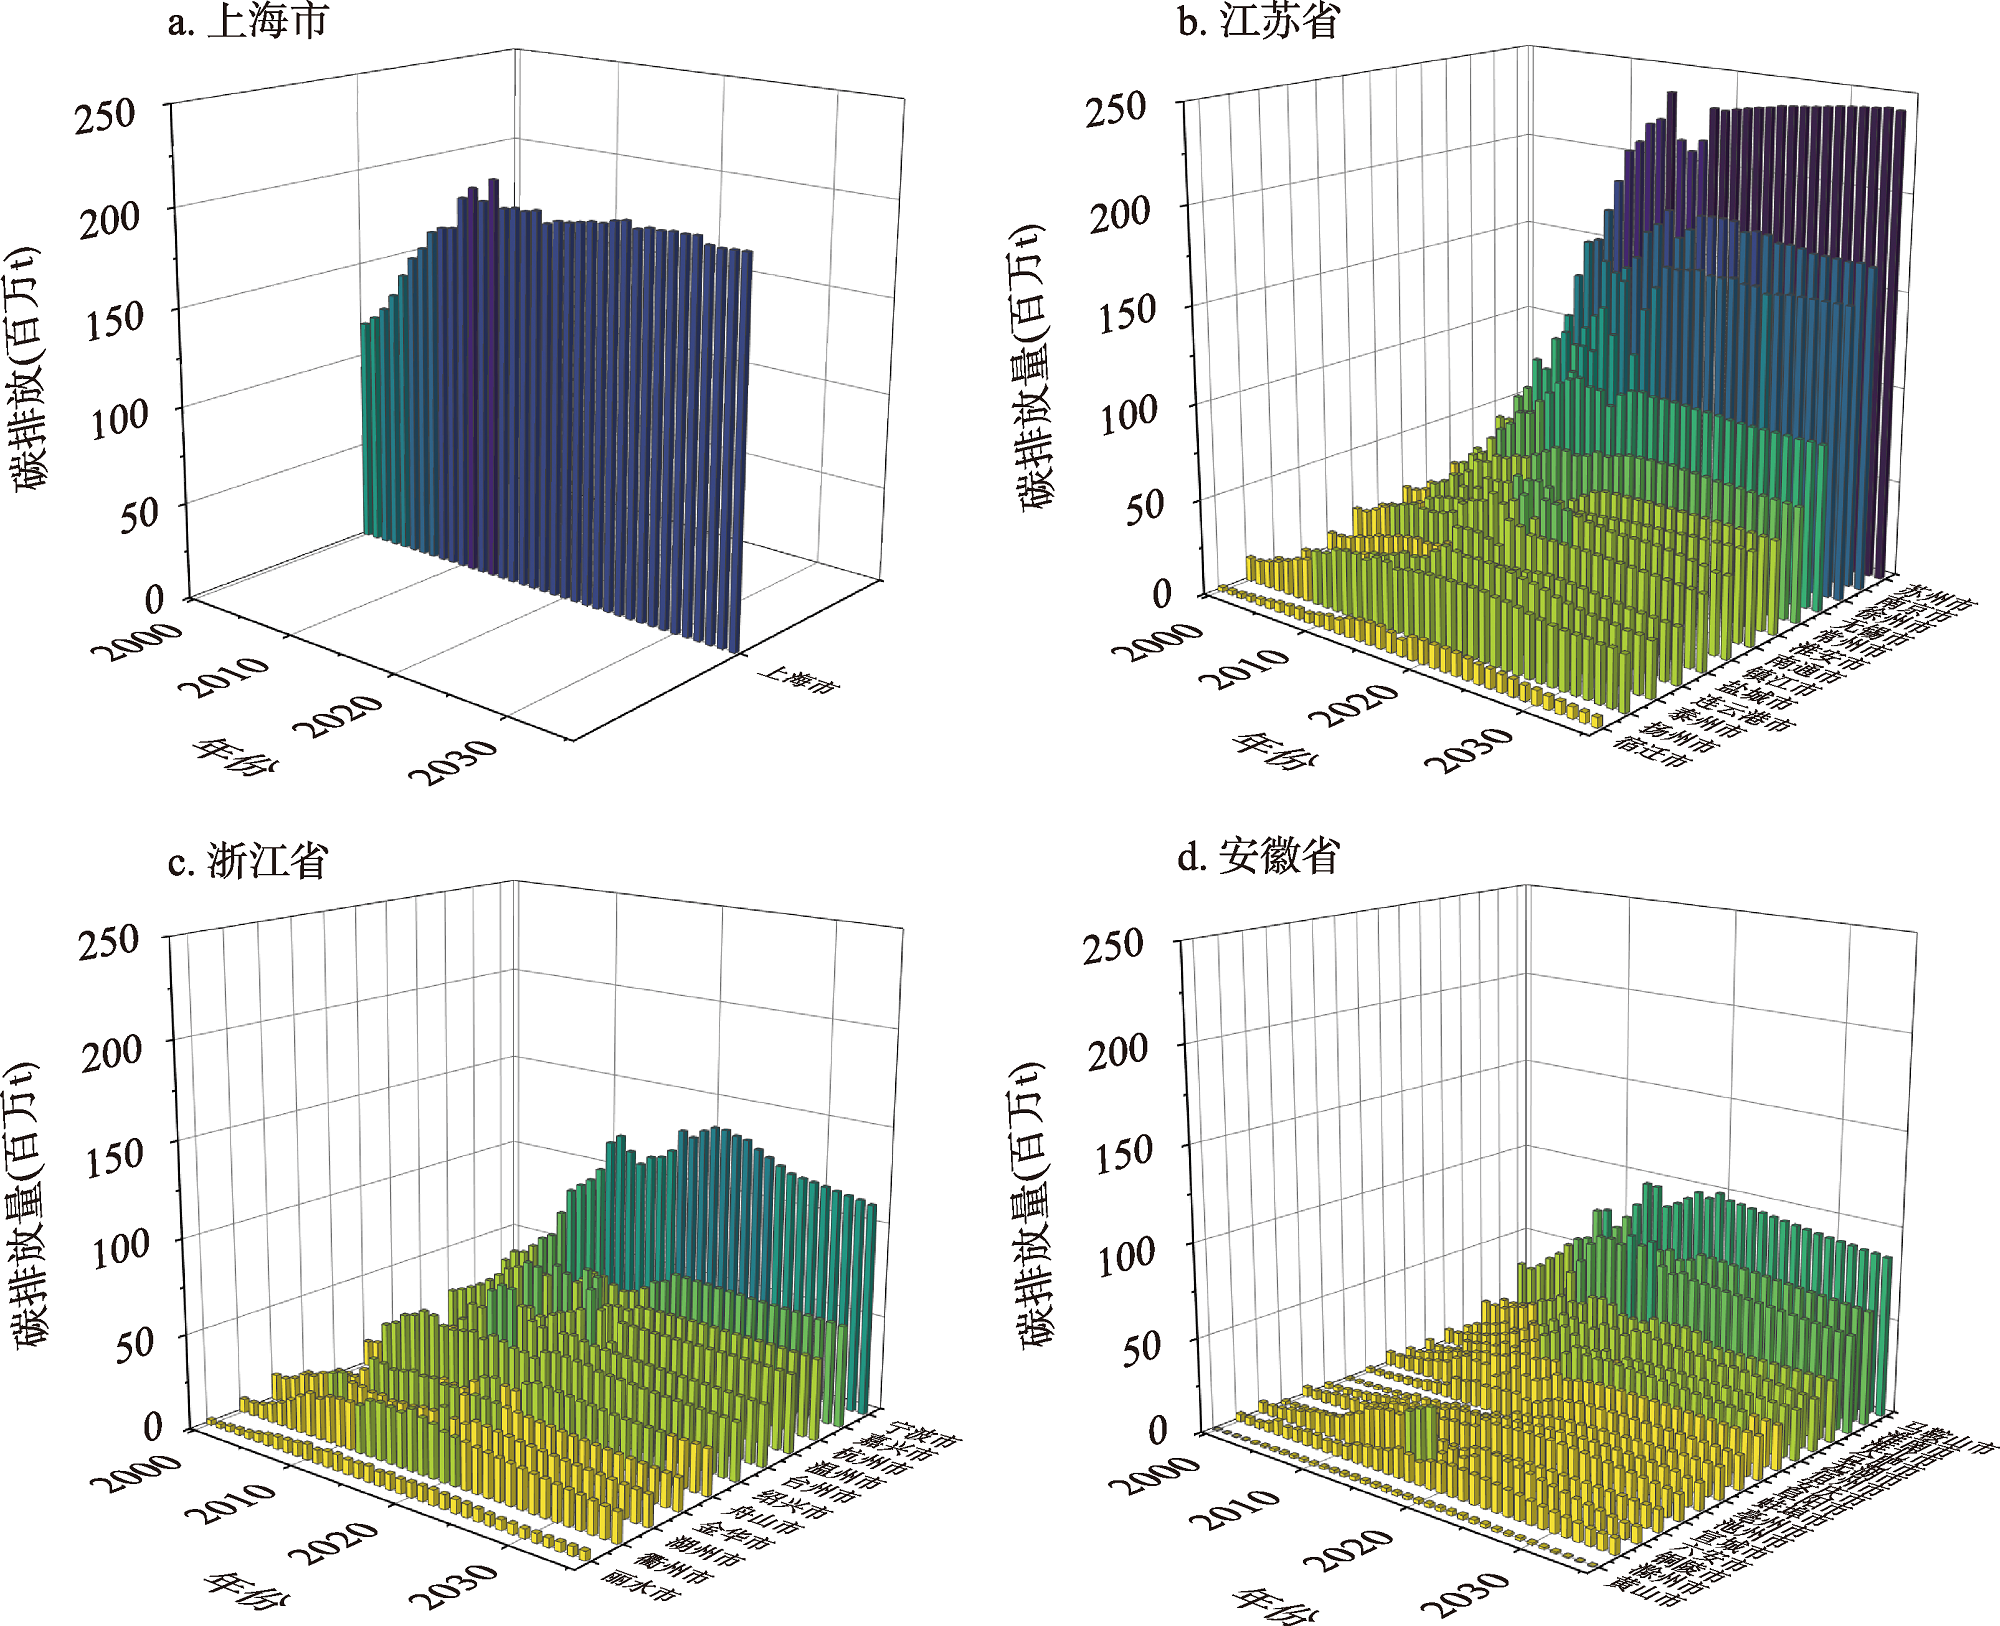
Fig. 5
Historical evolution and prediction results of carbon emissions in the Yangtze River Delta urban agglomeration
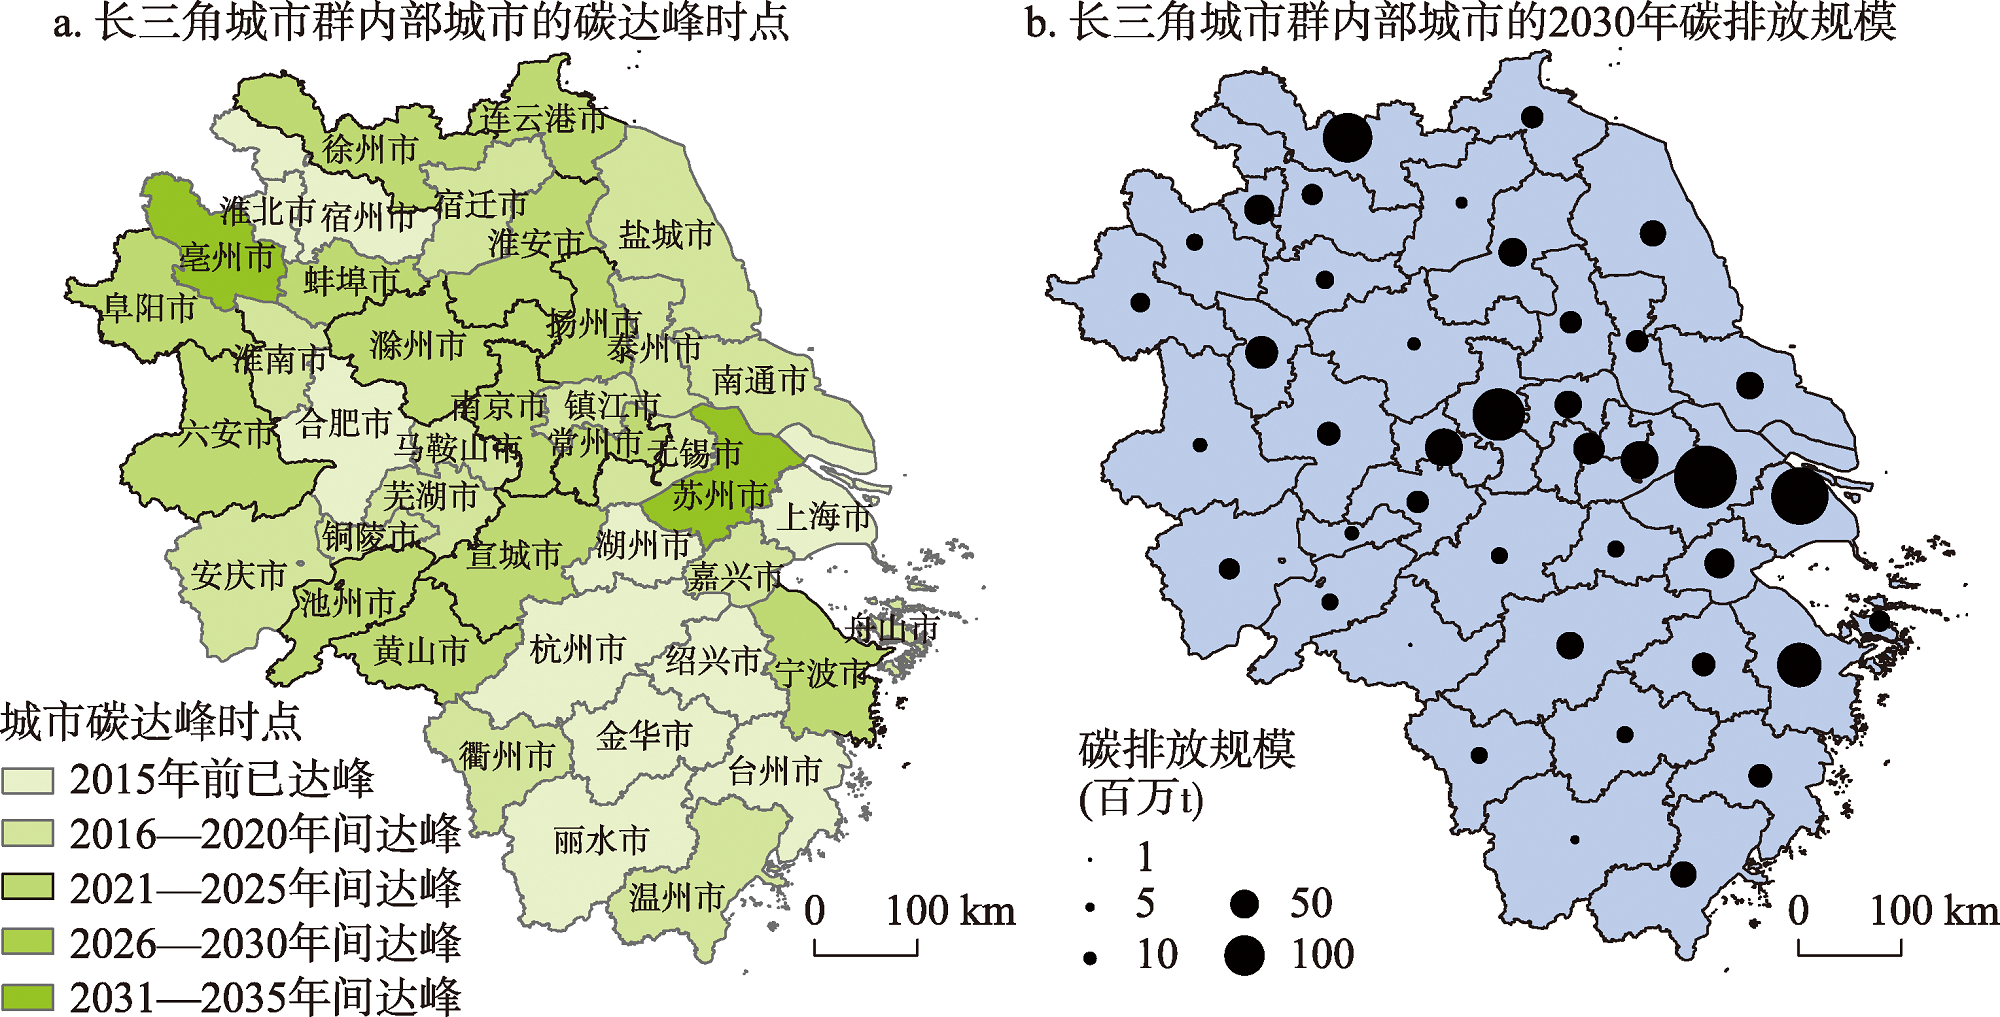
Fig. 6
Peaking time and spatial distribution of carbon emissions in the Yangtze River Delta urban agglomeration