
长江经济带城市生态韧性与生态效率的协调发展及互动效应
|
张明斗(1983-), 男, 山东济宁人, 博士, 教授, 硕士生导师, 研究方向为城市经济。E-mail: zhangmingdou0537@126.com |
收稿日期: 2025-03-18
网络出版日期: 2026-01-27
基金资助
国家自然科学基金项目(71804021)
辽宁省“兴辽英才计划”青年拔尖人才项目(XLYC2007123)
辽宁省社会科学规划基金重点建设学科项目(L24ZD029)
Coordinated development and interactive effects of urban ecological resilience and eco-efficiency in the Yangtze River Economic Belt
Received date: 2025-03-18
Online published: 2026-01-27
Supported by
National Natural Science Foundation of China(71804021)
Young Top Talent Foundation of "Rejuvenating Liaoning Talents Program" in Liaoning Province(XLYC2007123)
Key Discipline Development Project of the Liaoning Provincial Social Science Planning Foundation(L24ZD029)
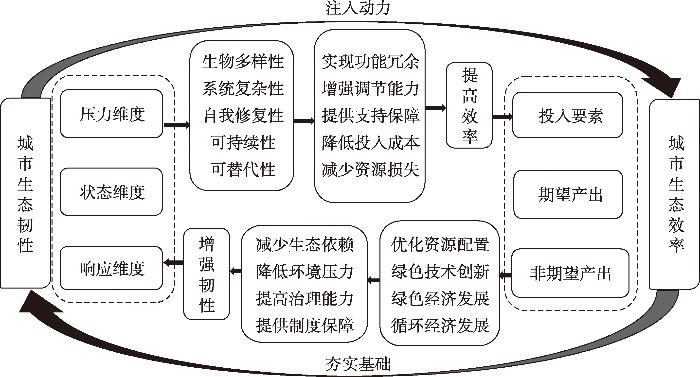
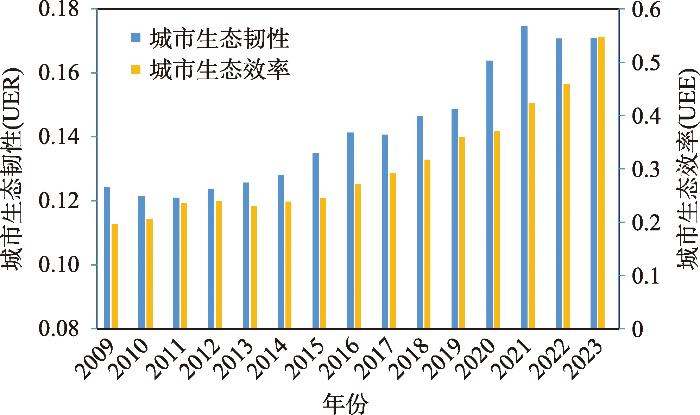
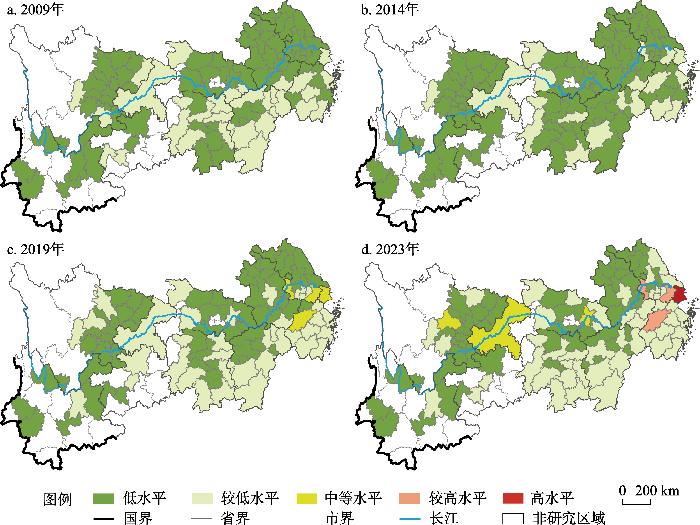
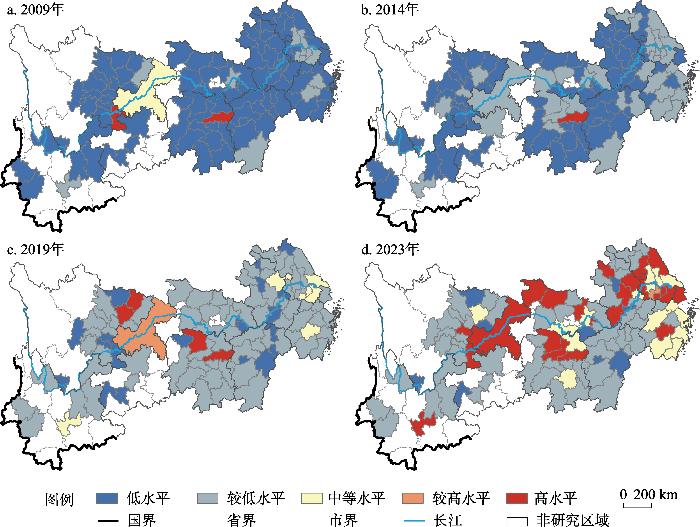
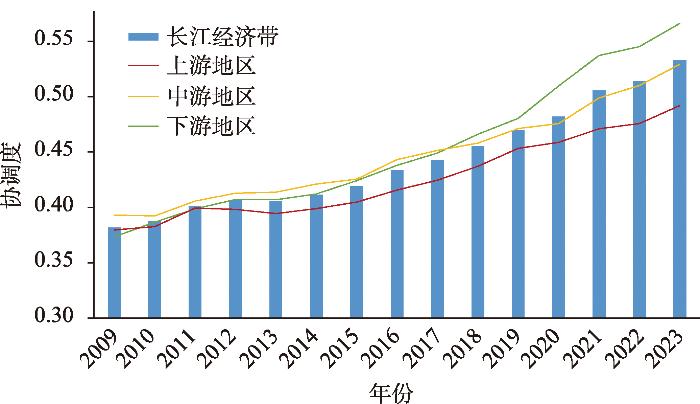
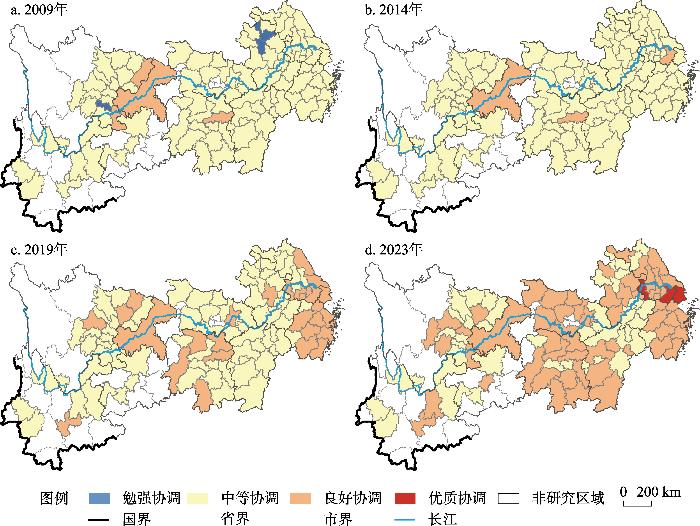
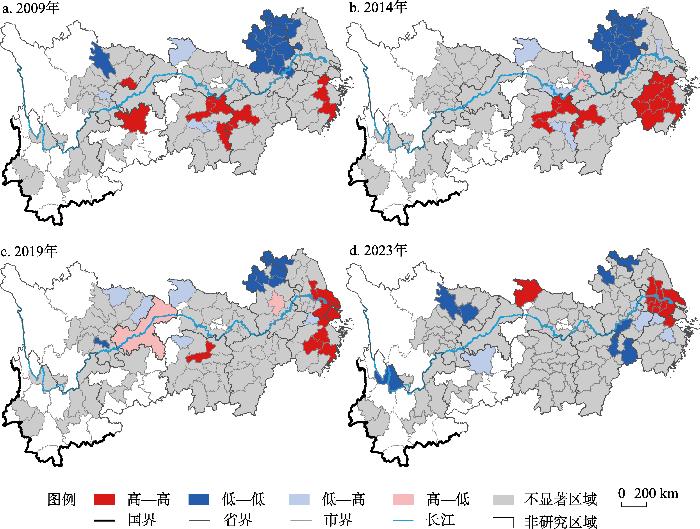
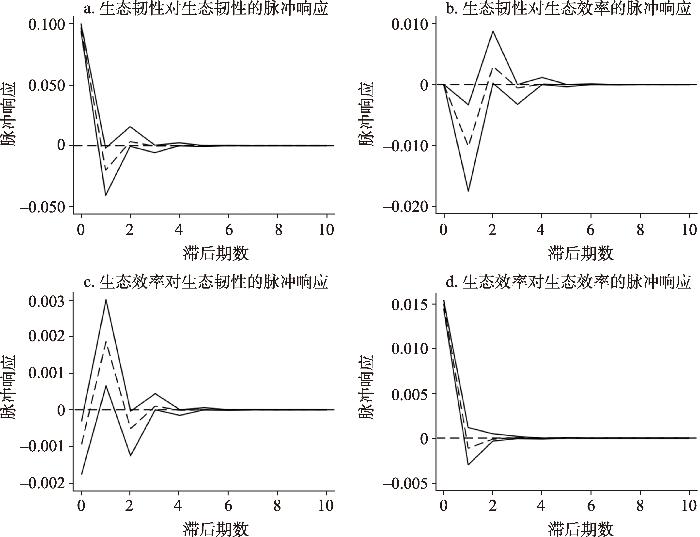
本文以长江经济带107个地级及以上城市为研究样本,采用耦合协调度模型、空间自相关模型与面板向量自回归模型,分析了其2009—2023年生态韧性与生态效率的协调性及互动效应。结果表明:① 2009—2023年长江经济带城市生态韧性呈现出波动上升的趋势,由2009年的0.1242上升至2023年的0.1709,年均增长率为2.31%;在空间上展现出“南高北低”的格局特征。城市生态效率呈现逐年上升的特征,由2009年的0.1960上升至2023年的0.5475,年均增长率为7.61%;在空间上展现出“下游地区>中游地区>上游地区”的格局特征。② 长江经济带城市生态韧性与生态效率的协调度波动上升,由2009年的0.3818上升为2023年的0.5329,年均增长率为2.41%;且呈现出“下游地区>中游地区>上游地区”的空间格局特征。③ 长江经济带城市生态韧性与生态效率的协调度存在空间正相关,但集聚强度呈衰减趋势,具体表现为,上游地区新兴集聚区萌发,而下游地区集聚范围呈收缩态势,特别是安徽地区低—低集聚区大幅缩减。④ 长江经济带城市生态韧性与生态效率存在动态交互效应。二者互为Granger因果关系,对彼此的影响呈波动态势,但整体仍是积极影响,而相较于彼此的交互影响作用,城市生态韧性与生态效率对各自的影响效应更强。

张明斗 , 邓岚峰 , 王传超 . 长江经济带城市生态韧性与生态效率的协调发展及互动效应[J]. 地理学报, 2026 , 81(1) : 201 -218 . DOI: 10.11821/dlxb202601012
Taking 107 prefecture-level and above cities in the Yangtze River Economic Belt as research samples, this study empirically examines the coordination and interactive effects of their ecological resilience and eco-efficiency during the period of 2009-2023 by using the coupled coordination model, the spatial autocorrelation model, and the panel vector autoregression model. The results show that: (1) between 2009 and 2023, the urban ecological resilience in the study area had been increasing year by year, from 0.1242 in 2009 to 0.1709 in 2023, with an average annual growth rate of 2.31%, and showed a spatial pattern of "high in the south and low in the north". The urban ecological efficiency demostrated a steady upward trend, rising from 0.1960 in 2009 to 0.5475 in 2023, with an average annual growth rate of 7.61%, and a spatial pattern of "downstream region > midstream region > upstream region". (2) The coordination degree between urban ecological resilience and eco-efficiency increased with fluctuation from 0.3818 in 2009 to 0.5329 in 2023, averaging an annual growth rate of 2.41%; and the spatial pattern is characterized by "downstream region > midstream region > upstream region". (3) There is a spatial positive correlation between urban ecological resilience and eco-efficiency coordination degrees, but the intensity of agglomeration presents a decaying trend, which is manifested by the sprouting of emerging agglomerations in the upstream and the contraction of the scope of agglomeration in the downstream, especially in Anhui, where the low-low agglomeration area is drastically shrinking. (4) A dynamic interactive effect exists between urban ecological resilience and eco-efficiency. While the interaction exhibits fluctuations, the net effect is positive. Furthermore, the inertia of each system exerts a stronger influence on its own development than their cross-impact.
表1 城市生态韧性评价指标体系Tab. 1 Evaluation index system of urban ecological resilience |
| 目标层 | 一级指标 | 二级指标 | 方向 | 权重 |
|---|---|---|---|---|
| 城市生态韧性 | 压力维度 | 单位GDP电耗(度/元) | - | 0.0394 |
| 工业粉尘排放量(t) | - | 0.0361 | ||
| 景观脆弱度(-) | - | 0.0470 | ||
| 空气质量指数(-) | - | 0.0387 | ||
| 人口密度(人/km2) | - | 0.0424 | ||
| 状态维度 | 人均公园绿地面积(m2) | + | 0.0563 | |
| 建成区绿化覆盖率(%) | + | 0.0425 | ||
| 生物丰度指数(-) | + | 0.0482 | ||
| 单位面积水资源总量(m3/km2) | + | 0.1780 | ||
| 归一化植被指数(-) | + | 0.1128 | ||
| 响应维度 | 污染治理投资额(亿元) | + | 0.1707 | |
| 污水处理厂集中处理率(%) | + | 0.0440 | ||
| 生活垃圾无害化处理率(%) | + | 0.0455 | ||
| 环保支出占地方财政支出比(%) | + | 0.0982 |
表2 城市生态效率评价指标体系Tab. 2 Evaluation index system of urban eco-efficiency |
| 目标层 | 指标类别 | 一级指标 | 二级指标 | 单位 |
|---|---|---|---|---|
| 城市生态效率 | 投入要素 | 资本投入 | 固定资产投资总额 | 万元 |
| 土地投入 | 建设用地面积 | km2 | ||
| 劳动投入 | 年末从业人员数 | 万人 | ||
| 产出要素 | 期望产出 | GDP | 亿元 | |
| 非期望产出 | 工业废水排放量 | 万t | ||
| 工业废气排放量 | t | |||
| t | ||||
| 工业固体废物排放量 |
表3 长江经济带城市生态韧性与生态效率协调度的Moran's I统计量Tab. 3 Moran's I statistic of the coordination degrees between urban ecological resilience and eco-efficiency in the Yangtze River Economic Belt |
| 年份 | 2009 | 2010 | 2011 | 2012 | 2013 |
|---|---|---|---|---|---|
| Moran's I | 0.2322 | 0.2438 | 0.1858 | 0.3057 | 0.2788 |
| Z检验 | 3.7607 | 4.1074 | 3.2128 | 4.8574 | 4.4073 |
| P值 | 0.0020 | 0.0010 | 0.0040 | 0.0010 | 0.0010 |
| 年份 | 2014 | 2015 | 2016 | 2017 | 2018 |
| Moran's I | 0.2563 | 0.3258 | 0.2554 | 0.2838 | 0.2675 |
| Z检验 | 4.0935 | 5.0856 | 4.0373 | 4.4084 | 4.1783 |
| P值 | 0.0010 | 0.0010 | 0.0010 | 0.0010 | 0.0010 |
| 年份 | 2019 | 2020 | 2021 | 2022 | 2023 |
| Moran's I | 0.1558 | 0.1422 | 0.1499 | 0.1671 | 0.1751 |
| Z检验 | 2.4979 | 2.2068 | 2.3637 | 2.5992 | 2.7616 |
| P值 | 0.0120 | 0.0190 | 0.0150 | 0.0110 | 0.0080 |
表4 方差分解结果Tab. 4 Results of the variance decomposition |
| 模型 | 响应变量 | 冲击变量 (%) | 预测期 | |||||
|---|---|---|---|---|---|---|---|---|
| 1 | 2 | 3 | 4 | 5 | 6 | |||
| 城市生态韧性与生态效率 | dUER | dUER | 100.0000 | 99.1394 | 99.0627 | 99.0599 | 99.0598 | 99.0598 |
| dUEE | 0 | 0.8606 | 0.9373 | 0.9401 | 0.9402 | 0.9402 | ||
| dUEE | dUER | 0.0362 | 1.6998 | 1.8496 | 1.8554 | 1.8555 | 1.8555 | |
| dUEE | 99.9638 | 98.3002 | 98.1504 | 98.1446 | 98.1445 | 98.1445 | ||
| [1] |
[陆大道. 建设经济带是经济发展布局的最佳选择: 长江经济带经济发展的巨大潜力. 地理科学, 2014, 34(7): 769-772.]
|
| [2] |
[李雪松, 张雨迪, 孙博文. 区域一体化促进了经济增长效率吗? 基于长江经济带的实证分析. 中国人口·资源与环境, 2017, 27(1): 10-19.]
|
| [3] |
[李勇辉, 沈波澜, 胡舜, 等. 生产性服务业集聚空间效应与城市技术创新: 基于长江经济带108个城市面板数据的实证分析. 经济地理, 2021, 41(11): 65-76.]
|
| [4] |
[邓宗兵, 宗树伟, 苏聪文, 等. 长江经济带生态文明建设与新型城镇化耦合协调发展及动力因素研究. 经济地理, 2019, 39(10): 78-86.]
|
| [5] |
[汪德根, 孙枫. 长江经济带陆路交通可达性与城镇化空间耦合协调度. 地理科学, 2018, 38(7): 1089-1097.]
|
| [6] |
[李燕凌, 李民梁. 长江经济带新型城镇化与生态韧性: 耦合协调、时空格局及动态影响. 长江流域资源与环境, 2024, 33(11): 2329-2341.]
|
| [7] |
[彭文斌, 邝嫦娥, 李文意, 等. 长江中游城市群城市更新与生态韧性空间关联网络及影响研究. 地理科学, 2024, 44(11): 1936-1945.]
|
| [8] |
[陈明华, 刘文斐, 王山, 等. 长江经济带城市生态效率的时空分异及其驱动因素. 中国人口·资源与环境, 2020, 30(9): 121-127.]
|
| [9] |
[刘华军, 乔列成, 石印. 重大国家战略区域视角下长江经济带与黄河流域生态效率比较研究. 中国软科学, 2021, 36(10): 73-81.]
|
| [10] |
|
| [11] |
[孙枫, 章锦河, 王培家, 等. 城市生态安全格局构建与评价研究: 以苏州市区为例. 地理研究, 2021, 40(9): 2476-2493.]
|
| [12] |
[刘云强, 权泉, 朱佳玲, 等. 绿色技术创新、产业集聚与生态效率: 以长江经济带城市群为例. 长江流域资源与环境, 2018, 27(11): 2395-2406.]
|
| [13] |
[诸大建, 邱寿丰. 生态效率是循环经济的合适测度. 中国人口·资源与环境, 2006, 16(5): 1-6.]
|
| [14] |
[彭建, 吴健生, 潘雅婧, 等. 基于PSR模型的区域生态持续性评价概念框架. 地理科学进展, 2012, 31(7): 933-940.]
|
| [15] |
|
| [16] |
[孙阳, 张落成, 姚士谋. 基于社会生态系统视角的长三角地级城市韧性度评价. 中国人口·资源与环境, 2017, 27(8): 151-158.]
|
| [17] |
[王松茂, 牛金兰. 山东半岛城市群城市生态韧性的动态演化及障碍因子分析. 经济地理, 2022, 42(8): 51-61.]
|
| [18] |
[张明斗, 任衍婷, 周亮. 黄河流域城市生态韧性时空演变特征及影响因素分析. 干旱区地理, 2024, 47(3): 445-454.]
|
| [19] |
[
|
| [20] |
[任宇飞, 方创琳, 蔺雪芹. 中国东部沿海地区四大城市群生态效率评价. 地理学报, 2017, 72(11): 2047-2063.]
|
| [21] |
[李旭辉, 王经伟. 共同富裕目标下中国城乡建设绿色发展的区域差距及影响因素. 自然资源学报, 2023, 38(2): 419-441.]
|
| [22] |
[杨龙, 胡晓珍. 基于DEA的中国绿色经济效率地区差异与收敛分析. 经济学家, 2010, 11(2): 46-54.]
|
| [23] |
|
| [24] |
[王少剑, 高爽, 黄永源, 等. 基于超效率SBM模型的中国城市碳排放绩效时空演变格局及预测. 地理学报, 2020, 75(6): 1316-1330.]
|
| [25] |
[张明斗, 翁爱华. 东北地区产业结构优化与城市土地集约利用协调性. 自然资源学报, 2022, 37(3): 734-752.]
|
| [26] |
[刘志华, 徐军委, 张彩虹. 科技创新、产业结构升级与碳排放效率: 基于省际面板数据的PVAR分析. 自然资源学报, 2022, 37(2): 508-520.]
|
| [27] |
[王兆峰, 梁志强. 长江经济带城市生态韧性时空演变格局及预测. 长江流域资源与环境, 2025, 34(2): 268-279.]
|
| [28] |
[欧阳晓, 陈键, 魏晓, 等. 长江中游城市群生态韧性时空分异格局与演化机理. 地理学报, 2025, 80(6): 1572-1584.]
|
| [29] |
[曾贤刚, 牛木川. 高质量发展下长江经济带生态效率及影响因素. 中国环境科学, 2020, 40(2): 906-918.]
|
| [30] |
[赵卉心, 孟煜杰. 中国城市数字经济与绿色技术创新耦合协调测度与评价. 中国软科学, 2022, 37(9): 97-107.]
|
/
| 〈 |
|
〉 |