
塔里木河流域溶解性有机物组成特征及对碳排放的潜在驱动机制
|
钱明睿(2000-), 男, 江苏常州人, 硕士生, 研究方向为湖泊碳循环。E-mail: qianmingrui2000@163.com |
收稿日期: 2024-07-04
修回日期: 2025-06-10
网络出版日期: 2025-07-23
基金资助
第三次新疆综合科学考察项目(2022xjkk0102)
国家自然科学基金项目(42322104)
中国科学院青年创新促进会会员人才专项(2021312)
Dissolved organic matter in the Tarim River Basin: Compositional insights and its role in driving carbon emissions
Received date: 2024-07-04
Revised date: 2025-06-10
Online published: 2025-07-23
Supported by
The Third Comprehensive Scientific Expedition to Xinjiang(2022xjkk0102)
National Natural Science Foundation of China(42322104)
Youth Innovation Promotion Association of the Chinese Academy of Sciences, CAS(2021312)
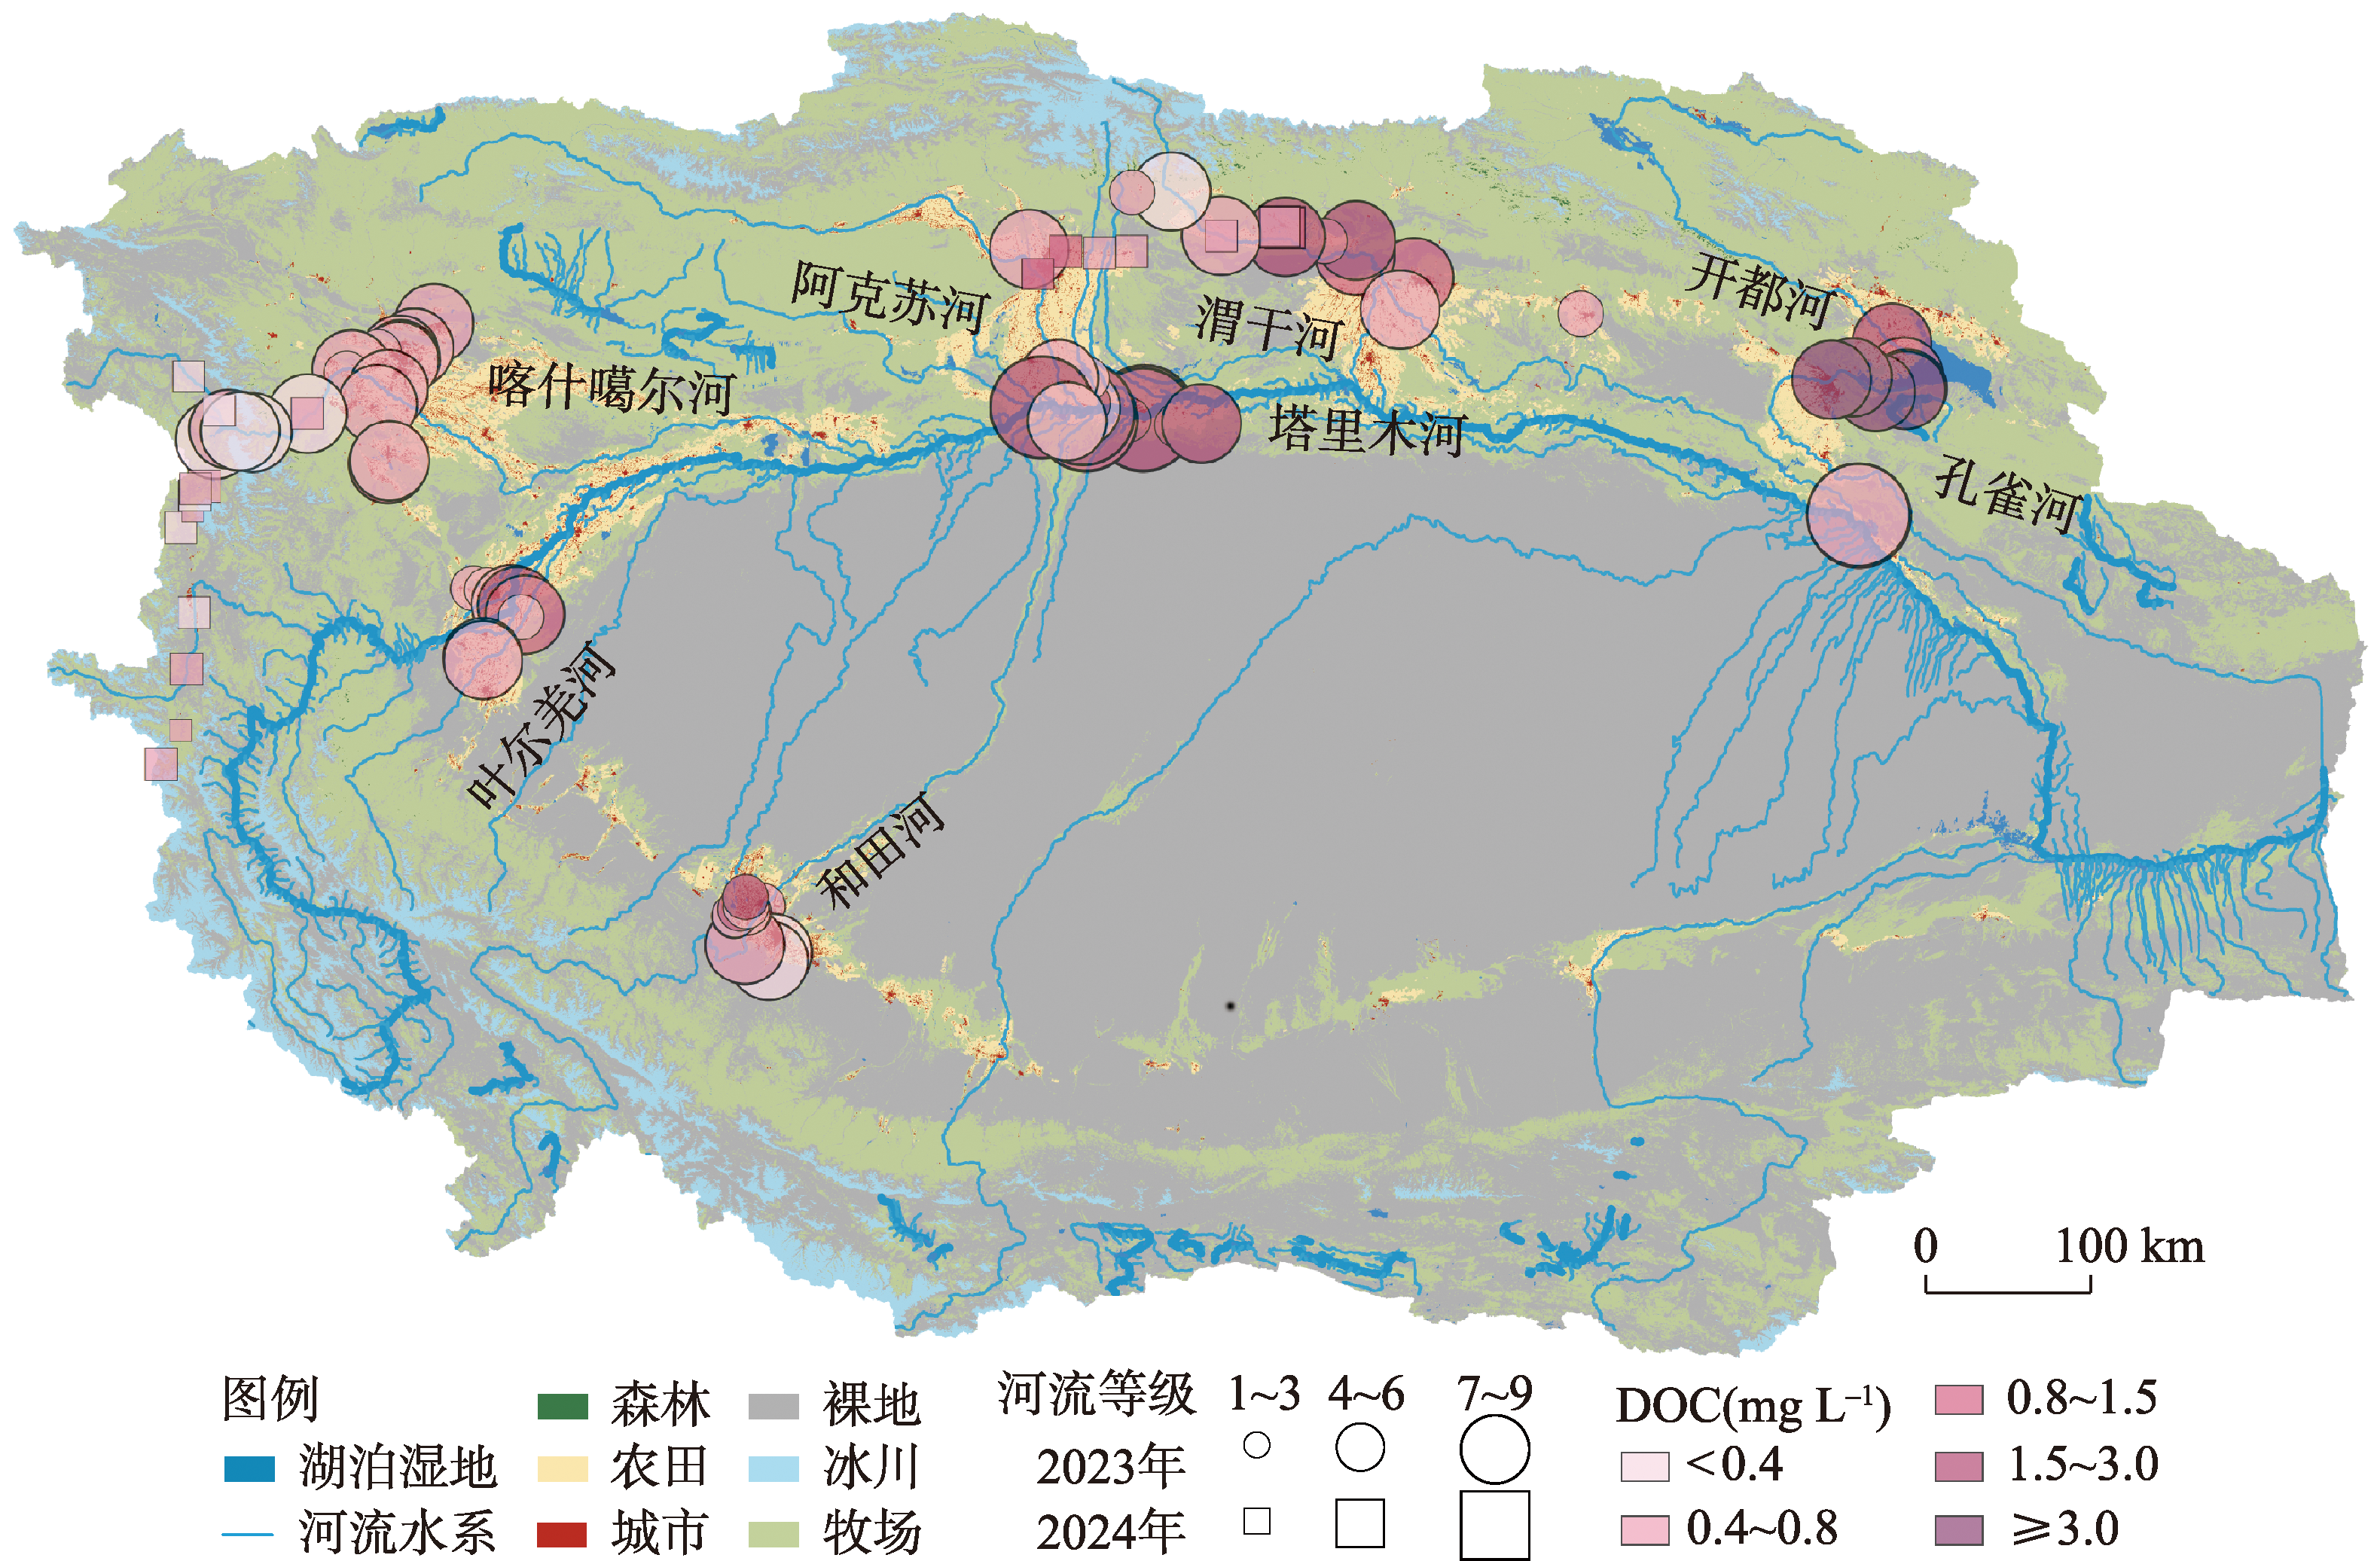
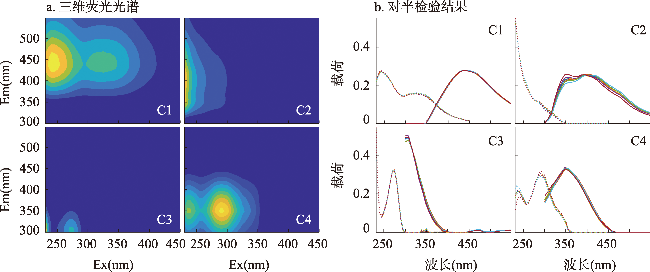
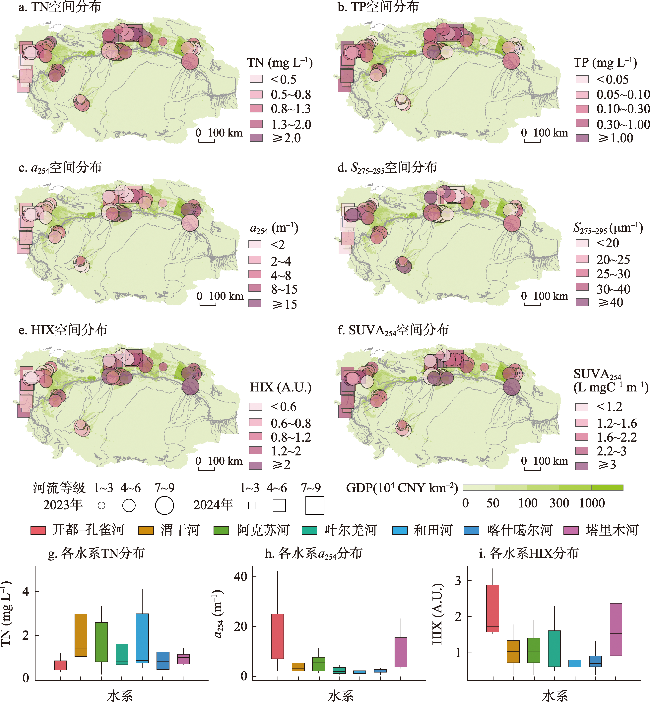
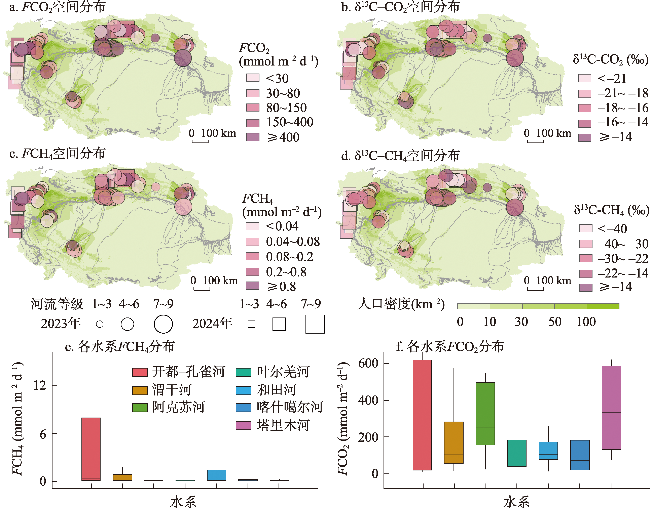
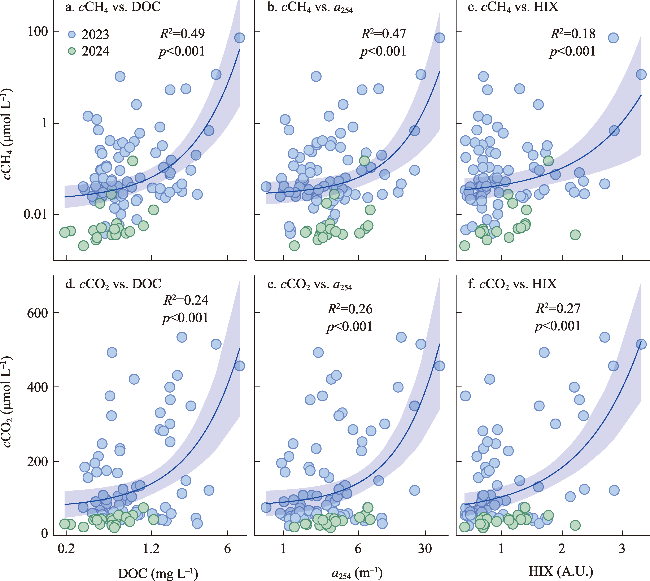
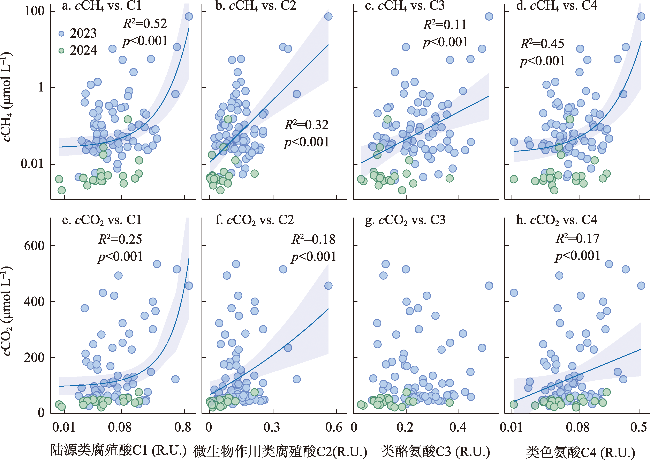
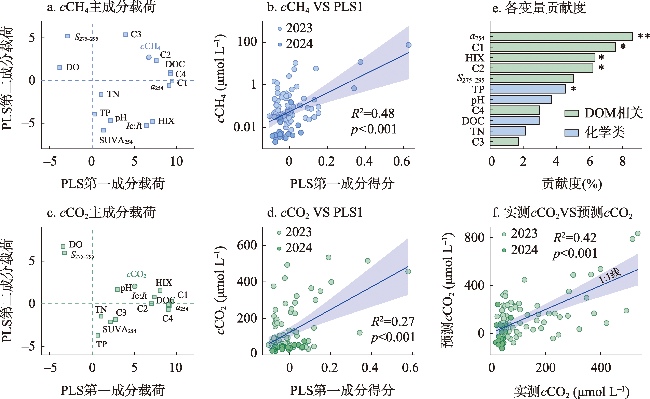
塔里木河流域是典型的干旱区河流系统,其溶解性有机物(DOM)来源组成对碳排放的影响尚未明确。本文旨在探究塔里木河流域水系溶解性有机物(DOM)组成特征及对碳排放(CO2和CH4)的潜在驱动机制。通过2023—2024年对流域内7大水系101个样点开展采样分析,结合顶空—扩散系数法测定河流表层水体CO2、CH4浓度(cCO2、cCH4)和通量(FCO2、FCH4),并利用DOM光谱吸收、三维荧光和平行因子分析等手段解析DOM来源与组成。 结果表明,流域东部开都—孔雀河DOM呈现较高芳香性(a254均值为(16.2 ± 12.6) m-1)和较强腐殖化(HIX均值为2.1 ± 0.7)特征,这与流域城市污废水和农业面源输入密切相关;西部冰川补给河流DOM腐殖化程度较低,但有着相对较高的氮、磷浓度。相关分析、偏最小二乘及随机森林分析结果表明DOM相关参数在一定程度上可以解释cCO2(R2=0.42、p<0.001)和cCH4(p<0.001)变化。与全球范围河流对比发现,塔里木河流域FCO2(均值为(203.5 ± 215.7) mmol m-2 d-1)高于其他干旱区河流(20.8~44.6 mmol m-2 d-1),但低于非干旱区河流(186.0~565.3 mmol m-2 d-1),而FCH4(均值为(1.7±10.2) mmol m-2 d-1)与温带河流(0.8~1.7 mmol m-2 d-1)大致相当,凸显了干旱区河流在夏季高温与人类活动叠加下的特殊碳排放特征。本文明确了塔里木河流域河流碳排放规律及其潜在驱动机制,填补了干旱区河流碳排放研究的空白,为区域水—碳相互作用提供了数据支持,并为流域生态保护与碳收支管理提供科学依据。
关键词: 塔里木河流域; 溶解性有机物(DOM); 二氧化碳(CO2); 甲烷(CH4); 平行因子分析(PARAFAC)
钱明睿 , 周永强 , 蒲阳 . 塔里木河流域溶解性有机物组成特征及对碳排放的潜在驱动机制[J]. 地理学报, 2025 , 80(7) : 1973 -1990 . DOI: 10.11821/dlxb202507016
The Tarim River Basin, a typical arid-zone river system, has yet to have the influence of its dissolved organic matter (DOM) sources and composition on carbon cycling emissions fully elucidated. We aimed to investigate the spatial and temporal heterogeneity of dissolved organic matter (DOM) and carbon (CO2 and CH4) emissions in the river system of the Tarim River Basin. Through the analysis of 101 sampling sites across seven major water systems in the Tarim River Basin during 2023 and 2024, this study employed the headspace equilibrium method to determine the concentrations (cCO2, cCH4) and fluxes (FCO2, FCH4) of CO2 and CH4 in surface water. DOM sources and composition were characterized using spectral absorption, three-dimensional fluorescence, and parallel factor analysis (PARAFAC). The results revealed that DOM in the eastern Kaidu-Kongque River exhibited high aromaticity (mean a254: (16.2±12.6) m-1) and strong humification characteristics (mean HIX: 2.1±0.7), closely associated with urban sewage and agricultural non-point source inputs. In contrast, glacier-fed rivers in the western region showed lower humification levels but relatively high nutrient concentrations. The results of correlation, partial least squares and random forest analyses showed that DOM-related parameters explained cCO2 (R2=0.42, p<0.001) and cCH4 (p<0.001) variations to some extent. Comparison with global-scale rivers revealed that FCO2 in the Tarim River Basin ((203.5±215.7) mmol m-2 d-1) was higher than that in other arid zone rivers (20.8-44.6 mmol m-2 d-1) but lower than that in non-arid zone rivers (186.0-565.3 mmol m-2 d-1), whereas FCH4 ((1.7±10.2) mmol m-2 d-1) was roughly comparable to that of temperate rivers (0.8-1.7 mmol m-2 d-1), highlighting the special carbon emission characteristics of arid zone rivers under the superposition of high summer temperatures and human activities. This study clarified the carbon emission patterns of rivers in the Tarim River Basin and their potential driving mechanisms, which filled the gap in the study of river carbon emissions in the arid zone, and provided data support for the regional water-carbon interactions, as well as scientific support for ecological conservation and carbon management in the basin.
图3 塔里木河流域总氮、总磷、DOM吸收系数、DOM光谱斜率、腐殖化指数和比紫外吸收的空间分布特征和TN、a254、HIX在塔里木河流域7大水系分布的箱线图Fig. 3 Spatial distribution of total nitrogen, total phosphorus, DOM absorbance, DOM spectral slope, humification index, and specific UV absorbance in the Tarim River Basin and boxplots of TN, a254, HIX for the seven major water systems of the Tarim River Basin |
表1 塔里木河流域7大水系理化、营养盐、溶解性有机物(DOM)、碳排放相关参数均值和标准差Tab. 1 Means and standard deviations (SD) of physicochemical nutrient level, dissolved organic matter (DOM), and carbon emission-related parameters of seven major water systems in the Tarim River Basin |
| 参数 | 喀什噶尔河 | 阿克苏河 | 和田河 | 叶尔羌河 | 塔里木河 | 渭干河 | 开都—孔雀河 |
|---|---|---|---|---|---|---|---|
| 水温(℃) | 15.1±5.3 | 18.2±3.1 | 16.0±2.4 | 17.7±2.5 | 18.5±1.0 | 16.6±4.6 | 20.9±2.9 |
| TN(mg L-1) | 1.0±0.7 | 1.5±1.0 | 1.6±1.3 | 1.1±0.5 | 1.1±0.3 | 2.0±1.3 | 0.7±0.3 |
| TP(mg L-1) | 0.4±0.7 | 1.1±1.7 | 0.1±0.0 | 0.2±0.1 | 0.4±0.9 | 0.5±0.6 | 0.04±0.01 |
| DOC(mg L-1) | 0.5±0.2 | 0.8±0.4 | 0.7±0.3 | 0.8±0.5 | 1.4±0.8 | 0.9±0.6 | 3.3±2.1 |
| a254(m-1) | 2.3±1.0 | 5.2±3.2 | 2.2±1.6 | 2.5±1.2 | 8.1±6.4 | 4.0±2.4 | 16.2±12.6 |
| S275-295(μm-1) | 31.6±21.1 | 29.5±11.7 | 39.7±16.5 | 36.5±10.2 | 21.3±6.0 | 24.6±10.1 | 24.0±4.8 |
| HIX | 0.8±0.4 | 1.0±0.4 | 0.7±0.2 | 1.1±0.6 | 1.6±0.7 | 1.0±0.4 | 2.1±0.7 |
| SUVA254(L mgC-1 m-1) | 2.2±0.8 | 2.7±1.1 | 1.4±0.3 | 1.6±0.6 | 2.6±1.1 | 1.9±0.7 | 2.1±0.4 |
| FCO2(mmol m-2 d-1) | 118.5±159.8 | 297.5±181.8 | 196.7±191.5 | 158.1±193.8 | 369.3±250.6 | 187.9±185.0 | 268.7±284.6 |
| FCH4(mmol m-2 d-1) | 0.3±0.7 | 0.09±0.08 | 1.4±2.7 | 0.2±0.3 | 0.1±0.1 | 1.2±3.2 | 14.5±32.5 |
| δ13C-CO2(‰) | -19.0±3.1 | -19.2±4.9 | -16.9±3.9 | -16.4±3.7 | -14.8±4.2 | -19.2±2.9 | -15.9±2.4 |
| δ13C-CH4(‰) | -38.6±15.5 | -31.8±7.4 | -32.8±11.1 | -34.0±7.1 | -20.3±8.8 | -35.1±19.5 | -39.6±12.8 |
图4 塔里木河流域二氧化碳通量(FCO2)、CO2稳定碳同位素(δ13C-CO2)、甲烷通量(FCH4)、CH4稳定碳同位素(δ13C-CH4)空间分布特征和FCH4、FCO2在塔里木河7大水系分布的箱线图Fig. 4 Spatial distribution of CO2 efflux (FCO2) and its stable isotope signatures (δ13C-CO2), and CH4 efflux (FCH4) and its stable isotope signatures (δ13C-CH4) in the Tarim River Basin and boxplots of FCH4, FCO2 for the seven major water systems of the Tarim River Basin |
表2 塔里木河流域和全球范围内其他气候带河流CO2和CH4排放通量比较Tab. 2 Comparison of CO2 and CH4 efflux between from rivers in the Tarim River Basin and other climatic zones |
| 研究区 | 柯本气候分类 | FCO2(mmol m-2 d-1) | FCH4(mmol m-2 d-1) | 参考文献 |
|---|---|---|---|---|
| 塔里木河流域 | BWk | 203.5±215.7 | 1.7±10.2 | 本文 |
| Santa Fe河(美国) | BSk/BSh | 20.8 | 0.1 | [44] |
| 澳大利亚河流 | BSh | 44.6±6.4 | / | [45] |
| Niger(西非干旱区) | Bsh | / | 0.5 | [46] |
| 上海河流水系 | Cfa | 565.3±64.1 | 1.2±1.2 | [47] |
| Kelvin河(英国) | Cfb | 410.5±77.4 | 0.8±0.1 | [48] |
| Cuenca河(厄瓜多尔) | Cfb/Cwb | 273.1±50.8 | 1.7±0.5 | [49] |
| 重庆河流水系 | Cwa | 418.8 | 1.4±1.8 | [50-51] |
| 欧洲干旱河网 | Dfb | 201.3 | 1.3 | [5] |
| Zambezi河(非洲南部) | Aw | 283 | 8.3 | [46] |
| Tana河(肯尼亚) | Aw | 186 | 0.6 | [46] |
| Amazon河下游(南美) | Af | 545.2±489 | 1.1±0.2 | [52-53] |
注:A:热带,B:干旱带,C:温带,D:亚寒带;W:沙漠型,S:草原型,f:湿地型,s:夏天旱季型,w:冬天旱季型,m:季风型;h:炎热干燥,k:寒冷干燥,a:夏季炎热,b:夏季温暖,c:夏季凉快。 |
图5 塔里木河流域甲烷浓度、二氧化碳浓度与溶解性有机碳、DOM吸收系数和腐殖化指数的相关关系Fig. 5 Relationships between CH4 (cCH4) and CO2 (cCO2) concentrations and dissolved organic carbon (DOC), DOM absorbance (a254), and humification index (HIX) in the Tarim River Basin |
感谢张婷、王金玲、刘朝晖、任泽等在野外采样和室内实验中给予的辛勤付出和帮助。
| [1] |
|
| [2] |
|
| [3] |
|
| [4] |
|
| [5] |
|
| [6] |
|
| [7] |
|
| [8] |
|
| [9] |
|
| [10] |
|
| [11] |
|
| [12] |
[荀凡, 杜先, 陈新芳, 等. 秋季连续打捞蓝藻对水—气界面温室气体通量的影响. 湖泊科学, 2020, 32(6): 1707-1722.]
|
| [13] |
|
| [14] |
|
| [15] |
|
| [16] |
|
| [17] |
|
| [18] |
|
| [19] |
[郝兴明, 陈亚宁, 李卫红. 塔里木河流域近50年来生态环境变化的驱动力分析. 地理学报, 2006, 61(3): 262-272.]
|
| [20] |
[陈亚宁, 李卫红, 陈亚鹏, 等. 新疆塔里木河下游断流河道输水与生态恢复. 生态学报, 2007, 27(2): 538-545.]
|
| [21] |
|
| [22] |
|
| [23] |
[张齐飞, 陈亚宁, 孙从建, 等. 塔里木河流域水储量变化及绿洲生态安全评估. 干旱区地理, 2024, 47(1): 1-14.]
|
| [24] |
[杨荣钦, 肖玉磊, 池苗苗, 等. 近20 a塔里木河流域人类活动及景观生态风险时空变化. 干旱区研究, 2024, 41(6): 1010-1020.]
|
| [25] |
[朱俊羽, 彭凯, 李宇阳, 等. 南水北调东线枢纽湖泊表层水体甲烷释放特征及潜在影响因素. 环境科学, 2022, 43(4): 1958-1965.]
|
| [26] |
|
| [27] |
|
| [28] |
|
| [29] |
|
| [30] |
|
| [31] |
|
| [32] |
|
| [33] |
|
| [34] |
|
| [35] |
|
| [36] |
|
| [37] |
|
| [38] |
|
| [39] |
|
| [40] |
|
| [41] |
|
| [42] |
|
| [43] |
|
| [44] |
|
| [45] |
|
| [46] |
|
| [47] |
|
| [48] |
|
| [49] |
|
| [50] |
|
| [51] |
|
| [52] |
|
| [53] |
|
| [54] |
|
| [55] |
|
| [56] |
|
| [57] |
|
| [58] |
|
| [59] |
|
| [60] |
|
| [61] |
|
| [62] |
|
| [63] |
|
| [64] |
|
| [65] |
|
| [66] |
|
| [67] |
[齐天赐, 肖启涛, 苗雨青, 等. 巢湖水体二氧化碳浓度时空分布特征及其水-气交换通量. 湖泊科学, 2019, 31(3): 766-778.]
|
| [68] |
|
| [69] |
|
| [70] |
|
| [71] |
|
| [72] |
|
| [73] |
|
| [74] |
|
| [75] |
|
| [76] |
|
| [77] |
|
/
| 〈 |
|
〉 |
