城市与区域发展

广东省城乡居民用电不平等性的时空特征

  • 薛嘉顺 , 1, 2 ,
  • 杨宇 , 1, 2 ,
  • 方创琳 1, 2 ,
  • 张璐 1 ,
  • 张海平 1 ,
  • 张新 3
展开
  • 1.中国科学院地理科学与资源研究所 中国科学院区域可持续发展分析与模拟重点实验室,北京 100101
  • 2.中国科学院大学资源与环境学院,北京 100049
  • 3.中国科学院空天信息创新研究院,北京 100101
杨宇(1984-), 男, 山东威海人, 研究员, 博士生导师, 主要从事能源地理与区域发展研究。E-mail:

薛嘉顺(1997-), 男, 江苏苏州人, 博士生, 主要从事能源地理与区域发展研究。E-mail:

收稿日期: 2024-03-11

  修回日期: 2025-01-16

  网络出版日期: 2025-04-23

基金资助

国家自然科学基金项目(42121001)

国家自然科学基金项目(42130712)

国家自然科学基金项目(72348003)

Urban-rural residential electricity consumption inequality in Guangdong

  • XUE Jiashun , 1, 2 ,
  • YANG Yu , 1, 2 ,
  • FANG Chuanglin 1, 2 ,
  • ZHANG Lu 1 ,
  • ZHANG Haiping 1 ,
  • ZHANG Xin 3
Expand
  • 1. Key Laboratory of Regional Sustainable Development Analysis and Simulation, Institute of Geographic Sciences and Natural Resources Research, CAS, Beijing 100101, China
  • 2. College of Resouces and Environment, University of Chiense Academy of Sciences, Beijing 100049, China
  • 3. Aerospace Information Research Institute, CAS, Beijing 100101, China

Received date: 2024-03-11

  Revised date: 2025-01-16

  Online published: 2025-04-23

Supported by

National Natural Science Foundation of China(42121001)

National Natural Science Foundation of China(42130712)

National Natural Science Foundation of China(72348003)

摘要

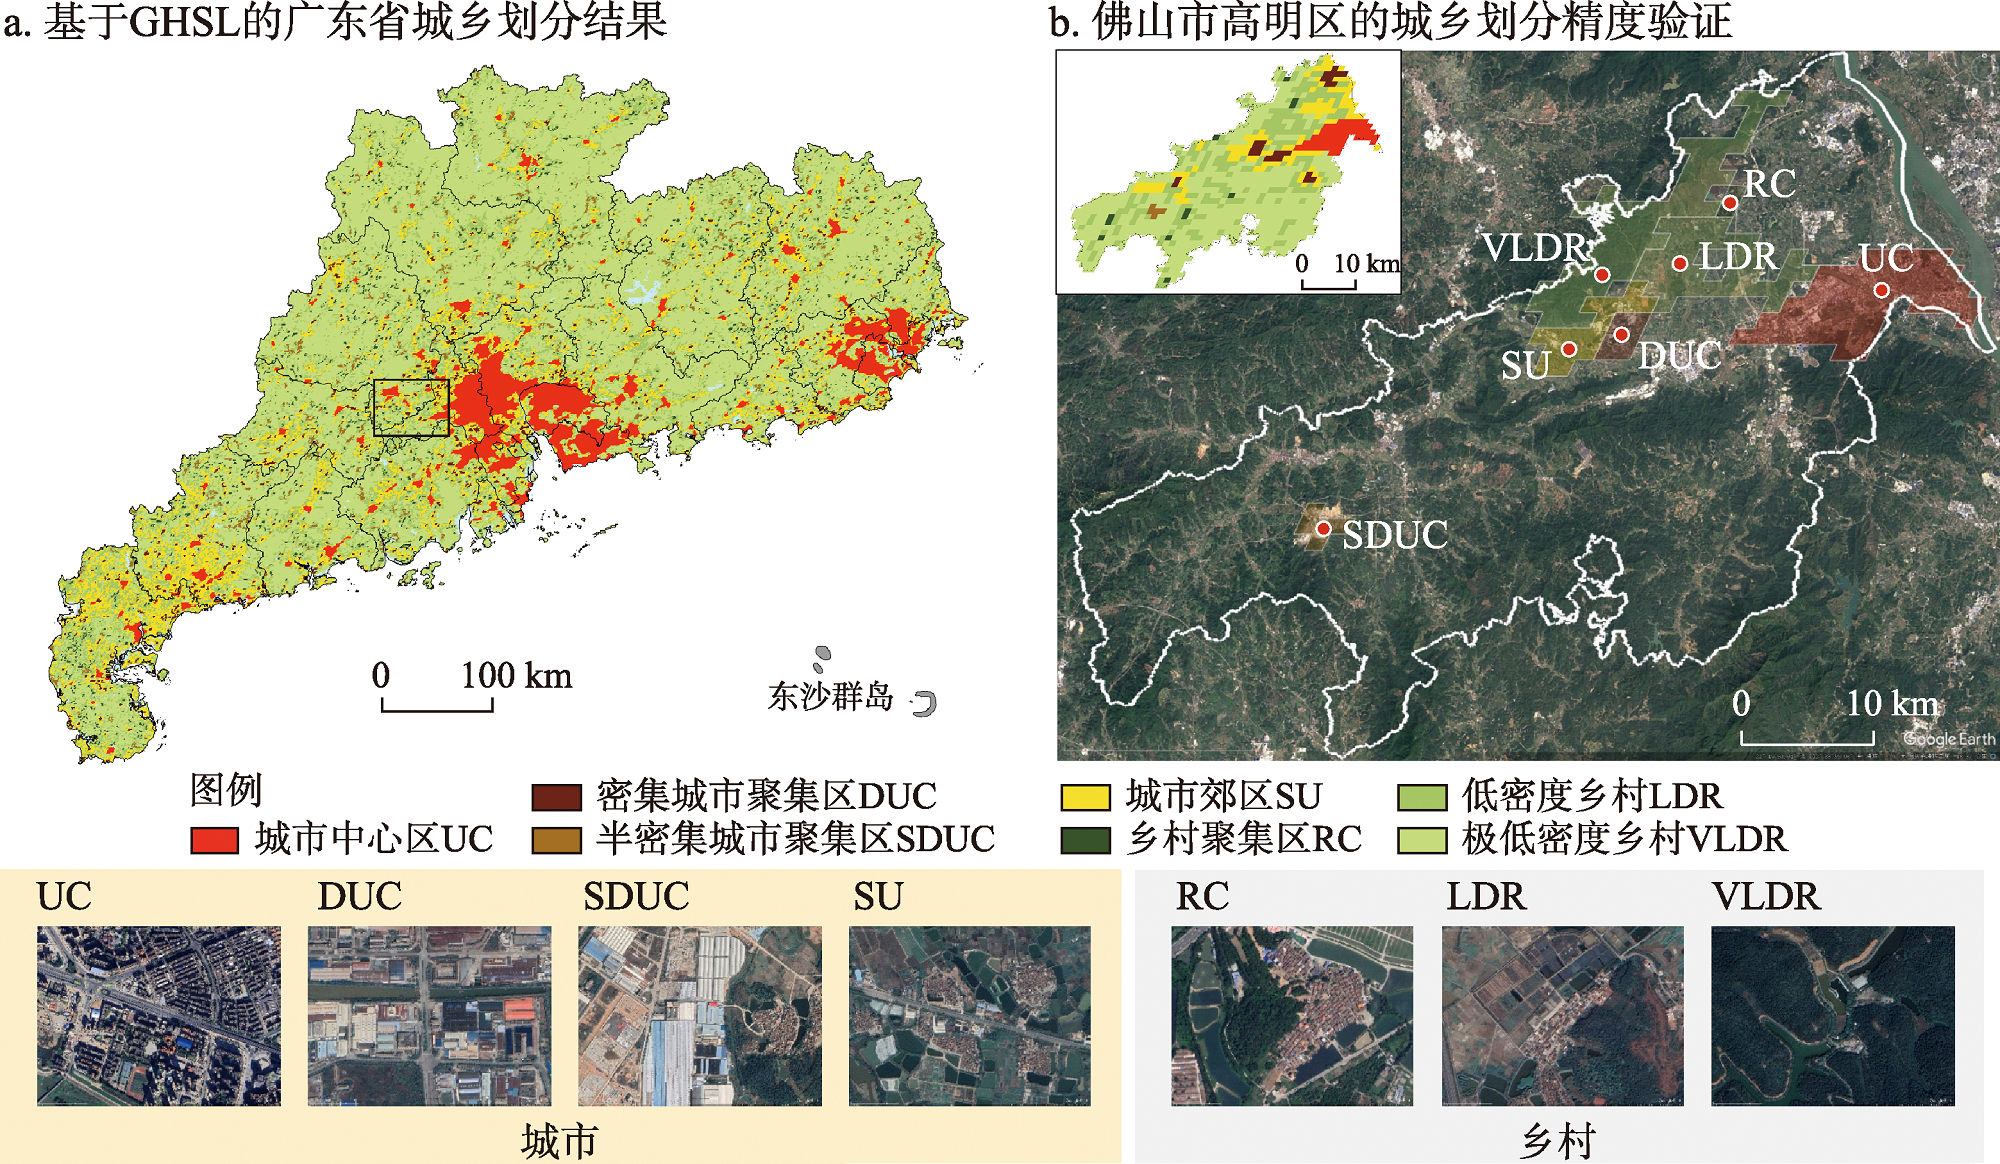
居民生活用电的平等性问题是联合国可持续发展目标SDG 7的重要内容,而广东省是中国城乡融合的领先省份,其城乡居民生活用电的平等性及其变化具有典型性和代表性。然而,目前缺乏基于精细尺度数据实现地理空间的城乡居民生活用电统计和分析。本文基于夜间灯光遥感、全球人类居住层(GHSL)等数据,研发了2000—2020年连续21年的500 m网格城乡居民生活用电数据集,刻画了广东省居民生活用电的城乡不平等性及其时空特征。研究表明: ① 2000—2020年广东省城乡居民生活用电不平等的相关指数大幅下降,不平等性指数和总体泰尔系数降至0.83和0.013,城乡内部不平等愈发重要。② 珠三角城乡居民生活用电水平最平等,其极低密度乡村地区已经超过城市中心区成为人均居民生活用电量最高的区域。③ “城市中心区集中”和“极低密度乡村地区反超”成为城乡居民生活用电的两个显著空间特征。④ 洛伦兹曲线和基尼系数显示,不同地级市的城市中心区居民生活用电最平等,而半密集城市聚集区和乡村聚集区最不平等。本文突破了统计调查数据成本高、精度低的客观局限,丰富了城乡多元空间视角下的能源研究,为从空间上刻画中国及世界其他区域城乡能源电力消费特征提供了普适性框架。研究结果可为进一步认识广东省城乡能源不平等性、推动区域能源协调发展提供科学参考和决策支撑。

本文引用格式

薛嘉顺 , 杨宇 , 方创琳 , 张璐 , 张海平 , 张新 . 广东省城乡居民用电不平等性的时空特征[J]. 地理学报, 2025 , 80(4) : 1052 -1067 . DOI: 10.11821/dlxb202504012

Abstract

Addressing inequality in residential electricity consumption is crucial for achieving the UN Sustainable Development Goal 7 (SDG 7). Guangdong province, one of the most developed areas in China, is a representative case for examining inequality and its changes between urban and rural areas. However, there is currently a lack of high-resolution energy consumption data to conduct urban and rural comparison analysis. To address this gap, this study combined nighttime light remote sensing data and European Union's Global Human Settlement Layer dataset to develop a novel residential electricity consumption dataset (500 meter grid) from 2000 to 2020. The results are as follows: (1) Inequality index indicates a sharp downward trend from 7.57 to 0.83, with the overall Theil index declining to 0.83 and 0.013. (2) Inequality index is the lowest in the Pearl River Delta among all sub-regions, while per capita residential electricity consumption is the highest in urban center and very low density rural clusters among different settlement types. (3) Lorenz curve and Gini coefficient indicate that urban centers show the greatest equality in terms of per capita residential electricity consumption across prefectures, while semi-dense urban clusters and rural clusters show the lowest. This study enriches research on urban and rural energy consumption analysis from a multi-spatial perspective,and overcomes the limitations of traditional statistical survey data featured by high cost and low accuracy. It provides a framework for energy and electricity consumption analysis in urban and rural areas in China and beyond. The findings are useful for a better understanding of urban-rural energy inequality in Guangdong.

[1]
Nerini F F, Tomei J, To L S, et al. Mapping synergies and trade-offs between energy and the sustainable development goals. Nature Energy, 2018, 3(1): 10-15.

[2]
Oswald Y, Owen A, Steinberger J K. Large inequality in international and intranational energy footprints between income groups and across consumption categories. Nature Energy, 2020, 5(3): 231-239.

[3]
Fang Tingting. Global energy governance: An analysis from the political economy perspective. Global Review, 2019, 11(1): 98-119, 160-161.

[方婷婷. 全球能源治理的国际政治经济学分析. 国际展望, 2019, 11(1): 98-119, 160-161.]

[4]
Volodzkiene L, Streimikiene D. Energy inequality indicators: A comprehensive review for exploring ways to reduce inequality. Energies, 2023, 16(16): 6075. DOI: 10.3390/en16166075.

[5]
WEC. World Energy Pulse 2023. London: World Energy Council, 2023.

[6]
Rao N D, Min J, Mastrucci A. Energy requirements for decent living in India, Brazil and South Africa. Nature Energy, 2019, 4(12): 1025-1032.

DOI

[7]
The State Council Information Office of the People's Republic of China. Energy in China's New Era. 2020-12-21. http://www.gov.cn/zhengce/2020-12/21/content_5571916.htm.

[国务院新闻办公室. 《新时代的中国能源发展》. 2020-12-21. http://www.gov.cn/zhengce/2020-12/21/content_5571916.htm.]

[8]
National Development and Reform Commission of the People's Republic of China, National Energy Administration of the People's Republic of China. 14th Five-Year Plan for Modern Energy System. 2022-03-23. https://www.gov.cn/zhengce/zhengceku/2022-03/23/content_5680759.htm.

[国家发展改革委, 国家能源局. 《“十四五”现代能源体系规划》. 2022-03-23. https://www.gov.cn/zhengce/zhengceku/2022-03/23/content_5680759.htm.]

[9]
Zheng Yuhan, Long Hualou. Measurement and spatio-temporal pattern of urban-rural integrated development in China. Acta Geographica Sinica, 2023, 78(8): 1869-1887.

DOI

[郑瑜晗, 龙花楼. 中国城乡融合发展测度评价及其时空格局. 地理学报, 2023, 78(8): 1869-1887.]

DOI

[10]
Han Zenglin, Li Bin, Zhang Kunling. Evaluation and spatial analysis of the equalization of basic public service in urban and rural areas in China. Geographical Research, 2015, 34(11): 2035-2048.

[韩增林, 李彬, 张坤领. 中国城乡基本公共服务均等化及其空间格局分析. 地理研究, 2015, 34(11): 2035-2048.]

DOI

[11]
Wang Penglin, Zhou Sujie, Feng Xinghua. A comparative study of regional imbalance measurement and linkage development mechanism: Taking the urban network attached to Jinan & Qingdao, Guangzhou & Shenzhen as example. World Regional Studies, 2023, 32(5): 102-112.

DOI

[王鹏林, 周素杰, 冯兴华. 区域失衡测度和联动发展机制比较研究: 以依附于济青和广深的城市网络为例. 世界地理研究, 2023, 32(5): 102-112.]

DOI

[12]
General Affairs Office of Guangdong Municipal People's Government. 14th Five-Year Plan for Public Service in Guangdong Province. 2021-11-24. https://www.gd.gov.cn/zwgk/wjk/qbwj/yfb/content/post_3670787.html.

[广东省人民政府办公厅. 广东省公共服务“十四五”规划. 2021-11-24. https://www.gd.gov.cn/zwgk/wjk/qbwj/yfb/content/post_3670787.html.]

[13]
General Affairs Office of Guangdong Municipal People's Government. 14th Five-Year Plan for Energy Development in Guangdong Province. 2022-03. https://www.gd.gov.cn/attachment/0/486/486725/3909371.pdf.

[广东省人民政府办公厅. 广东省能源发展“十四五”规划. 2022-03. https://www.gd.gov.cn/attachment/0/486/486725/3909371.pdf.]

[14]
Yao Jianping. Household electricity consumption in urban and rural China: Comparison among Beijing, Shanghai and Guangdong. Power & Energy, 2015, 36(2): 129-134.

[姚建平. 城乡家庭电力能源消费研究: 基于北京、上海和广东的比较. 电力与能源, 2015, 36(2): 129-134.]

[15]
Dou Y, Zhao J, Dong X C, et al. Quantifying the impacts of energy inequality on carbon emissions in China: A household-level analysis. Energy Economics, 2021, 102: 105502. DOI: 10.1016/j.eneco.2021.105502.

[16]
Yang R L, He J M, Song J F, et al. Energy consumption and cost for rural and urban residents: Case study of three Chinese provinces. Journal of Energy Engineering, 2018, 144(2): 04018011. DOI: 10.1061/(ASCE)EY.1943-7897.0000528.

[17]
Zhang M M, Liu J H, Liu L Y, et al. Inequality in urban household energy consumption for 30 Chinese provinces. Energy Policy, 2023, 172: 113326. DOI: 10.1016/j.enpol.2022.113326.

[18]
Wu S M, Zheng X Y, Wei C. Measurement of inequality using household energy consumption data in rural China. Nature Energy, 2017, 2(10): 795-803.

[19]
Bianco V, Cascetta F, Marino A, et al. Understanding energy consumption and carbon emissions in Europe: A focus on inequality issues. Energy, 2019, 170: 120-130.

[20]
Wu Qiaosheng, Wang Jinwei. Study on inequality of energy consumption. China Population, Resources and Environment, 2013, 23(5): 65-70.

[吴巧生, 汪金伟. 能源消费不平等性研究. 中国人口·资源与环境, 2013, 23(5): 65-70.]

[21]
Xie Pinjie, Pan Xianyou, Lin Meixiu. The movement of power consumption intensity gravity center and the decomposition of difference in China. World Regional Studies, 2017, 26(2): 119-126.

[谢品杰, 潘仙友, 林美秀. 中国电力强度重心迁移及差异研究. 世界地理研究, 2017, 26(2): 119-126.]

[22]
Dong B J, Jiang Q Z, Dou Y, et al. Can financial inclusion reduce energy inequality? Evidence from China. Applied Economics, 2024, 56(50): 6109-6125.

[23]
Li N, Yuan R, Wang J. Analysis of current and future energy inequality by energy categories in China. Sustainable Production and Consumption, 2022, 32: 393-406.

[24]
Yang Y, Jia J S, Devlin A T, et al. Decoupling and decomposition analysis of residential energy consumption from economic growth during 2000-2017: A comparative study of urban and rural Guangdong, China. Energies, 2020, 13(17): 4461. DOI: 10.3390/en13174461.

[25]
Zhen W, Qin Q D, Zhong Z Q, et al. Uncovering household indirect energy-saving responsibility from a sectoral perspective: An empirical analysis of Guangdong, China. Energy Economics, 2018, 72: 451-461.

[26]
Jiang L, Shi X N, Wu S, et al. What factors affect household energy consumption in mega-cities? A case study of Guangzhou, China. Journal of Cleaner Production, 2022, 363: 132388. DOI: 10.1016/j.jclepro.2022.132388.

[27]
Zheng Jiajia. Review and prospects on inequality in residential energy consumption. Modern Marketing, 2020(10): 16-17.

[郑佳佳. 生活能源消费不平等性研究综述及未来研究展望. 现代营销, 2020(10): 16-17.]

[28]
Wang Qiang, Zhou Kan, Lin Jian. Changes in energy equality between urban and rural households in China. Acta Geographica Sinica, 2022, 77(2): 457-473.

DOI

[王强, 周侃, 林键. 中国城乡家庭能源平等变化特征分析. 地理学报, 2022, 77(2): 457-473.]

DOI

[29]
Wang Q, Fan J, Kwan M P, et al. Examining energy inequality under the rapid residential energy transition in China through household surveys. Nature Energy, 2023, 8(3): 251-263.

[30]
Elvidge C D, Baugh K E, Kihn E A, et al. Relation between satellite observed visible-near infrared emissions, population, economic activity and electric power consumption. International Journal of Remote Sensing, 1997, 18(6): 1373-1379.

[31]
Wu Jiansheng, Niu Yan, Peng Jian, et al. Research on energy consumption dynamic among prefecture-level cities in China based on DMSP/OLS nighttime light. Geographical Research, 2014, 33(4): 625-634.

[吴健生, 牛妍, 彭建, 等. 基于DMSP/OLS夜间灯光数据的1995—2009年中国地级市能源消费动态. 地理研究, 2014, 33(4): 625-634.]

DOI

[32]
Pan Jinghu, Li Junfeng. Estimate and spatio-temporal dynamics of electricity consumption in China based on DMSP/OLS images. Geographical Research, 2016, 35(4): 627-638.

[潘竟虎, 李俊峰. 基于夜间灯光影像的中国电力消耗量估算及时空动态. 地理研究, 2016, 35(4): 627-638.]

DOI

[33]
Lyu Qian, Liu Haibin. Multiscale spatio-temporal characteristics of carbon emission of energy consumption in Yellow River Basin based on the nighttime light datasets. Economic Geography, 2020, 40(12): 12-21.

DOI

[吕倩, 刘海滨. 基于夜间灯光数据的黄河流域能源消费碳排放时空演变多尺度分析. 经济地理, 2020, 40(12): 12-21.]

DOI

[34]
Pan Jinghu, Zhang Yongnian. Spatiotemporal patterns of energy carbon footprint and decoupling effect in China. Acta Geographica Sinica, 2021, 76(1): 206-222.

DOI

[潘竟虎, 张永年. 中国能源碳足迹时空格局演化及脱钩效应. 地理学报, 2021, 76(1): 206-222.]

DOI

[35]
Qian J X, Zhang H, Liu Y J. Everyday geographies of market transition: Agro-science, socio-technical relations, and the contingencies of market making in peri-urban Lhasa, Xizang. Transactions of the Institute of British Geographers, 2023, 48(3): 634-649.

[36]
Hu K, Qi K L, Guan Q F, et al. A scientometric visualization analysis for night-time light remote sensing research from 1991 to 2016. Remote Sensing, 2017, 9(8): 802. DOI: 10.3390/rs9080802.

[37]
Ma T, Zhou C H, Pei T, et al. Quantitative estimation of urbanization dynamics using time series of DMSP/OLS nighttime light data: A comparative case study from China's cities. Remote Sensing of Environment, 2012, 124: 99-107.

[38]
Yu Bailang, Wang Congxiao, Gong Wenkang, et al. Nighttime light remote sensing and urban studies: Data,methods,applications, and prospects. National Remote Sensing Bulletin, 2021, 25(1): 342-364.

[余柏蒗, 王丛笑, 宫文康, 等. 夜间灯光遥感与城市问题研究: 数据、方法、应用和展望. 遥感学报, 2021, 25(1): 342-364.]

[39]
Yu S S, Zhang Z X, Liu F. Monitoring population evolution in China using time-series DMSP/OLS nightlight imagery. Remote Sensing, 2018, 10(2): 194. DOI: 10.3390/rs10020194.

[40]
McCallum I, Kyba C C M, Bayas J C L, et al. Estimating global economic well-being with unlit settlements. Nature Communications, 2022, 13(1): 2459. DOI: 10.1038/s41467-022-30099-9.

[41]
Zhao J C, Ji G X, Yue Y L, et al. Spatio-temporal dynamics of urban residential CO2 emissions and their driving forces in China using the integrated two nighttime light datasets. Applied Energy, 2019, 235: 612-624.

[42]
Li Tong, He Chunyang, Yang Yang, et al. Understanding electricity consumption changes in Chinese mainland from 1995 to 2008 by using DMSP/OLS stable nighttime light time series data. Acta Geographica Sinica, 2011, 66(10): 1403-1412.

DOI

[李通, 何春阳, 杨洋, 等. 1995—2008年中国大陆电力消费量时空动态. 地理学报, 2011, 66(10): 1403-1412.]

[43]
Xu J B, Song J, Li B C, et al. Combining night time lights in prediction of poverty incidence at the county level. Applied Geography, 2021, 135: 102552. DOI: 10.1016/j.apgeog.2021.102552.

[44]
Chen Z Q, Yu B L, Yang C S, et al. An extended time series (2000-2018) of global NPP-VIIRS-like nighttime light data from a cross-sensor calibration. Earth System Science Data, 2021, 13(3): 889-906.

[45]
Joyeux R, Ripple R D. Household energy consumption versus income and relative standard of living: A panel approach. Energy Policy, 2007, 35(1): 50-60.

[46]
Zhang C, Zhou K L, Yang S L, et al. On electricity consumption and economic growth in China. Renewable and Sustainable Energy Reviews, 2017, 76: 353-368.

[47]
IEA, IRENA, UNSD, et al. Tracking SDG 7: The Energy Progress Report. Washington DC: World Bank, 2023.

[48]
Melchiorri M, Florczyk A J, Freire S, et al. Unveiling 25 years of planetary urbanization with remote sensing: Perspectives from the global human settlement layer. Remote Sensing, 2018, 10(5): 768. DOI: 10.3390/rs10050768.

[49]
Schiavina M, Melchiorri M, Pesaresi M. GHS-SMOD R2023A - GHS settlement layers, application of the Degree of Urbanisation methodology (stage I) to GHS-POP R2023A and GHS-BUILT-S R2023A, multitemporal (1975-2030). European Commission, Joint Research Centre (JRC), 2023.

[50]
Yang Y, Xue J S, Qian J X, et al. Mapping energy inequality between urban and rural China. Applied Geography, 2024, 165: 103220. DOI: 10.1016/j.apgeog.2024.103220.

[51]
Xie Y, Weng Q. World energy consumption pattern as revealed by DMSP-OLS nighttime light imagery. GIScience & Remote Sensing, 2016, 53(2): 265-282.

[52]
Deng C B, Lin W Y, Chen S L. Use of smart meter readings and nighttime light images to track pixel-level electricity consumption. Remote Sensing Letters, 2019, 10(3): 205-213.

[53]
Pan J H, Li J F. Spatiotemporal dynamics of electricity consumption in China. Applied Spatial Analysis and Policy, 2019, 12(2): 395-422.

DOI

[54]
Sahoo S, Gupta P K, Srivastav S K. Comparative analysis between VIIRS-DNB and DMSP-OLS night-time light data to estimate electric power consumption in Uttar Pradesh, India. International Journal of Remote Sensing, 2020, 41(7): 2565-2580.

[55]
Shi K F, Chen Y, Yu B L, et al. Detecting spatiotemporal dynamics of global electric power consumption using DMSP-OLS nighttime stable light data. Applied Energy, 2016, 184: 450-463.

[56]
Dugoua E, Kennedy R, Urpelainen J. Satellite data for the social sciences: Measuring rural electrification with night-time lights. International Journal of Remote Sensing, 2018, 39(9): 2690-2701.

[57]
Proville J, Zavala-Araiza D, Wagner G. Night-time lights: A global, long term look at links to socio-economic trends. Plos One, 2017, 12(3): e0174610. DOI: 10.1371/journal.pone.0174610.

[58]
Román M O, Stokes E C. Holidays in lights: Tracking cultural patterns in demand for energy services. Earth's Future, 2015, 3(6): 182-205.

[59]
Fehrer D, Krarti M. Spatial distribution of building energy use in the United States through satellite imagery of the earth at night. Building and Environment, 2018, 142: 252-264.

[60]
Shi K F, Chen Y, Yu B L, et al. Modeling spatiotemporal CO2 (carbon dioxide) emission dynamics in China from DMSP-OLS nighttime stable light data using panel data analysis. Applied Energy, 2016, 168: 523-533.

[61]
Fang Lingxiao, Li Gengyin. Differences in basic public services in urban and rural areas of Guangdong and cause analysis. Value Engineering, 2012, 31(3): 323-324.

[方玲晓, 李庚寅. 广东城乡基本公共服务差异现状及原因分析. 价值工程, 2012, 31(3): 323-324.]

[62]
Xie Hong. Research on promoting the urbanization process in Guangdong. Agricultural Economy, 2007(3):53-54.

[谢虹. 推动广东城镇化进程的研究. 农业经济, 2007(3): 53-54.]

[63]
Chen Xiaoxuan, Shen Dian. A two-pronged approach to realise the integration of urban and rural electricity consumption in Guangdong. China Electric Power News, 2013-11-06: 003.

[陈晓煊, 沈甸. “双管齐下”实现广东城乡用电一体化. 中国电力报, 2013-11-06: 003.]

[64]
Ke Wenqian, Xiao Baoyu, Lin Liyue, et al. Interprovincial urban and rural floating population evolution of China and its relationship with regional economic development. Acta Geographica Sinica, 2023, 78(8): 2041-2057.

DOI

[柯文前, 肖宝玉, 林李月, 等. 中国省际城乡流动人口空间格局演变及与区域经济发展的关系. 地理学报, 2023, 78(8): 2041-2057.]

DOI

[65]
Zhang Yaojun, Chen Yun, Wu Xiwei, et al. Spatial patterns and determinants of population flow networks in China: Based on four types of population flows. Population Research, 2024, 48(2): 118-132.

[张耀军, 陈芸, 巫锡炜, 等. 城乡二元结构下中国人口流动格局及其解释: 基于流向别的考察. 人口研究, 2024, 48(2): 118-132.]

[66]
Shen Ke, Shi Qian. The impacts of population structure and household size on residential energy consumption: Evidences based on provincial-level panel data. Population Research, 2018, 42(6): 100-110.

[沈可, 史倩. 人口结构与家庭规模对生活能源消费的影响: 基于中国省级面板数据的实证研究. 人口研究, 2018, 42(6): 100-110.]

[67]
O'Neill B C, Chen B S. Demographic determinants of household energy use in the United States. Population and Development Review, 2002, 28: 53-88.

文章导航

/