
气候变化和水库运行对长江流域水文情势的影响预估
|
刘罕奇(1990-), 男, 山东淄博人, 博士生, 主要从事水文水资源方面研究。E-mail: liuhq.18b@igsnrr.ac.cn |
收稿日期: 2024-07-16
修回日期: 2024-11-08
网络出版日期: 2025-01-21
基金资助
中国科学院地理科学与资源研究所可桢—秉维青年人才计划项目(2021RC002)
Projection of the impact of climate change and reservoir on the flow regime in the Yangtze River basin
Received date: 2024-07-16
Revised date: 2024-11-08
Online published: 2025-01-21
Supported by
The Program for the "Kezhen-Bingwei" Youth Talents from the Institute of Geographic Sciences and Natural Resources Research(2021RC002)
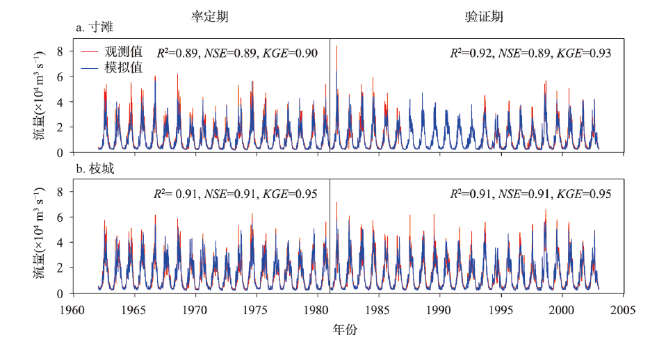
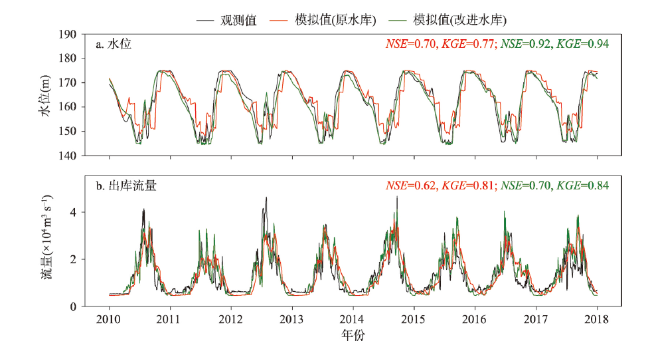
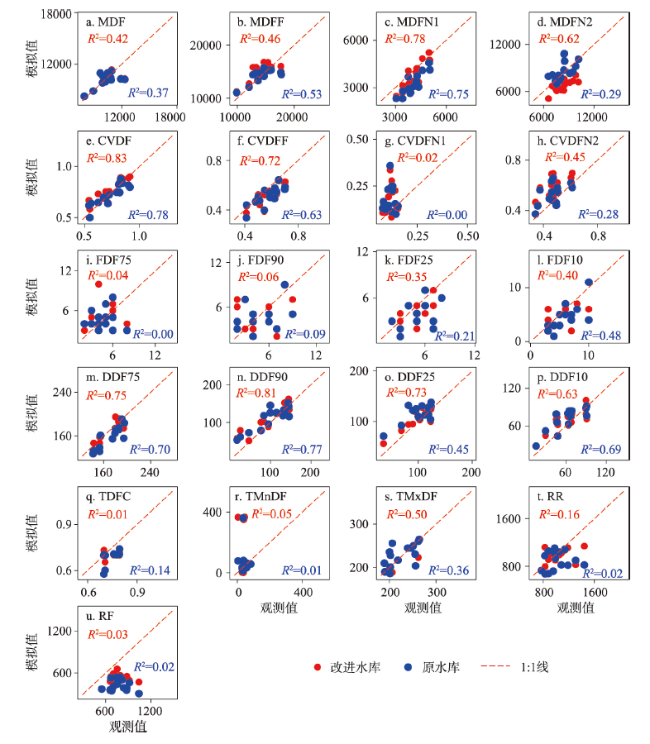
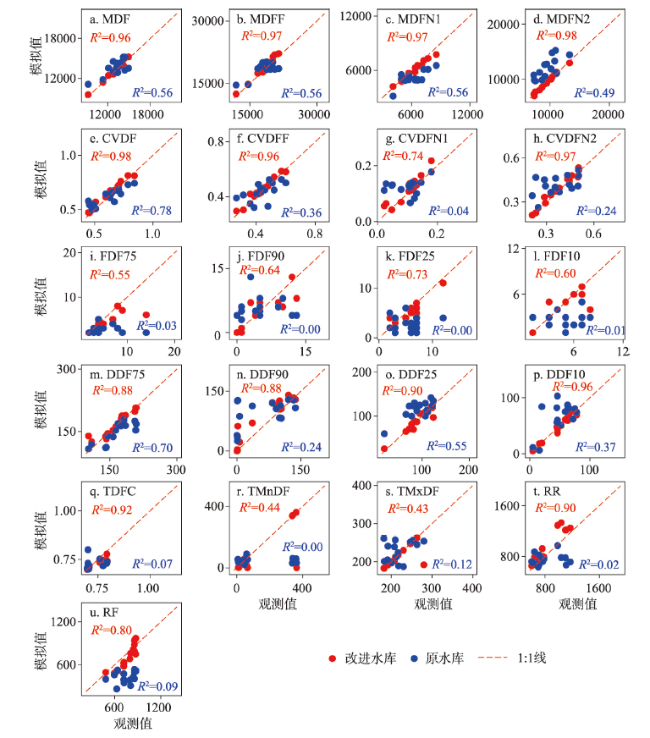
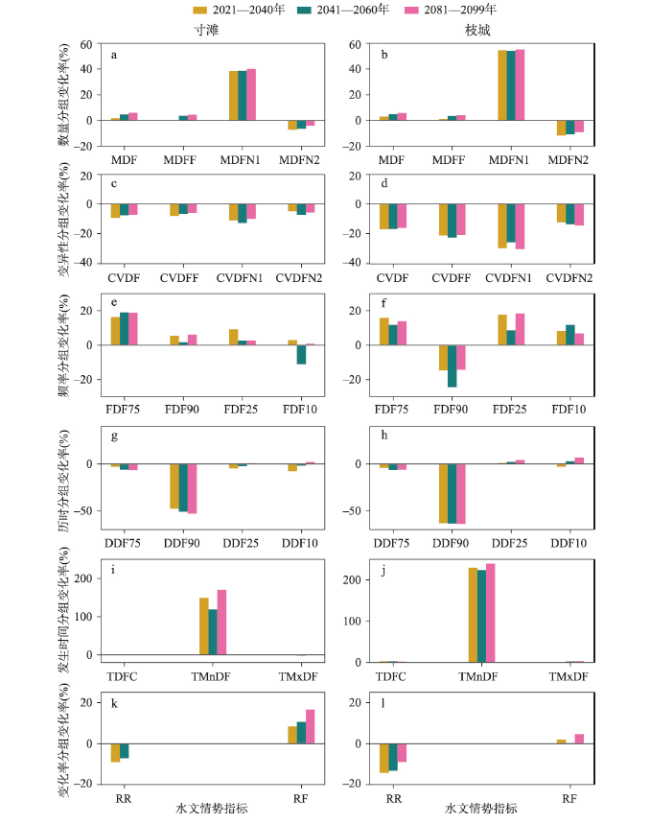
预估气候变化和水库运行对流域水文情势的影响,对于变化环境下流域水资源安全、生物多样性保护和水生态修复治理具有重要意义。本文基于经偏差校正的气候模式数据,应用改进水库模块的SWAT模型和水文指标法,预估了21世纪气候变化和水库运行对长江流域水文情势的影响。研究表明:① 相较于原模型,改进水库模块的SWAT模型对典型水文站日径流和水文情势指标的整体模拟效果有较好提升,其中日径流模拟值与观测值的NSE(Nash-Sutcliffe Efficiency Coefficient)和KGE(Kling-Gupta Efficiency Coefficient)分别提升0.01~0.26和0.01~0.08;② 未来气候变化使长江流域径流呈上升趋势,其中1—4月份流量增加较为明显(最大增幅为17%),同时增加了汛前流量变异性(最大增幅为18%)、极端洪峰流量发生次数、极端洪峰流量历时和流量正变化率;③ 水库运行增加了枯季径流(最大增幅为67%),减少了极端洪峰流量的发生次数(最大变化幅度为-16%),并缩短了极端洪峰流量(-10%~-4%)和极端枯季流量(-51%~-38%)的历时,提升了径流的稳定性。长江上游控制性水库群运行部分抵消了未来气候变化对径流的影响,但受调蓄规则和库容总量的局限其对径流的调控能力仍很有限,未来需要充分考虑气候变化的影响规划水库建设或动态优化水库调蓄规则。
刘罕奇 , 王婷婷 , 冯瑶 , 王红 , 孙福宝 , 刘文彬 . 气候变化和水库运行对长江流域水文情势的影响预估[J]. 地理学报, 2025 , 80(1) : 41 -60 . DOI: 10.11821/dlxb202501004
Projecting changes in flow regime under climate change and reservoir operations is crucial for safeguarding water security, preserving biodiversity and restoring aquatic ecosystems of a basin. Leveraging bias-corrected climate model data, this study utilized the Soil and Water Assessment Tool (SWAT) with an improved reservoir module and Indicators of Hydrologic Alteration to project the impacts of climate change and reservoir operations on the flow regime of the Yangtze River basin in the 21st century. The results showed that: (1) The improved SWAT model outperformed the original version, enhancing the simulation accuracy of daily streamflow and hydrological indicators at representative stations. The NSE (Nash-Sutcliffe efficiency coefficient) and KGE (Kling-Gupta efficiency coefficient) of simulation and observation of daily streamflow increased by 0.01-0.26 and 0.01-0.08, respectively. (2) Climate change is projected to increase streamflow, in which the streamflow increases significantly from January to April (the maximum increase is 17%). Meanwhile, climate change increases the variability of pre-flood streamflow (the maximum increase is 18%), the frequency of extremely high pulse, the duration of extremely high pulse and the rise rate of flow. (3) Reservoir operations effectively replenish dry-season flows (the maximum increase is 67%), reduce the frequency of extremely high pulse (the maximum decrease is 16%), and shorten the duration of both extremely high pulse (by -10% to -4%) and extremely low pulse (by -51% to -38%). Reservoir operations improve the stability of flow. While upstream reservoir operations can partially counteract climate-induced streamflow changes, their regulatory capacity is constrained by operational rules and total storage capacity. Therefore, adjusting reservoir operation strategies in response to the impacts of climate change on streamflow becomes imperative.
Key words: climate change; reservoir operation; flow regime; SWAT model; Yangtze River basin
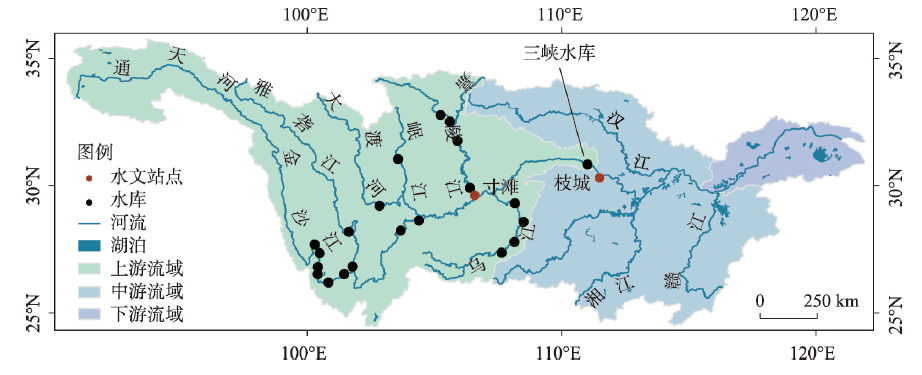
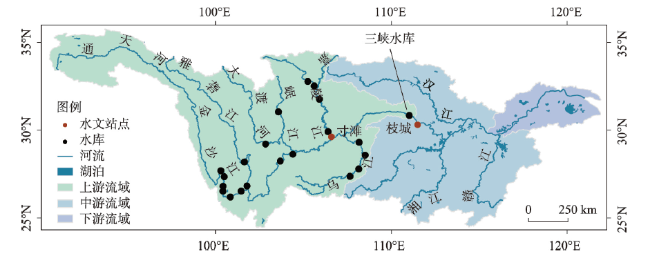
图1 长江流域水系、水文站和水库分布Fig. 1 Distribution of river, hydrological stations and reservoirs in the Yangtze River basin |
表1 长江上游21座控制性水库信息Tab. 1 Information of 21 reservoirs in the upper Yangtze River basin |
| 序号 | 流域 | 水库 | 运行年份 | 防洪库容(108 m3) | 总库容(108m3) |
|---|---|---|---|---|---|
| 1 | 金沙江 | 梨园 | 2013 | 1.73 | 8.05 |
| 2 | 阿海 | 2012 | 2.15 | 8.85 | |
| 3 | 金安桥 | 2010 | 1.58 | 9.13 | |
| 4 | 龙开口 | 2012 | 1.26 | 5.58 | |
| 5 | 鲁地拉 | 2013 | 5.64 | 17.18 | |
| 6 | 观音岩 | 2014 | 5.42 | 22.50 | |
| 7 | 雅砻江 | 二滩 | 1998 | 9.00 | 58.00 |
| 8 | 锦屏一级 | 2009 | 16.00 | 79.90 | |
| 9 | 岷江 | 瀑布沟 | 2009 | 11.00/7.27 | 53.32 |
| 10 | 紫坪铺 | 2003 | 1.67 | 11.12 | |
| 11 | 嘉陵江 | 碧口 | 1976 | 0.50/0.70 | 2.17 |
| 12 | 宝珠寺 | 1996 | 2.80 | 25.50 | |
| 13 | 亭子口 | 2013 | 14.40 | 40.67 | |
| 14 | 草街 | 2010 | 1.99 | 22.18 | |
| 15 | 乌江 | 构皮滩 | 2010 | 4.00/2.00 | 64.54 |
| 16 | 思林 | 2004 | 1.84 | 15.93 | |
| 17 | 沙陀 | 2007 | 2.09 | 9.21 | |
| 18 | 彭水 | 2008 | 2.32 | 14.65 | |
| 19 | 干流 | 溪洛渡 | 2013 | 46.50 | 126.70 |
| 20 | 向家坝 | 2012 | 9.03 | 51.63 | |
| 21 | 三峡 | 2003 | 221.50 | 450.70 |
注:“/”前后两值分别对应水库在汛期不同时段的防洪库容。 |
表2 用于评估水文情势变化的水文指标Tab. 2 Hydrological indicators used to evaluate changes in flow regime |
| 序号 | 分组 | 水文指标 | 简称 | 单位 |
|---|---|---|---|---|
| 1 | 数量 | 年平均日流量 | MDF | m3 s-1 |
| 2 | 汛期平均日流量(4—9月) | MDFF | m3 s-1 | |
| 3 | 汛前平均日流量(1—3月) | MDFN1 | m3 s-1 | |
| 4 | 汛后平均日流量(10—12月) | MDFN2 | m3 s-1 | |
| 5 | 变异性 | 平均日流量变异系数 | CVDF | - |
| 6 | 汛期日流量变异系数 | CVDFF | - | |
| 7 | 汛前日流量变异系数 | CVDFN1 | - | |
| 8 | 汛后日流量变异系数 | CVDFN2 | - | |
| 9 | 频率 | 枯季流量发生次数(MDF第75分位数) | FDF75 | - |
| 10 | 极端枯季流量发生次数(MDF第90分位数) | FDF90 | - | |
| 11 | 洪峰流量发生次数(MDF第25分位数) | FDF25 | - | |
| 12 | 极端洪峰流量发生次数(MDF第10分位数) | FDF10 | - | |
| 13 | 历时 | 枯季流量历时 | DDF75 | d |
| 14 | 极端枯季流量历时 | DDF90 | d | |
| 15 | 洪峰流量历时 | DDF25 | d | |
| 16 | 极端洪峰流量历时 | DDF10 | d | |
| 17 | 发生时间 | 平均日流量的科威尔稳定性 | TDFC | - |
| 18 | 年最小日流量发生时间 | TMnDF | - | |
| 19 | 年最大日流量发生时间 | TMxDF | - | |
| 20 | 变化率 | 第二天流量相对于第一天发生的正变化率 | RR | - |
| 21 | 第二天流量相对于第一天发生的负变化率 | RF | - |
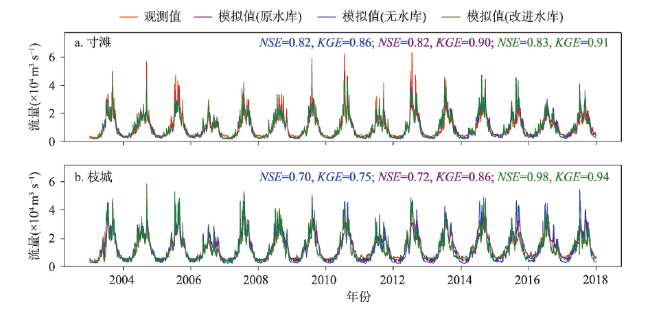
图3 2003—2017年水库影响期寸滩和枝城站日径流观测值与模拟值的对比Fig. 3 Comparison of observed and simulated daily streamflow at Cuntan and Zhicheng stations during the reservoir impact period from 2003 to 2017 |
图5 2003—2017年寸滩站水文情势指标的模拟值与观测值对比Fig. 5 Comparison of simulated and observed hydrological indicators at Cuntan station from 2003 to 2017 |
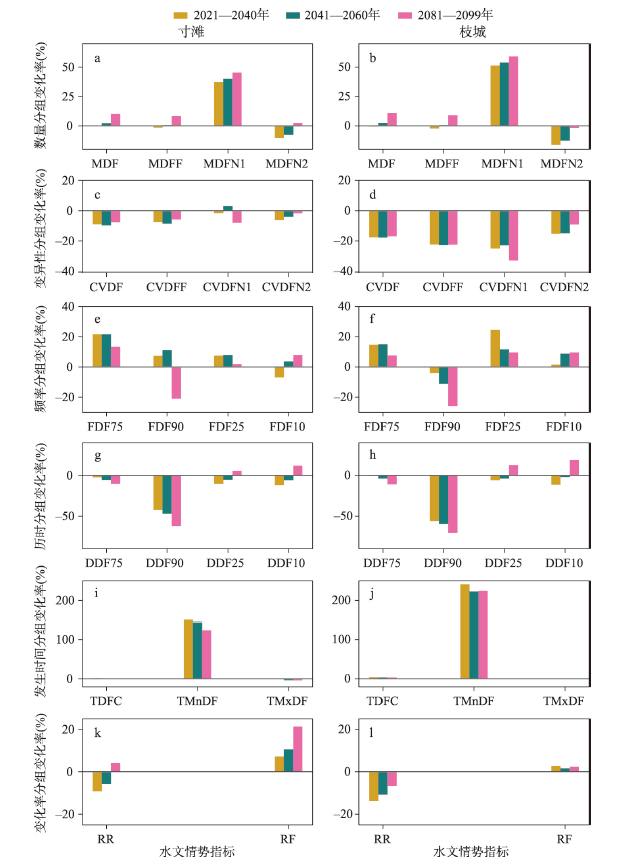
图7 RCP 2.6情景下寸滩和枝城站水文情势指标相较于基准期的平均变化率Fig. 7 Average changes of hydrological indicators at Cuntan and Zhicheng stations compared with the baseline period under the RCP 2.6 scenario |
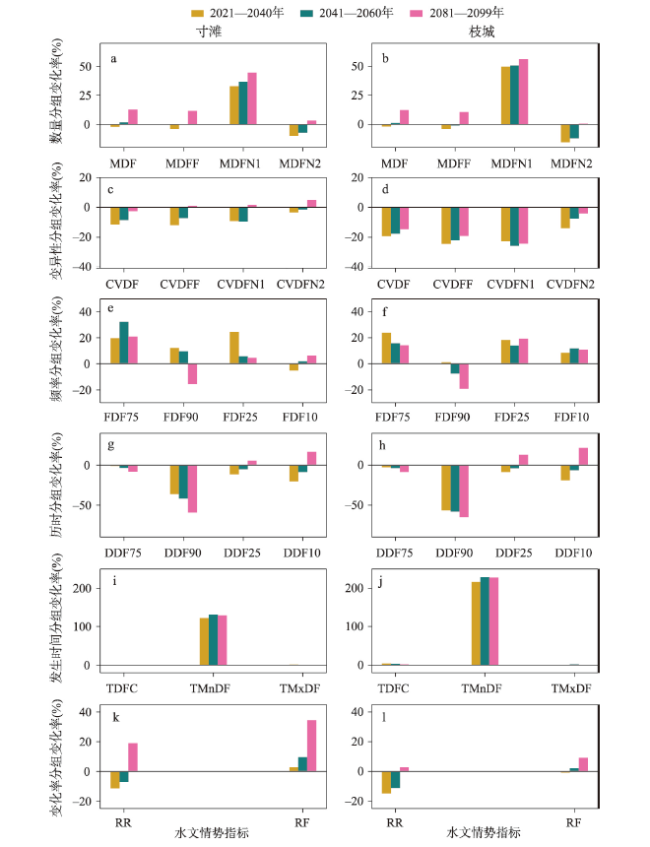
图8 RCP 4.5情景下寸滩和枝城站水文情势指标相较于基准期的平均变化率Fig. 8 Average changes of hydrological indicators at Cuntan and Zhicheng stations compared with the baseline period under the RCP 4.5 scenario |
表3 未来时期寸滩站水文情势指标的平均变化率(%)Tab. 3 Average change (%) of hydrological indicators at Cuntan station in the future |
| ID | 分组 | 指标 | 2021—2040年 | 2041—2060年 | 2081—2099年 | |||||||||||||||||||||||
|---|---|---|---|---|---|---|---|---|---|---|---|---|---|---|---|---|---|---|---|---|---|---|---|---|---|---|---|---|
| RCP 2.6 | RCP 4.5 | RCP 8.5 | RCP 2.6 | RCP 4.5 | RCP 8.5 | RCP 2.6 | RCP 4.5 | RCP 8.5 | ||||||||||||||||||||
| 气候 | 水库 | 气候 | 水库 | 气候 | 水库 | 气候 | 水库 | 气候 | 水库 | 气候 | 水库 | 气候 | 水库 | 气候 | 水库 | 气候 | 水库 | |||||||||||
| 1 | 数量 | MDF | 2 | 0 | 0 | 0 | -2 | 0 | 5 | 0 | 2 | 0 | 2 | 0 | 6 | 0 | 10 | 0 | 13 | 0 | ||||||||
| 2 | MDFF | 2 | -2 | 0 | -1 | -3 | -2 | 5 | -2 | 2 | -1 | 1 | -1 | 6 | -2 | 10 | -2 | 13 | -1 | |||||||||
| 3 | MDFN1 | 4 | 35 | 2 | 35 | -3 | 35 | 3 | 35 | 5 | 35 | 2 | 34 | 4 | 36 | 12 | 34 | 11 | 33 | |||||||||
| 4 | MDFN2 | 2 | -9 | 0 | -10 | 0 | -10 | 3 | -9 | 2 | -9 | 2 | -10 | 5 | -9 | 11 | -9 | 12 | -9 | |||||||||
| 5 | 变异性 | CVDF | 1 | -11 | 2 | -11 | 0 | -11 | 3 | -11 | 1 | -11 | 2 | -11 | 3 | -10 | 3 | -10 | 8 | -10 | ||||||||
| 6 | CVDFF | 3 | -11 | 4 | -11 | 0 | -11 | 5 | -12 | 3 | -11 | 4 | -12 | 4 | -10 | 6 | -11 | 13 | -12 | |||||||||
| 7 | CVDFN1 | 3 | -14 | 14 | -15 | 4 | -14 | 1 | -14 | 18 | -15 | 5 | -14 | 7 | -18 | 9 | -17 | 14 | -13 | |||||||||
| 8 | CVDFN2 | -1 | -3 | -1 | -5 | 1 | -5 | -4 | -3 | -1 | -3 | 1 | -3 | -2 | -4 | 1 | -3 | 5 | 0 | |||||||||
| 9 | 频率 | FDF75 | 4 | 12 | 6 | 16 | 8 | 12 | 12 | 7 | 20 | 1 | 16 | 16 | 0 | 18 | 9 | 4 | 13 | 8 | ||||||||
| 10 | FDF90 | 7 | -2 | -6 | 13 | 0 | 12 | 0 | 1 | -4 | 15 | -8 | 17 | -5 | 11 | -6 | -15 | 6 | -22 | |||||||||
| 11 | FDF25 | -1 | 10 | 1 | 6 | 8 | 16 | -9 | 11 | -1 | 9 | 1 | 5 | -2 | 5 | -4 | 5 | 2 | 3 | |||||||||
| 12 | FDF10 | -2 | 5 | -9 | 2 | -6 | 1 | -10 | -1 | -1 | 5 | -3 | 4 | -1 | 2 | 1 | 7 | 4 | 2 | |||||||||
| 13 | 历时 | DDF75 | -1 | -2 | 0 | -2 | 0 | -1 | -2 | -4 | -2 | -4 | 0 | -4 | -4 | -3 | -4 | -6 | -4 | -4 | ||||||||
| 14 | DDF90 | -4 | -44 | -2 | -41 | 2 | -38 | -8 | -43 | -7 | -40 | -3 | -39 | -5 | -48 | -17 | -46 | -14 | -45 | |||||||||
| 15 | DDF25 | 2 | -6 | -4 | -6 | -5 | -7 | 3 | -5 | -1 | -4 | 0 | -6 | 6 | -5 | 10 | -5 | 9 | -4 | |||||||||
| 16 | DDF10 | 2 | -10 | -2 | -10 | -10 | -11 | 7 | -9 | 4 | -9 | 4 | -12 | 12 | -10 | 23 | -11 | 23 | -6 | |||||||||
| 17 | 发生时间 | TDFC | -1 | 2 | -1 | 2 | 0 | 1 | 0 | 0 | -1 | 2 | -1 | 1 | 0 | 1 | -1 | 2 | -1 | 2 | ||||||||
| 18 | TMnDF | 3 | 146 | 13 | 138 | 8 | 115 | -4 | 123 | 3 | 141 | 3 | 128 | -10 | 180 | 18 | 106 | 19 | 110 | |||||||||
| 19 | TMxDF | 1 | 0 | 0 | -1 | 2 | -1 | -2 | 0 | -1 | -2 | 1 | -1 | -1 | 0 | -3 | -1 | 2 | -1 | |||||||||
| 20 | 变化率 | RR | 8 | -17 | 9 | -18 | 5 | -17 | 13 | -20 | 12 | -18 | 11 | -18 | 19 | -19 | 22 | -18 | 43 | -24 | ||||||||
| 21 | RF | 5 | 4 | 3 | 4 | -1 | 4 | 7 | 3 | 7 | 3 | 5 | 4 | 12 | 4 | 19 | 2 | 32 | 2 | |||||||||
表4 未来时期枝城站水文情势指标的平均变化率(%)Tab. 4 Average change (%) of hydrological indicators at Zhicheng station in the future |
| ID | 分组 | 指标 | 2021—2040年 | 2041—2060年 | 2081—2099年 | |||||||||||||||||||||||
|---|---|---|---|---|---|---|---|---|---|---|---|---|---|---|---|---|---|---|---|---|---|---|---|---|---|---|---|---|
| RCP 2.6 | RCP 4.5 | RCP 8.5 | RCP 2.6 | RCP 4.5 | RCP 8.5 | RCP 2.6 | RCP 4.5 | RCP 8.5 | ||||||||||||||||||||
| 气候 | 水库 | 气候 | 水库 | 气候 | 水库 | 气候 | 水库 | 气候 | 水库 | 气候 | 水库 | 气候 | 水库 | 气候 | 水库 | 气候 | 水库 | |||||||||||
| 1 | 数量 | MDF | 3 | -1 | -1 | 1 | -2 | 0 | 5 | 0 | 2 | 0 | 1 | 1 | 6 | 0 | 11 | -1 | 12 | 1 | ||||||||
| 2 | MDFF | 3 | -3 | 0 | -1 | -2 | -2 | 5 | -2 | 2 | -2 | 1 | -1 | 6 | -2 | 11 | -3 | 13 | -1 | |||||||||
| 3 | MDFN1 | 3 | 35 | 0 | 37 | -3 | 36 | 3 | 36 | 5 | 35 | 0 | 36 | 3 | 37 | 11 | 35 | 9 | 36 | |||||||||
| 4 | MDFN2 | 1 | -9 | -2 | -8 | -1 | -9 | 2 | -8 | 1 | -8 | 1 | -8 | 4 | -8 | 10 | -8 | 10 | -7 | |||||||||
| 5 | 变异性 | CVDF | 2 | -12 | 2 | -11 | -1 | -11 | 3 | -11 | 1 | -11 | 2 | -10 | 3 | -10 | 3 | -11 | 7 | -10 | ||||||||
| 6 | CVDFF | 4 | -12 | 2 | -10 | -2 | -9 | 4 | -10 | 2 | -10 | 3 | -10 | 3 | -9 | 4 | -10 | 10 | -9 | |||||||||
| 7 | CVDFN1 | 3 | -14 | 6 | -8 | 6 | -15 | 3 | -16 | 13 | -10 | 6 | -15 | 2 | -12 | 6 | -14 | 11 | -9 | |||||||||
| 8 | CVDFN2 | 0 | -5 | -1 | -5 | 1 | -5 | -2 | -6 | 0 | -4 | 5 | -7 | -3 | -3 | 3 | -5 | 6 | -1 | |||||||||
| 9 | 频率 | FDF75 | -5 | 21 | 5 | 16 | 7 | 13 | -1 | 20 | 1 | 21 | 11 | 21 | 1 | 18 | -3 | 16 | 11 | 10 | ||||||||
| 10 | FDF90 | 1 | 4 | -1 | 9 | -2 | 14 | -6 | 7 | 1 | 10 | -3 | 13 | -2 | 8 | 2 | -23 | 13 | -29 | |||||||||
| 11 | FDF25 | 4 | 5 | 6 | 1 | 8 | 16 | -4 | 7 | -1 | 9 | 1 | 4 | -2 | 4 | -4 | 6 | 1 | 4 | |||||||||
| 12 | FDF10 | 5 | -3 | -3 | -3 | 3 | -8 | 5 | -16 | 2 | 2 | 5 | -4 | 9 | -8 | 19 | -11 | 13 | -7 | |||||||||
| 13 | 历时 | DDF75 | -1 | -2 | 1 | -3 | 0 | -1 | -3 | -3 | -2 | -4 | 0 | -3 | -3 | -4 | -5 | -5 | -4 | -5 | ||||||||
| 14 | DDF90 | -2 | -45 | 0 | -43 | 2 | -38 | -4 | -47 | -3 | -44 | 0 | -42 | -3 | -50 | -12 | -51 | -8 | -51 | |||||||||
| 15 | DDF25 | 2 | -7 | -5 | -5 | -5 | -7 | 4 | -6 | 0 | -5 | 0 | -5 | 5 | -5 | 13 | -8 | 11 | -6 | |||||||||
| 16 | DDF10 | 4 | -12 | -3 | -9 | -8 | -12 | 8 | -10 | 4 | -10 | 2 | -11 | 12 | -10 | 27 | -15 | 27 | -10 | |||||||||
| 17 | 发生时间 | TDFC | -1 | 1 | -1 | 2 | 0 | 0 | 0 | 1 | -1 | 1 | -1 | 1 | 0 | 1 | -1 | 1 | -1 | 2 | ||||||||
| 18 | TMnDF | -5 | 154 | 8 | 143 | 1 | 121 | 2 | 117 | -3 | 147 | 16 | 115 | 10 | 160 | -1 | 124 | 10 | 119 | |||||||||
| 19 | TMxDF | 0 | 0 | 1 | -2 | 2 | 0 | 2 | -3 | 1 | -5 | 1 | -2 | 2 | -2 | -2 | -2 | 0 | 0 | |||||||||
| 20 | 变化率 | RR | 9 | -18 | 7 | -16 | 5 | -17 | 11 | -18 | 9 | -14 | 12 | -18 | 15 | -15 | 22 | -18 | 38 | -19 | ||||||||
| 21 | RF | 7 | 1 | 2 | 6 | 0 | 3 | 6 | 4 | 4 | 7 | 5 | 4 | 10 | 6 | 15 | 7 | 25 | 10 | |||||||||
| [1] |
|
| [2] |
|
| [3] |
|
| [4] |
|
| [5] |
|
| [6] |
|
| [7] |
|
| [8] |
|
| [9] |
|
| [10] |
|
| [11] |
|
| [12] |
|
| [13] |
|
| [14] |
|
| [15] |
|
| [16] |
|
| [17] |
|
| [18] |
|
| [19] |
|
| [20] |
|
| [21] |
|
| [22] |
[翟然, 刘志武, 戴会超, 等. 长江流域径流历史演变特征及未来预估. 水利水电技术(中英文), 2023, 54(6): 87-97.]
|
| [23] |
|
| [24] |
|
| [25] |
|
| [26] |
|
| [27] |
|
| [28] |
|
| [29] |
|
| [30] |
|
| [31] |
|
| [32] |
|
| [33] |
|
| [34] |
|
| [35] |
|
| [36] |
|
| [37] |
Changjiang Water Resources Commission of the Ministry of Water Resources. The top-level design for joint operation research of reservoir groups in the River basin. Wuhan: Changjiang Water Resources Commission of the Ministry of Water Resources, 2015.
[水利部长江水利委员会. 流域水库群联合调度研究顶层设计报告. 武汉: 水利部长江水利委员会, 2015.]
|
| [38] |
|
| [39] |
[刘文彬, 杨涛, 杜牧野, 等. 三峡水库运行对长江中下游典型水文站水文机制的影响. 三峡生态环境监测, 2018, 3(3): 8-15.]
|
| [40] |
|
| [41] |
|
| [42] |
|
| [43] |
|
| [44] |
Changjiang Water Resources Commission of the Ministry of Water Resources. 2019 Plan for joint operation and dispatch of water projects in the Yangtze River basin. Wuhan: Changjiang Water Resources Commission of the Ministry of Water Resources, 2019.
[水利部长江水利委员会.2019年长江流域水工程联合调度运用计划. 武汉: 水利部长江水利委员会, 2019.]
|
| [45] |
|
| [46] |
|
| [47] |
|
| [48] |
|
| [49] |
|
| [50] |
|
| [51] |
|
| [52] |
|
| [53] |
[李蔚, 陈晓宏, 何艳虎, 等. 改进SWAT模型水库模块及其在水库控制流域径流模拟中的应用. 热带地理, 2018, 38(2): 226-235.]
|
| [54] |
|
| [55] |
|
| [56] |
|
| [57] |
|
| [58] |
|
| [59] |
|
| [60] |
|
| [61] |
|
| [62] |
|
| [63] |
|
| [64] |
|
| [65] |
[张丽霞, 陈晓龙, 辛晓歌. CMIP6情景模式比较计划(ScenarioMIP)概况与评述. 气候变化研究进展, 2019, 15(5): 519-525.]
|
/
| 〈 |
|
〉 |