
未来气候变化情景下浙江省陆地生态系统碳汇估算与保护区识别
|
王田雨(1995-), 女, 山东诸城人, 博士, 主要研究方向为国土空间规划。E-mail: tianyuw@hku.hk |
收稿日期: 2023-12-19
修回日期: 2024-11-17
网络出版日期: 2025-01-21
基金资助
国家社会科学基金重大项目(21ZDA064)
Estimation of terrestrial ecosystem carbon sinks and identification of carbon sink conservation areas under future climate change scenarios: A case study of Zhejiang province
Received date: 2023-12-19
Revised date: 2024-11-17
Online published: 2025-01-21
Supported by
Major Program of National Social Science Foundation of China(21ZDA064)
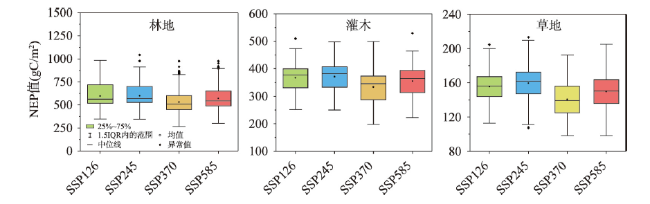
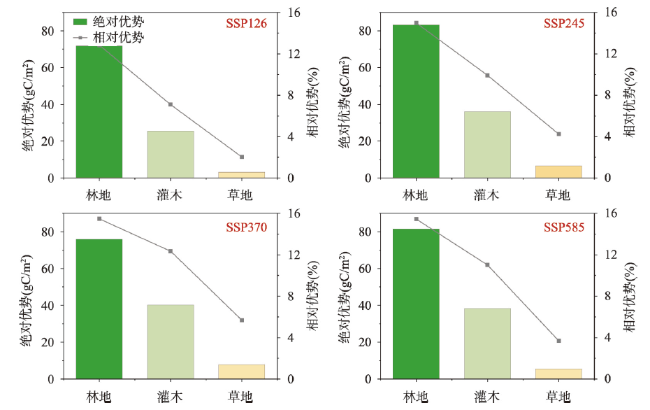
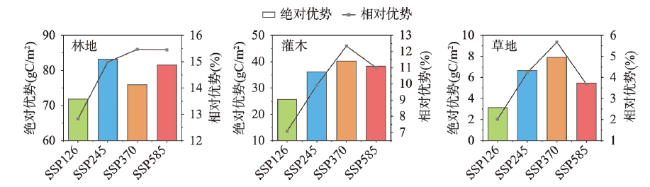
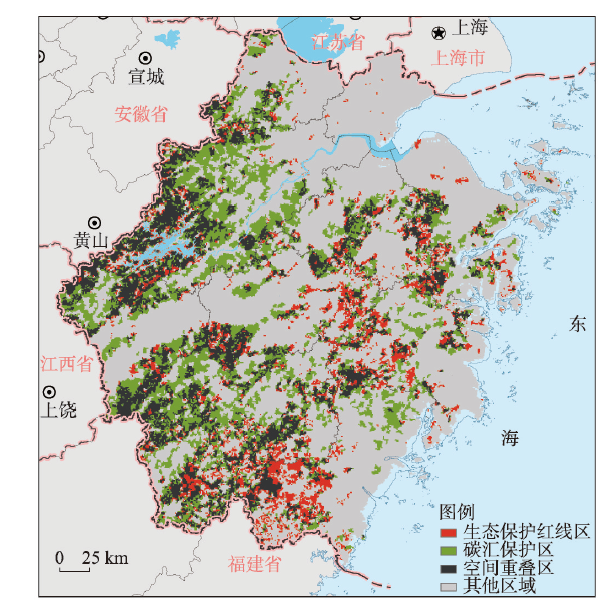
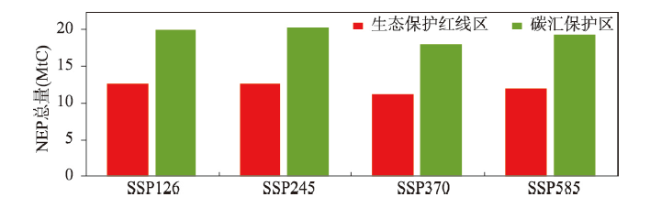
通过优化国土空间布局促进陆地生态系统减排增汇,从而推动碳中和目标实现是切实可行的方案。然而,如何在区域尺度上精确识别陆地生态系统碳汇水平及其空间分异特征,继而采取有效的国土空间开发保护调控措施,还存在许多尚未解决的问题。为此,本文以浙江省为例,采用集成生物圈模型(IBIS),实现公里网格精度下陆地生态系统碳汇模拟,并且基于未来不同气候变化情景下的模拟结果,识别并划定了碳汇保护区空间范围。结果表明,碳汇保护区内陆地生态系统固碳优势明显,其内部林地、灌木和草地系统的单位面积净生态系统生产力(NEP)均值分别比外部同类生态系统NEP值高出15%、10%和5%左右。当面临中等及以上社会脆弱性以及辐射强迫情景时,碳汇保护区固碳优势进一步提升。此外,通过将碳汇保护区与研究区现有生态保护红线进行比较,发现有超过一半的区域尚未被纳入生态保护红线范畴。相较于生态保护红线,碳汇保护区范围内的NEP总量每年预计将高出超过7 MtC,同时林地平均碳汇效率高出15~22 gC/m2。本文定量化研究了在国土空间格局优化及现有生态保护红线制度中,加入并强化生态系统碳汇功能考量的重要性和必要性,并提出相应的政策建议。
王田雨 , 岳文泽 , 黄波 , 钟鹏宇 . 未来气候变化情景下浙江省陆地生态系统碳汇估算与保护区识别[J]. 地理学报, 2025 , 80(1) : 183 -199 . DOI: 10.11821/dlxb202501012
Enhancing the carbon sequestration capabilities of terrestrial ecosystems by optimizing territorial spatial layout is a feasible approach to achieving the "carbon neutrality" goals. However, accurately identifying and characterizing the spatial differentiation of terrestrial ecosystem carbon sinks on a regional scale remains a challenge. As a result, effective territorial spatial management measures have yet to be established. To address this issue, this study uses Zhejiang province as an example, employing the Integrated Biosphere Simulator (IBIS) to simulate terrestrial ecosystem carbon sinks at 1-km grid resolution. Based on simulation results under different future climate change scenarios, we identify and delineate carbon sink conservation areas with adaptive features in response to climate change. The analysis results show that terrestrial ecosystems within carbon sink conservation areas exhibit a significant carbon sequestration advantage. Within these areas, the average Net Ecosystem Productivity (NEP) per unit area of forests, shrubs, and grasslands exceeds approximately 15%, 10%, and 5%, respectively. Under medium to high social vulnerability and radiative forcing scenarios, the carbon sequestration advantage of the terrestrial ecosystems within carbon sink conservation areas is further amplified. Additionally, by contrasting the carbon sink conservation areas with the existing Ecological Conservation Redline (ECR) in the study region, it is discovered that more than half of the areas have not yet been incorporated into the ECR. In comparison to the ECR, it is estimated that the total Net Ecosystem Productivity (NEP) within the carbon sink conservation areas is over 7 MtC annually, with the average carbon sequestration efficiency of forested regions surpassing the ECR by 15-22 g C/m2. This study underscores the importance and necessity of integrating and enhancing the consideration of ecosystem carbon sink function in optimizing territorial spatial patterns and existing ECR systems from a quantitative standpoint. Furthermore, we put forward corresponding policy recommendations.
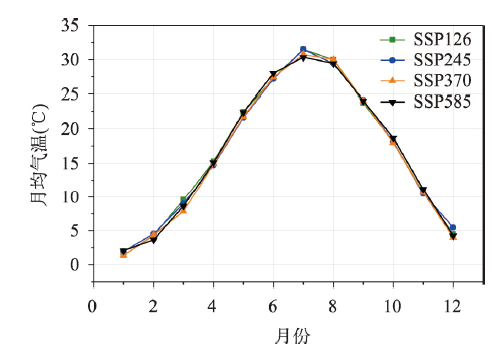
图2 2020—2035年气候变化情景下浙江气温逐月均值Fig. 2 The monthly temperature change curve in Zhejiang under future climate change scenarios in 2020-2035 |
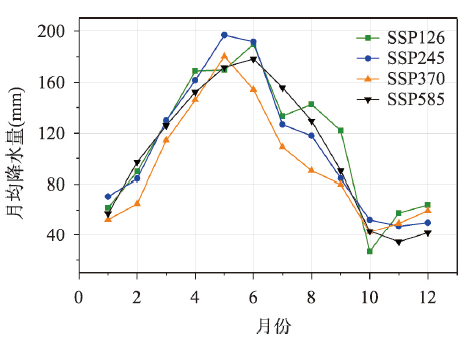
图3 2020—2035年气候变化情景下浙江降水量月均值变化曲线Fig. 3 The monthly precipitation change curve in Zhejiang under future climate change scenarios in 2020-2035 |
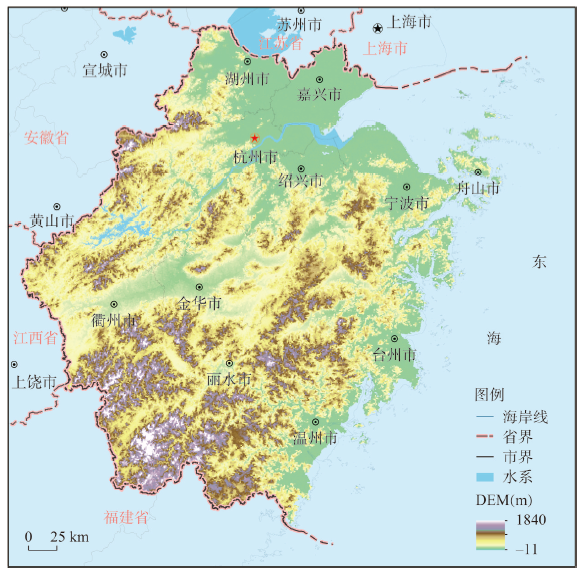
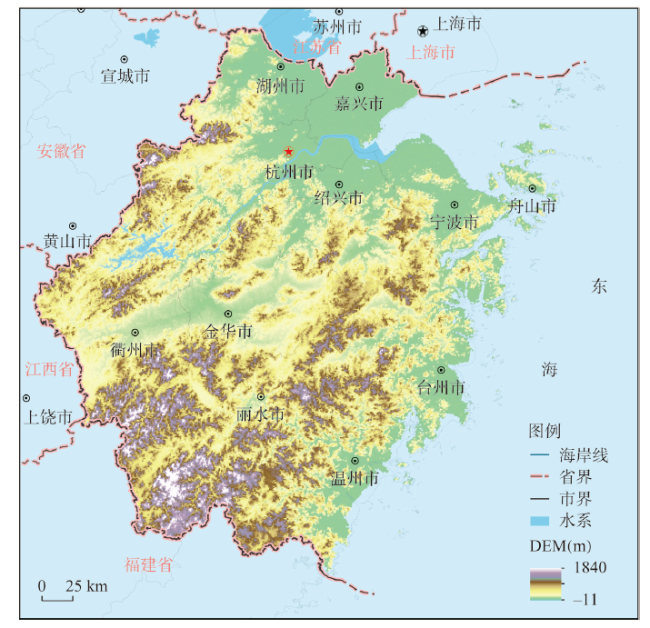
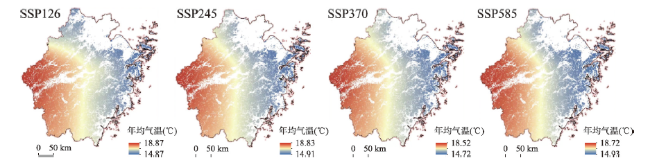
图4 2020—2035年气候变化情景下浙江年均气温空间分布Fig. 4 Spatial distribution of the annual average temperature in Zhejiang under future climate change scenarios in 2020-2035 |
表1 与已有文献林地碳汇估算结果的比较Tab. 1 Comparative analysis of forest carbon sink estimations in relation to existing scholarly literature |
| 地区 | 时间 | 方法 | NEP(gC/m2) | 文献 |
|---|---|---|---|---|
| 浙江省 | 2020—2035年 | IBIS | 529.54~598.54 | 本文 |
| 中国 | 2003—2012年 | FORCCHN | 252.51 | [43] |
| 中国 | 2003—2012年 | 实验观测 | 283.56 | [43] |
| 黄河流域 | 2020年 | CASA | 412.63 | [44] |
| 浙江省 | 2006年 | CASA | 400~625 | [45] |
| 福建省 | 2002年 | 实验观测 | 362~766 | [46] |
| 海南 | 1999—2018年 | 遥感监测 | 439.47~534.68 | [47] |
| 东北地区 | 2000—2015年 | Biome-BGC | 284.15 | [48] |
| 东北地区 | 2004—2005年 | IBIS | 400~740 | [49] |
图13 浙江省碳汇保护区与生态保护红线区内陆地生态系统NEP总量统计Fig. 13 Total NEP of terrestrial ecosystems within carbon sink conservation areas and ecological conservation redline zones |
表2 浙江省碳汇保护区与生态保护红线区范围内陆地生态系统碳汇效率比较Tab. 2 Comparison of the carbon sequestration efficiency of terrestrial ecosystems within the scope of the carbon sink conservation areas and the ecological conservation redline zones |
| 气候变化情景 | 生态系统类型 | NEP均值 | |||
|---|---|---|---|---|---|
| 碳汇保护区(gC/m2) | 生态保护红线区(gC/m2) | 绝对优势(gC/m2) | 相对优势(%) | ||
| SSP126 | 林地 | 631.53 | 614.66 | 16.88 | 2.75 |
| 灌木 | 387.33 | 381.03 | 6.30 | 1.65 | |
| 草地 | 158.00 | 154.69 | 3.32 | 2.14 | |
| SSP245 | 林地 | 639.03 | 617.80 | 21.23 | 3.44 |
| 灌木 | 399.86 | 390.30 | 9.56 | 2.45 | |
| 草地 | 164.94 | 160.48 | 4.46 | 2.78 | |
| SSP370 | 林地 | 566.61 | 548.07 | 18.54 | 3.38 |
| 灌木 | 365.61 | 356.98 | 8.63 | 2.42 | |
| 草地 | 146.87 | 141.83 | 5.03 | 3.55 | |
| SSP585 | 林地 | 608.87 | 587.07 | 21.80 | 3.71 |
| 灌木 | 385.80 | 375.84 | 9.96 | 2.65 | |
| 草地 | 154.25 | 149.83 | 4.42 | 2.95 | |
| [1] |
|
| [2] |
|
| [3] |
[于贵瑞, 朱剑兴, 徐丽, 等. 中国生态系统碳汇功能提升的技术途径: 基于自然解决方案. 中国科学院院刊, 2022, 37(4): 490-501.]
|
| [4] |
|
| [5] |
|
| [6] |
[赖力, 黄贤金. 中国土地利用的碳排放效应研究. 南京: 南京大学出版社, 2011.]
|
| [7] |
[曲福田, 卢娜, 冯淑怡. 土地利用变化对碳排放的影响. 中国人口·资源与环境, 2011, 21(10): 76-83.]
|
| [8] |
Ministry of Science and Technology. Global Ecological Environment Remote Sensing Monitoring Annual Report. http://www.nrscc.most.cn/, 2024-01-05.
[科技部. 全球生态环境遥感监测2023年度报告. http://www.nrscc.most.cn/, 2024-01-05.]
|
| [9] |
[黄征学, 祁帆. 完善国土空间用途管制制度研究. 宏观经济研究, 2018(12): 93-103.]
|
| [10] |
|
| [11] |
|
| [12] |
[李强, 桑家眸, 张健. 从保护区划定到红线管理: 国内外生态空间管制发展综述. 建筑师, 2020(1): 85-90.]
|
| [13] |
[冯琳, 雷国平. 基于生态安全格局的东北典型黑土区生态保护红线划定与优化. 自然资源学报, 2024, 39(2): 426-445.]
|
| [14] |
[徐昔保, 马晓武, 杨桂山. 基于生态系统完整性与连通性的生态保护红线优化探讨: 以长三角为例. 中国土地科学, 2020, 34(5): 94-103.]
|
| [15] |
[岳文泽, 夏皓轩, 吴桐, 等. 浙江省生境质量时空演变与生态红线评估. 生态学报, 2022, 42(15): 6406-6417.]
|
| [16] |
Ministry of Environmental Protection. Guidelines for Delineating Ecological Protection Red Lines. https://big5.mee.gov.cn/gate/big5/www.mee.gov.cn/gkml/hbb/bgt/201707/W020170728397753220005.pdf, 2017-05.
[环境保护部.生态保护红线划定指南. https://big5.mee.gov.cn/gate/big5/www.mee.gov.cn/gkml/hbb/bgt/201707/W020170728397753220005.pdf, 2017-05.]
|
| [17] |
Ministry of Environmental Protection. Technical Specification for Supervision of Ecological Conservation Redline: Baseline Investigation (on trial). 2019.
[环境保护部. 生态保护红线监管技术规范基础调查(试行). 2019.]
|
| [18] |
|
| [19] |
|
| [20] |
|
| [21] |
|
| [22] |
|
| [23] |
|
| [24] |
|
| [25] |
|
| [26] |
|
| [27] |
|
| [28] |
|
| [29] |
|
| [30] |
[王萍. 大小兴安岭森林生态系统碳平衡模拟研究[D]. 哈尔滨: 东北林业大学, 2009.]
|
| [31] |
|
| [32] |
[郭丽娟, 国庆喜. 集水区尺度下东北东部森林土壤呼吸的模拟. 生态学报, 2013, 33(13): 4090-4100.]
|
| [33] |
[高春雨. 气候变化情景下黑龙江省森林碳循环模拟[D]. 哈尔滨: 东北林业大学, 2015.]
|
| [34] |
[刘曦, 国庆喜, 刘经伟. IBIS模型验证与东北东部森林NPP季节变化模拟研究. 森林工程, 2010, 26(4): 1-7, 10.]
|
| [35] |
[郭丽娟, 国庆喜. IBIS模拟集水区尺度的东北东部森林净初级生产力. 北京林业大学学报, 2013, 35(5): 1-7.]
|
| [36] |
|
| [37] |
|
| [38] |
|
| [39] |
[冉有华, 马瀚青. 中国2000年1 km植物功能型分布图. 遥感技术与应用, 2016, 31(4): 827-832.]
|
| [40] |
|
| [41] |
|
| [42] |
|
| [43] |
[吕富成, 马建勇, 曹云, 等. 基于FORCCHN模型的中国典型森林生态系统碳通量模拟. 生态学报, 2022, 42(7): 2810-2821.]
|
| [44] |
[郭睿妍. 黄河流域森林碳汇的时空变化及其对驱动因子的响应[D]. 银川: 宁夏大学, 2022.]
|
| [45] |
[俞静芳. 基于CASA模型的浙江省植被净初级生产力估算[D]. 杭州: 浙江农林大学, 2012.]
|
| [46] |
[杨玉盛, 陈光水, 王义祥, 等. 格氏栲人工林和杉木人工林碳吸存与碳平衡. 林业科学, 2007, 43(3): 113-117.]
|
| [47] |
[刘应帅, 余瑞, 郑彬彬, 等. 海南岛森林植被NEP季节性时空变化规律及气候驱动因素分析. 热带生物学报, 2022, 13(2): 166-176.]
|
| [48] |
[梅晓丹, 李丹, 王强, 等. 基于Biome-BGC模型的小兴安岭森林碳通量时空分析. 测绘与空间地理信息, 2021, 44(11): 7-10.]
|
| [49] |
[刘曦. 运用IBIS模型估测东北东部森林生态系统碳动态的模拟[D]. 哈尔滨: 东北林业大学, 2011.]
|
/
| 〈 |
|
〉 |