
西北地区陆表水体退化对区域气溶胶时空格局的影响
|
王敬哲(1992-), 男, 河南郑州人, 博士, 讲师, 硕导, 主要从事资源环境遥感研究。E-mail: jzwang@szpu.edu.cn |
收稿日期: 2023-10-12
修回日期: 2024-11-15
网络出版日期: 2025-01-21
基金资助
天山创新团队项目(2022TSYCTD0001)
新疆维吾尔自治区自然科学基金重点项目(2021D01D06)
国家自然科学基金项目(42171269)
广东省基础与应用基础研究基金项目(2023A1515011273)
深圳市高等院校稳定支持计划(20220811173316001)
资源与环境信息系统国家重点实验室开放基金
Effects of degraded land surface water on spatiotemporal distribution of regional aerosols over northwest China
Received date: 2023-10-12
Revised date: 2024-11-15
Online published: 2025-01-21
Supported by
Tianshan Innovation Team(2022TSYCTD0001)
Key Project of Natural Science Foundation of Xinjiang Uygur Autonomous Region(2021D01D06)
National Natural Science Foundation of China(42171269)
Basic and Applied Basic Research of Guangdong Province of China(2023A1515011273)
Basic Research Program of Shenzhen(20220811173316001)
Grant from State Key Laboratory of Resources and Environmental Information System
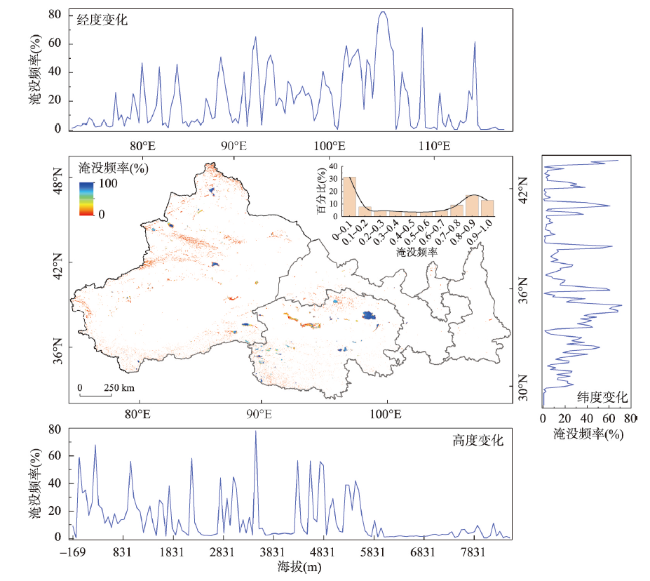
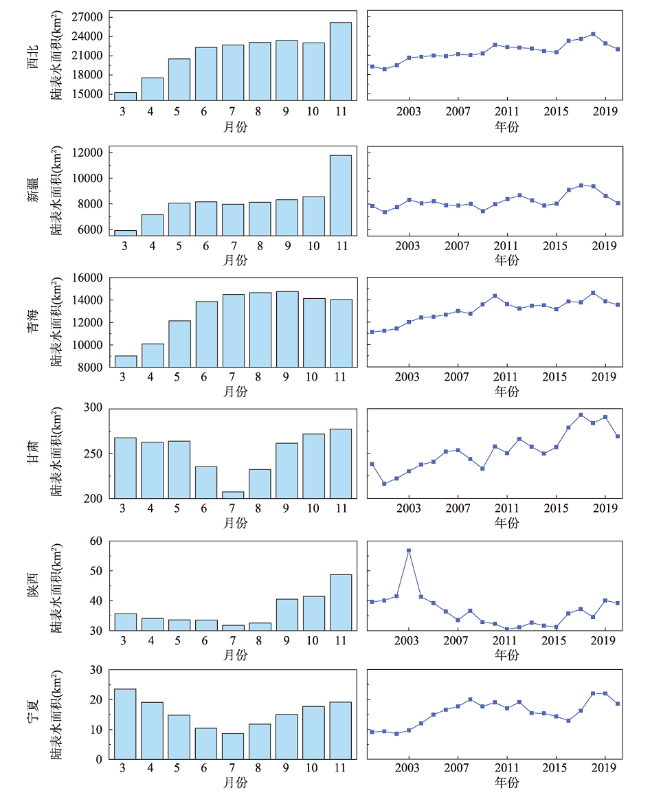
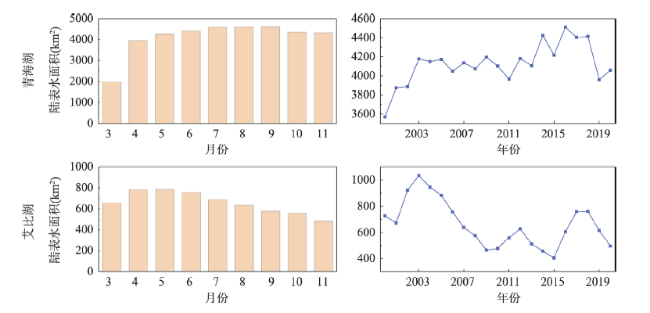
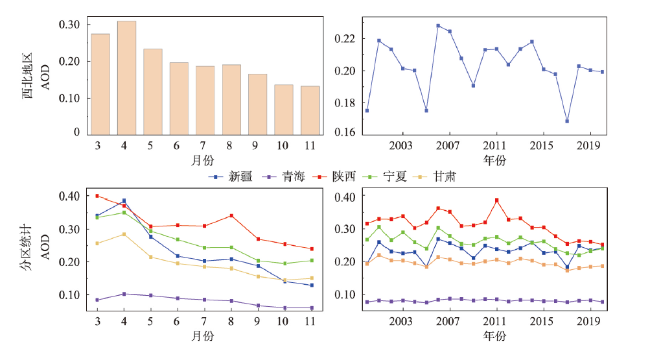
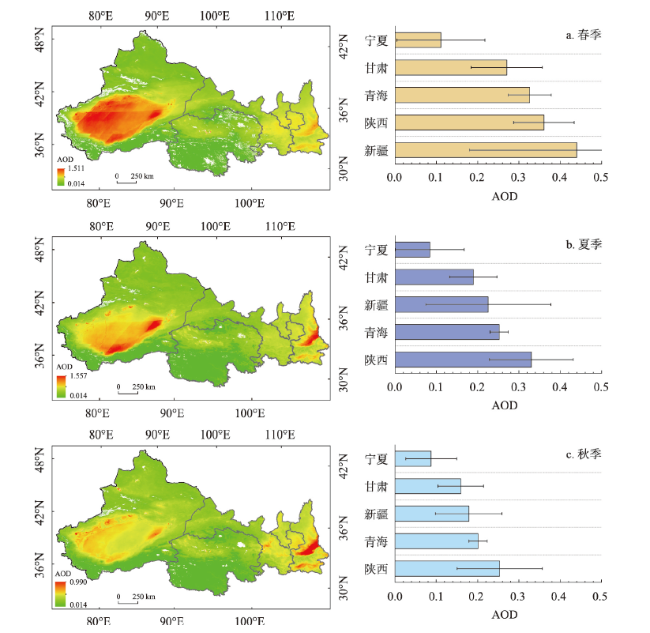
陆表水资源的减少,尤其是干旱区湖泊及其毗邻湿地的退化可能会导致产生新的盐/沙尘暴热点。全球变化背景下,西北地区陆表水体退化对区域气溶胶时空格局的影响尚不清晰。本文基于MODIS地表反射率数据(MOD09A1)提出了基于多种遥感指数动态阈值的水体识别方法对区域水体进行提取,在此基础上联合MAIAC气溶胶光学厚度(AOD)产品,系统分析了区域长时序陆表水体与AOD的动态变化;随后使用偏最小二乘路径模型(PLSPM)综合评估了不同时空尺度下陆表水体退化对盐/沙尘气溶胶的影响机制。研究发现:① 2000—2020年西北地区陆表水体呈持续增长趋势,陆表水资源98%以上分布在青海、新疆两省区。② 西北地区的AOD呈显著的季节性特征,所有省区AOD值均在春季达到了峰值,而在秋季为全年最低,高值主要集中分布在塔克拉玛干沙漠和黄土高原地区。③ 在以自然景观为主的整个西北地区及青海湖和艾比湖典型湖区,陆表水体面积的增(减)能够直接且显著地抑制(促进)气溶胶的增长。研究结果对理解干旱区不同地理单元盐/沙尘气溶胶的释放、传输过程与机制具有重要意义,同时也为干旱区水土资源管理及生态保育提供科学依据。
王敬哲 , 丁建丽 , 陈香月 , 葛翔宇 , 伍杨屹 . 西北地区陆表水体退化对区域气溶胶时空格局的影响[J]. 地理学报, 2025 , 80(1) : 147 -166 . DOI: 10.11821/dlxb202501010
The degradation of surface water resources, particularly in lakes and wetlands of arid regions, poses the risk of salt and dust storms. However, the impacts of the diminution of surface water on the spatiotemporal dynamics of regional aerosol patterns, especially in northwest China in the context of global environmental change is still unclear. Utilizing MODIS surface reflectance data (MOD09A1), this study introduces a dynamic threshold-based methodology for water body identification using multiple remote sensing indices. This framework is coupled with Multiangle Implementation of Atmospheric Correction (MAIAC) Aerosol Optical Depth (AOD) product to systematically assess the temporal dynamics of both surface water bodies and AOD. Employing a partial least squares path modeling (PLSPM) approach, this study comprehensively evaluates the mechanisms of surface water degradation on salt/sand and dust aerosols across various spatiotemporal scales. The results indicate that: (1) Surface water in the study area has exhibited a consistent upward trend from 2000 to 2020, with over 98% of resources localized in Qinghai and Xinjiang. (2) AOD levels in the northwest region demonstrate marked seasonality, peaking in spring and registering annual lows in autumn. High AOD concentrations are primarily in the Taklamakan Desert and the Loess Plateau. (3) In northwest China, as well as the typical regions of Qinghai Lake and Ebinur Lake featured by natural landscapes, fluctuations in surface water area directly and significantly correlate with aerosol growth. These findings have substantial implications for understanding salt and dust aerosol release and transmission mechanisms in arid regions while providing a scientific basis for resource management and ecological conservation.
Key words: land surface water; aerosol; spatiotemporal characteristics; PLSPM; northwest China
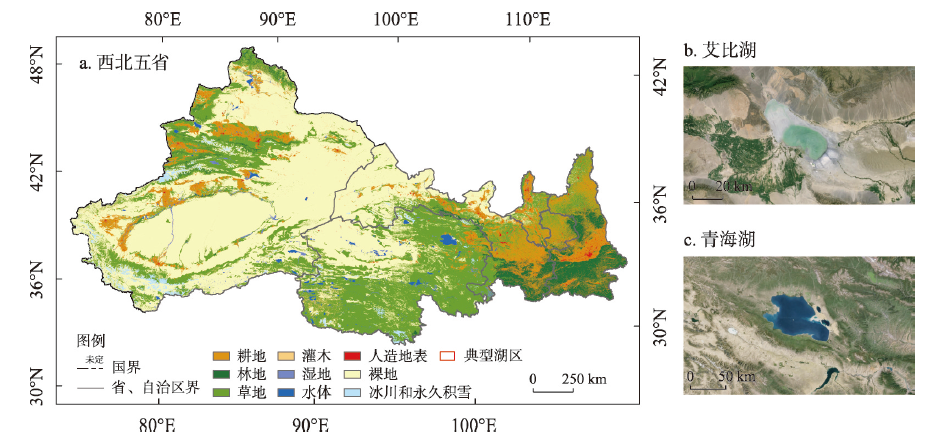
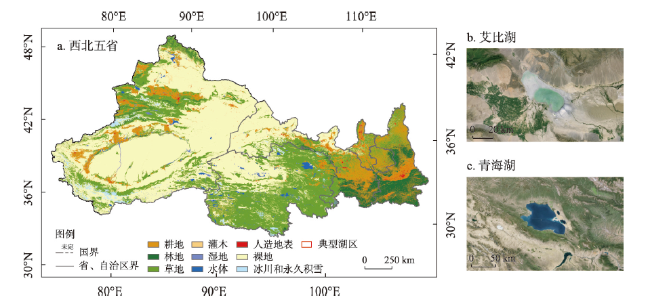
图1 研究区概况注:基于自然资源部标准地图服务网站GS(2020)4619号标准地图制作,底图边界无修改;图b~c数据影像获取自 https://earth.google.com/。 Fig. 1 Overview of the study area (northwest China) |
表1 本文数据的主要技术指标Tab. 1 Main parameters of the data used in this study |
| 要素 | 数据 | 时间分辨率/空间分辨率 | 数据来源 |
|---|---|---|---|
| 气溶胶(AOD) | MCD19A2 | 1 d/1 km | https://developers.google.cn/earth-engine/datasets/ |
| 地表反射率 | MOD09A1 | 8 d/500 m | https://developers.google.cn/earth-engine/datasets/ |
| 气温(Tmean) | 平均气温 | 1月/1 km | http://www.geodata.cn/data/ |
| 降水(P) | 平均降水 | 1月/1 km | http://www.geodata.cn/data/ |
| 风速(WS) | 平均风速 | 1月/1 km | http://www.geodata.cn/data/ |
| 相对湿度(RH) | 平均相对湿度 | 1月/1 km | http://www.geodata.cn/data/ |
| 潜在蒸散发(PET) | 平均潜在蒸散发 | 1月/1 km | http://www.geodata.cn/data/ |
| 实际蒸散发(ET) | MOD16A2 | 8 d/500 m | https://developers.google.cn/earth-engine/datasets/ |
| 土地覆被(LUCC) | MCD12Q1 | 1 a/500 m | https://developers.google.cn/earth-engine/datasets/ |
| 植被指数(NDVI) | MCD43A4 | 1 d/500 m | https://developers.google.cn/earth-engine/datasets/ |
| 土壤湿度(SM) | 土壤表层湿度 (0~10 cm) | 1 d/1 km | https://data.tpdc.ac.cn/ |
| 土壤温度(LST) | MOD11A1 | 1 d/1 km | https://developers.google.cn/earth-engine/datasets/ |
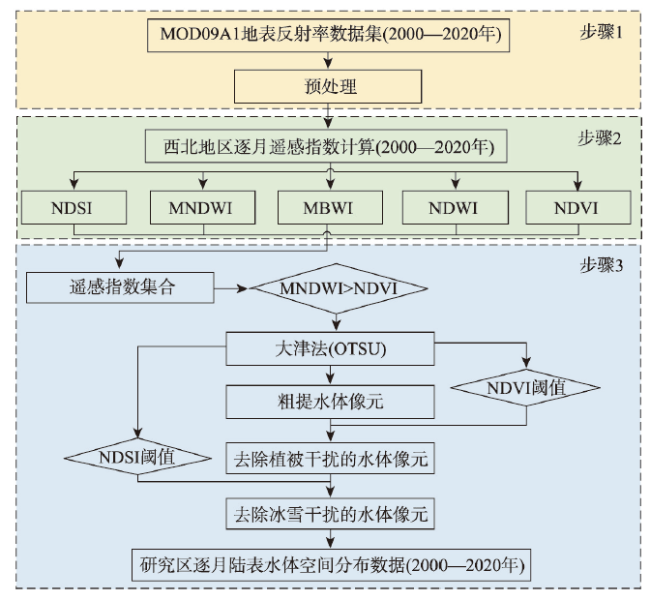
图2 基于GEE平台和MOD09A1数据的水体提取方案Fig. 2 Water extraction schemes based on GEE platform and MOD09A1 data |
表2 研究采用的遥感指数Tab. 2 Remote sensing indices used in this study |
| 遥感光谱指数 | 计算公式 | 参考文献 |
|---|---|---|
| 归一化水体指数 (Normalized Difference Water Index, NDWI) | NDWI=(Green-NIR)/(Green+NIR) | [41] |
| 改进的归一化水体指数 (Modified Normalized Difference Water Index, MNDWI) | MNDWI=(Green-SWIR1)/(Green+SWIR1) | [42] |
| 多波段水体指数 (Multi-band Water Index, MBWI) | MBWI=2×Green-Red-NIR-SWIR1-SWIR2 | [43] |
| 归一化植被指数 (Normalized Difference Vegetation Index, NDVI) | NDVI=(NIR-Red)/(NIR+Red) | [44] |
| 归一化积雪指数 (Normalized Difference Snow Index, NDSI) | NDSI=(Green-SWIR1)/(Green+SWIR1) | [45] |
注:Green表示绿波段,NIR表示近红外波段,SWIR表示短波红外波段(其中SWIR1、SWIR2对应波长1.628~1.652 μm与2.105~2.155 μm),Red表示红波段。 |
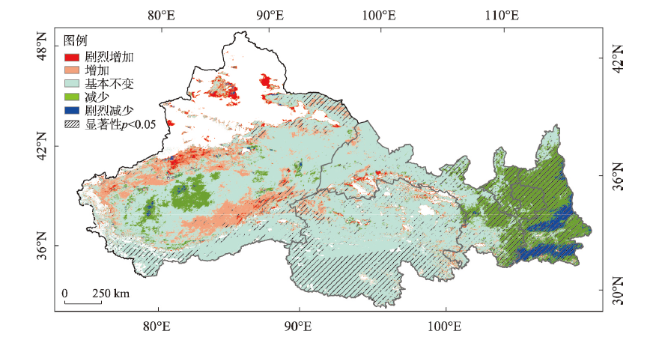
表3 2000—2020年间西北地区AOD演变趋势Tab. 3 The trends of AOD in Northwestern China from 2000 to 2022 |
| 时段 | 区域 | 线性拟合公式 | R2 | P值 |
|---|---|---|---|---|
| 2000—2020年 | 西北全域 | y=-0.0002x+0.2057 | 0.009 | 0.686 |
| 新疆 | y=0.0003x+0.2288 | 0.007 | 0.723 | |
| 陕西 | y=-0.0036x+0.3513 | 0.401 | 0.002 | |
| 青海 | y=-0.0001x+0.1545 | 0.013 | 0.998 | |
| 宁夏 | y=-0.0025x+0.2872 | 0.445 | 0.001 | |
| 甘肃 | y=-0.0010x+0.2076 | 0.301 | 0.010 | |
| 2000—2012年 | 西北全域 | y=0.0010x+0.1982 | 0.051 | 0.456 |
| 新疆 | y=0.0013x+0.2230 | 0.040 | 0.515 | |
| 陕西 | y=0.0015x+0.3200 | 0.062 | 0.413 | |
| 青海 | y=0.0004x+0.0779 | 0.211 | 0.114 | |
| 宁夏 | y=-0.0016x+0.2809 | 0.095 | 0.305 | |
| 甘肃 | y=-0.0004x+0.2033 | 0.028 | 0.586 | |
| 2013—2020年 | 西北全域 | y=-0.0025x+0.2440 | 0.176 | 0.300 |
| 新疆 | y=-0.0012x-0.2541 | 0.018 | 0.754 | |
| 陕西 | y=-0.0110x0.4725 | 0.847 | 0.001 | |
| 青海 | y=-0.0005x+0.0881 | 0.224 | 0.236 | |
| 宁夏 | y=-0.0060x+0.3478 | 0.596 | 0.025 | |
| 甘肃 | y=-0.0036x+0.2526 | 0.544 | 0.037 |
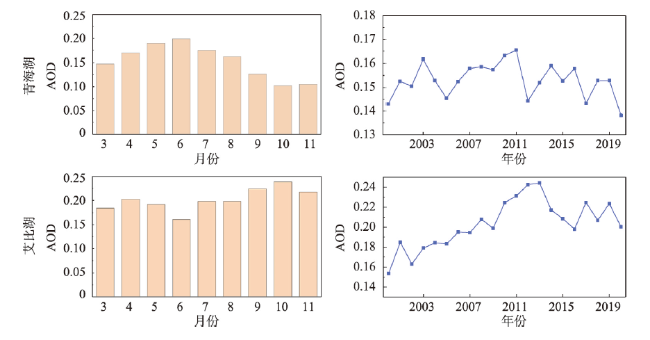
表4 2000—2020年间青海湖和艾比湖区域AOD演变趋势Tab. 4 The trends of AOD in Qinghai Lake and Ebinur Lake regions from 2000 to 2022 |
| 时段 | 区域 | 拟合公式 | R2 | P值 |
|---|---|---|---|---|
| 2000—2020年 | 青海湖 | y=-0.0001x+0.1545 | 0.013 | 0.619 |
| 艾比湖 | y=0.0026x+0.1741 | 0.464 | 0.001 | |
| 2000—2012年 | 青海湖 | y=0.0007x+0.1491 | 0.158 | 0.179 |
| 艾比湖 | y=0.0062x+0.1521 | 0.888 | 0.001 | |
| 2013—2020年 | 青海湖 | y=-0.0017x+0.1807 | 0.344 | 0.127 |
| 艾比湖 | y=-0.003x+0.2682 | 0.235 | 0.224 |
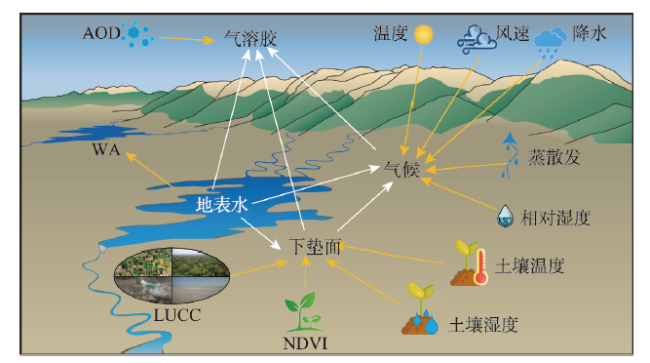
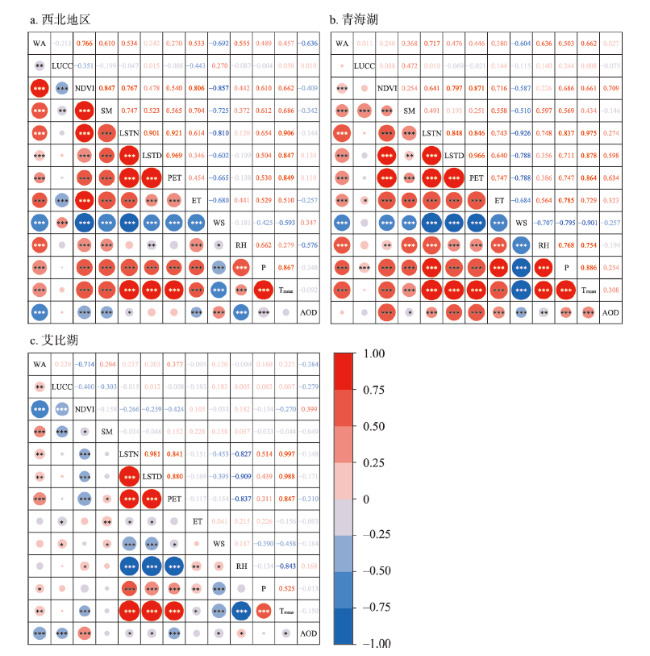
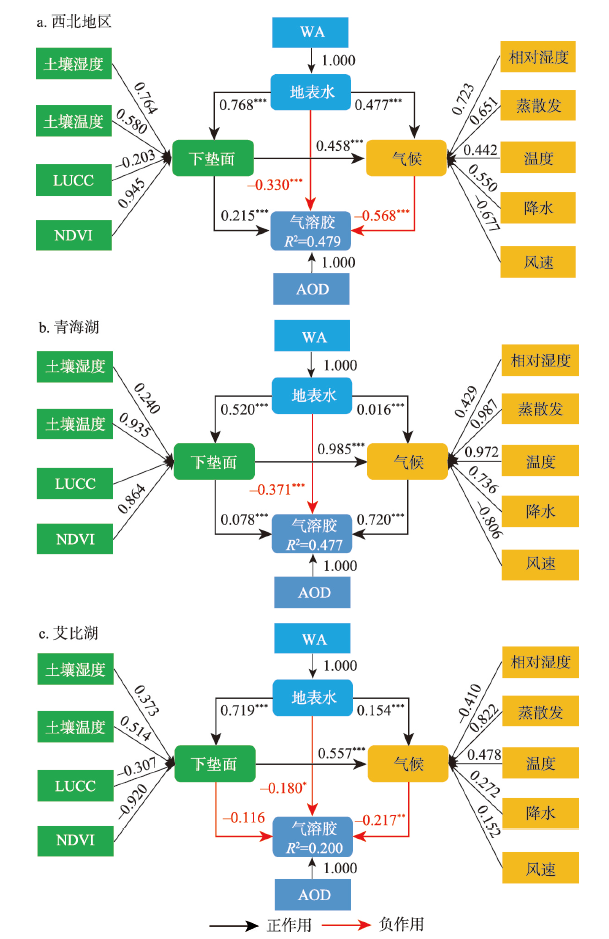
图12 2000—2020年陆表水体对气溶胶的影响注:箭头旁边数字显示直接路径系数,***、**、*分别表示通过p < 0.001、p < 0.01、p < 0.05显著性检验。 Fig. 12 Results of PLSPM on the effects of surface water on aerosols from 2000 to 2020 |
表5 不同时段陆表水体对气溶胶的直接与间接效果Tab. 5 The direct and indirect effects of surface water on aerosols in different periods |
| 时段 | 区域 | 总效果 | 总间接效果 | 间接效果 | ||
|---|---|---|---|---|---|---|
| 下垫面 | 气候 | 下垫面和气候 | ||||
| 2000—2020年 | 西北全域 | -0.636 | -0.306 | 0.165 | -0.271 | -0.200 |
| 青海湖 | 0.027 | 0.397 | 0.041 | 0.012 | 0.369 | |
| 艾比湖 | -0.384 | -0.203 | -0.083 | -0.033 | -0.087 | |
| 2000—2012年 | 西北全域 | -0.649 | -0.258 | 0.122 | -0.246 | -0.133 |
| 青海湖 | -0.005 | 0.397 | 0.128 | 0.031 | 0.238 | |
| 艾比湖 | -0.368 | -0.285 | -0.190 | -0.046 | -0.049 | |
| 2013—2020年 | 西北全域 | -0.651 | -0.462 | 0.146 | -0.300 | -0.308 |
| 青海湖 | 0.100 | 0.270 | 0.906 | -0.081 | -0.556 | |
| 艾比湖 | -0.319 | -0.218 | 0.087 | -0.035 | -0.269 | |
| [1] |
|
| [2] |
[陈亚宁, 李稚, 范煜婷, 等. 西北干旱区气候变化对水文水资源影响研究进展. 地理学报, 2014, 69(9): 1295-1304.]
|
| [3] |
[张强, 杨金虎, 王朋岭, 等. 西北地区气候暖湿化的研究进展与展望. 科学通报, 2023, 68(14): 1814-1828.]
|
| [4] |
|
| [5] |
[杨胜天, 于心怡, 丁建丽, 等. 中亚地区水问题研究综述. 地理学报, 2017, 72(1): 79-93.]
|
| [6] |
[吉力力·阿不都外力. 干旱区湖泊与盐尘暴. 北京: 中国环境科学出版社, 2012.]
|
| [7] |
|
| [8] |
|
| [9] |
|
| [10] |
[张喆, 丁建丽, 王瑾杰, 等. 艾比湖盐尘气溶胶光学特性卫星和地基遥感观测. 遥感学报, 2017, 21(5): 665-678.]
|
| [11] |
|
| [12] |
[陈香月, 丁建丽, 王敬哲, 等. 艾比湖流域气溶胶光学厚度时空演变及影响因素. 环境科学, 2019, 40(11): 4824-4832.]
|
| [13] |
|
| [14] |
|
| [15] |
|
| [16] |
|
| [17] |
|
| [18] |
|
| [19] |
|
| [20] |
|
| [21] |
|
| [22] |
|
| [23] |
|
| [24] |
[彭妍菲, 李忠勤, 姚晓军, 等. 基于多源遥感数据和GEE平台的博斯腾湖面积变化及影响因素分析. 地球信息科学学报, 2021, 23(6): 1131-1153.]
|
| [25] |
|
| [26] |
[付东杰, 肖寒, 苏奋振, 等. 遥感云计算平台发展及地球科学应用. 遥感学报, 2021, 25(1): 220-230.]
|
| [27] |
[姚俊强, 杨青, 陈亚宁, 等. 西北干旱区气候变化及其对生态环境影响. 生态学杂志, 2013, 32(5): 1283-1291.]
|
| [28] |
[张强, 朱飙, 杨金虎, 等. 西北地区气候湿化趋势的新特征. 科学通报, 2021, 66(28/29): 3757-3571.]
|
| [29] |
[李哲, 丁永建, 陈艾姣, 等. 1960—2019年西北地区气候变化中的Hiatus现象及特征. 地理学报, 2020, 75(9): 1845-1859.]
|
| [30] |
|
| [31] |
|
| [32] |
|
| [33] |
|
| [34] |
|
| [35] |
|
| [36] |
[陈香月, 丁建丽, 王敬哲, 等. MODIS MAIAC高分辨率气溶胶光学厚度产品在干旱区的适用性研究. 遥感学报, 2023, 27(2): 406-419.]
|
| [37] |
|
| [38] |
|
| [39] |
|
| [40] |
|
| [41] |
|
| [42] |
|
| [43] |
|
| [44] |
|
| [45] |
|
| [46] |
|
| [47] |
|
| [48] |
|
| [49] |
|
| [50] |
|
| [51] |
[赵勇, 黄亚, 王贺佳, 等. 西部调水下长期气候效应研究. 水利学报, 2022, 53(3): 270-283, 295.
|
| [52] |
[王伟, 阿里木·赛买提, 马龙, 等. 1986—2019年新疆湖泊变化时空特征及趋势分析. 生态学报, 2022, 42(4): 1300-1314.]
|
| [53] |
[苏雅楠, 陈圣乾, 冯敏, 等. 陆地地表水卫星遥感监测进展与展望. 科学通报, 2024, 69(22): 3268-3282.]
|
| [54] |
|
| [55] |
[刘宝康, 卫旭丽, 杜玉娥, 等. 基于环境减灾卫星数据的青海湖面积动态. 草业科学, 2013, 30(2): 178-184.]
|
| [56] |
|
| [57] |
[张喆, 丁建丽, 王瑾杰. 中亚沙尘气溶胶时空分布特征及潜在扩散特性分析. 地理学报, 2017, 72(3): 507-520.]
|
| [58] |
|
| [59] |
|
| [60] |
|
| [61] |
[张喆, 丁建丽, 王瑾杰, 等. 天山北坡城市群气溶胶光学特性时空分布特征. 环境科学, 2021, 42(5): 2202-2212.]
|
| [62] |
|
| [63] |
|
| [64] |
|
| [65] |
[张强, 杨金虎, 马鹏里, 等. 西北地区气候暖湿化增强东扩特征及其形成机制与重要环境影响. 干旱气象, 2023, 41(3): 351-358.]
|
/
| 〈 |
|
〉 |