
高原山地—湖泊地区雨季地表水补给来源的空间格局及形成机制
|
廖会娟(1998-), 女, 硕士生, 主要从事同位素水文研究。E-mail: bswliao@163.com |
收稿日期: 2023-10-07
修回日期: 2024-05-26
网络出版日期: 2024-07-30
基金资助
云南省基础研究专项(202201BC070001)
云南省基础研究专项(202201AS070024)
2023云南师范大学地理学部科研培育重点项目(01300205020516083/022)
Spatial pattern and formation mechanism of surface water recharge sources in plateau mountain-lake region during the rainy season
Received date: 2023-10-07
Revised date: 2024-05-26
Online published: 2024-07-30
Supported by
Yunnan Provincial Basic Research Project(202201BC070001)
Yunnan Provincial Basic Research Project(202201AS070024)
2023's Promotion Project of Scientific Research by Faculty of Geography in Yunnan Normal University(01300205020516083/022)
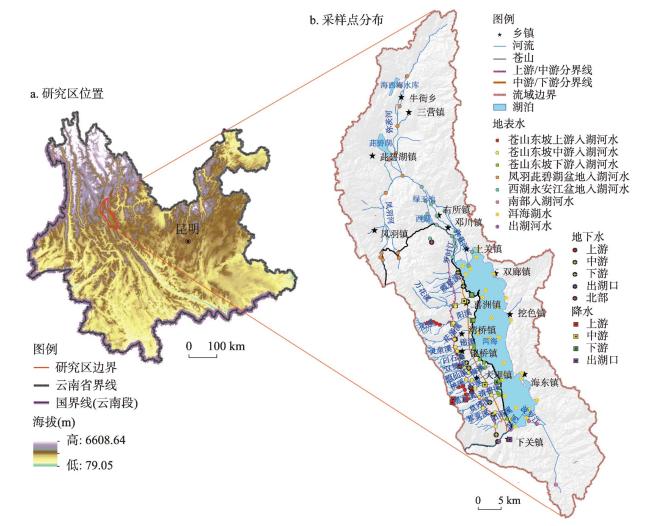
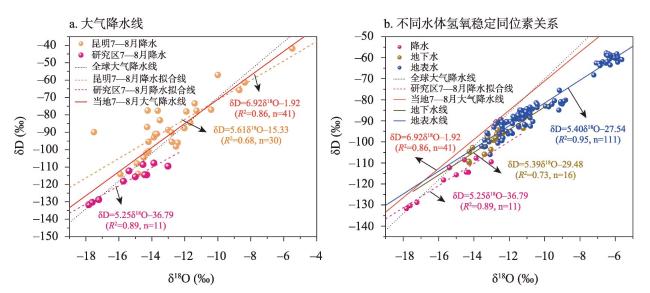
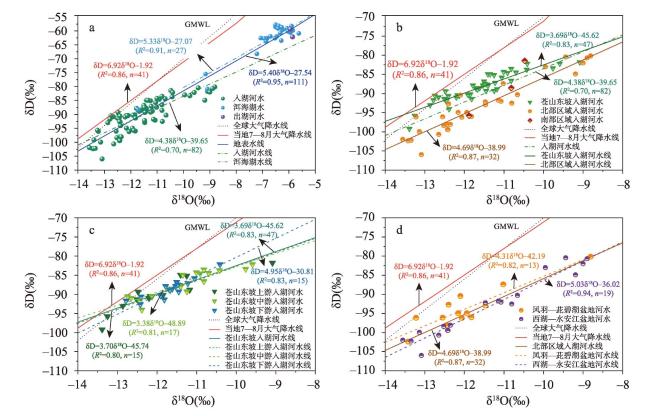
本文旨在解析中国西南高原山地—湖泊地区雨季地表水补给格局及其形成机制,基于2022年7—8月在洱海流域采集的多水体氢氧稳定同位素数据,利用贝叶斯混合模型和遥感技术,量化地表水的补给源和比例,并探究水体转化机制。结果表明:① 洱海流域雨季降水受蒸发和季风气候等影响,其氢氧同位素值与地下水和地表水相比偏负。地下水δD、δ18O表明,在高海拔及富水性高的区域地下水氢氧同位素值偏负,d-excess值则表明不同含水岩组的蒸发差异。地表水氢氧同位素值随着水体从入湖河水经过洱海湖水到出湖河水的流动逐渐偏正,其中苍山东坡和南部区域同位素值较北部区域而言更偏正,就苍山东坡而言,其中游地区蒸发作用最为显著。② 苍山—洱海间地表水补给来源的空间格局显示,地表水对其下游混合水体的贡献率最大。其中降水和地表水在苍山—洱海间各河段的贡献率皆表现为,在出山口以上河段的降水、地表水贡献率小于出山口之后河段;而地下水贡献率反之。③ 沿河流流向,其地形、地质条件、地表覆盖和水汽特征共同影响地表水补给来源的空间格局,植被覆盖状况好、地表温度高和实际蒸散量多的区域,降水对地表水的补给多;植被覆盖状况较差的区域,地表水的补给较多;地下水对地表水的贡献率则取决于含水岩组类型。

廖会娟 , 柴勇 , 角媛梅 , 张华 , 佘万江 , 卢瑞涛 , 沈剑 , 徐秋娥 , 贾士豪 . 高原山地—湖泊地区雨季地表水补给来源的空间格局及形成机制[J]. 地理学报, 2024 , 79(7) : 1862 -1879 . DOI: 10.11821/dlxb202407014
This research aims to decipher the patterns and mechanisms of surface water recharge during the rainy season in plateau mountain-lake region. Based on the stable hydrogen and oxygen isotope data of multiple water bodies collected in the Erhai Lake Basin from July to August 2022, and using Bayesian mixing models and remote sensing technology, the study quantifies the sources and proportions of surface water recharge and explores water body transformation mechanisms. The results indicate that: (1) Precipitation in the Erhai Lake Basin during the rainy season is influenced by evaporation and monsoon climate, resulting in hydrogen and oxygen isotope values that are more negative compared to groundwater and surface water. Groundwater δD and δ18O indicate that in areas of high altitude and high water richness, the hydrogen and oxygen isotope values of groundwater are more negative, while d-excess values reveal evaporation differences among different aquifer groups. The hydrogen and oxygen isotope values of surface water gradually become more positive as the water flows from inflowing rivers through Erhai Lake to outflowing rivers, with the isotope values on the eastern slope and southern region of Cangshan Mountain being more positive compared to the northern region. For the eastern slope of Cangshan Mountain, the midstream area shows the most significant evaporation. (2) The spatial pattern of surface water recharge sources between Cangshan Mountain and Erhai Lake shows that surface water contributes the most to its downstream mixed water bodies. The contribution rate of precipitation and surface water in each river section between Cangshan Mountain and Erhai Lake is shown as follows: the contribution rate of precipitation and surface water in the river section above the mountain outlets is smaller than that in the river section below the mountain outlets; while the contribution rate of groundwater is vice versa. (3) Along the river flow direction, the spatial pattern of surface water recharge sources is jointly influenced by topography, geological conditions, surface cover, and water vapor characteristics. Areas with good vegetation cover, high surface temperatures, and high actual evapotranspiration receive more precipitation recharge; areas with relatively poor vegetation cover receive more surface water recharge and the contribution rate of groundwater to surface water depends on the type of aquifer groups.
表1 洱海流域雨季不同水体δD、δ18O和d-excess值Tab. 1 The δD, δ18O and d-excess values of different water bodies in the Erhai Lake Basin during the rainy season |
| 类型 | 数量(个) | δD(‰) | δ18O(‰) | d-excess(‰) | |||||
|---|---|---|---|---|---|---|---|---|---|
| 均值±标准差 | 变化范围 | 均值±标准差 | 变化范围 | 均值±标准差 | 变化范围 | ||||
| 降水 | 11 | -117.4±8.4 | -131.7~-107.7 | -15.4±1.5 | -17.8~-13.0 | 5.4±5.0 | -5.4~10.8 | ||
| 地下水 | 16 | -100.0±5.1 | -109.9~-93.5 | -13.1±0.1 | -14.3~-11.2 | 4.7±3.4 | -3.9~9.8 | ||
| 地表水 | 111 | -83.3±13.5 | -106.0~-57.8 | -10.3±2.4 | -13.6~-5.6 | -0.7±7.1 | -15.9~11.4 | ||
| 入湖河水 | 82 | -90.5±5.8 | -106.0~-80.2 | -11.6±1.1 | -13.6~-8.8 | 2.4±5.1 | -11.4~11.4 | ||
| 洱海湖水 | 27 | -63.2±7.1 | -88.2~-57.8 | -6.8±1.3 | -11.7~-5.6 | -9.0±4.0 | -15.9~5.6 | ||
| 出湖河水 | 2 | -59.4±1.4 | -62.2~-59.4 | -5.90±0.1 | -5.9~-5.9 | -13.6±1.7 | -15.3~-11.8 | ||
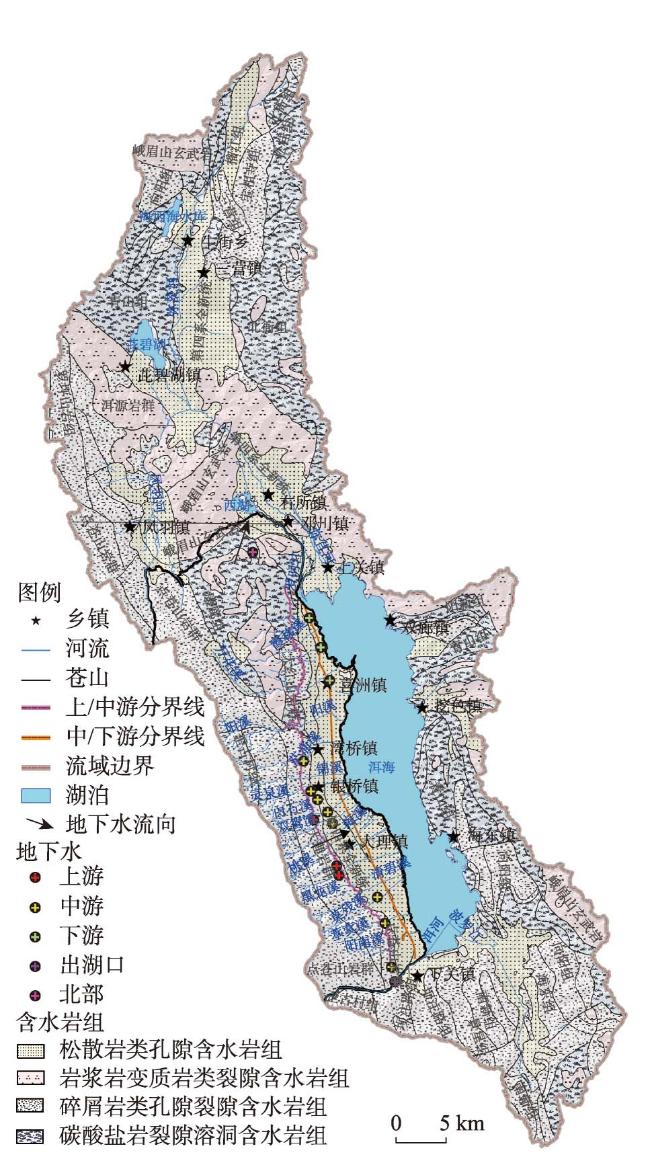
图3 研究区地下水样点及水文地质简图Fig. 3 Groundwater sampling points and hydrogeology in the study area |
表2 洱海流域地下水样品δD、δ18O和d-excess值及其含水岩组Tab. 2 The δD, δ18O and d-excess values of groundwater samples and the aquifer groups in the Erhai Lake Basin |
| 位置 | 数量 (个) | 海拔(m) | δ18O(‰) | δD(‰) | d-excess (‰) | 含水岩组 | 富水性 | |
|---|---|---|---|---|---|---|---|---|
| 北部 | 1 | 2306.03 | -14.3 | -109.9 | 4.2 | 碳酸盐岩裂隙溶洞含水岩组 | 贫乏:泉流量< 10 L/S | |
| 苍山东坡 | 14 | 2084.35 | -13.0±0.8 | -99.63±4.6 | 4.7±3.6 | - | - | |
| 上游 | 3 | 2250.82 | -12.8±1.2 | -100.0±4.6 | 2.2±5.7 | 碎屑岩类孔隙裂隙含水岩组 | 中等:泉流量0.1~1.0 L/S | |
| 中游 | 8 | 2059.34 | -12.8±0.3 | -96.9±4.6 | 5.5±2.0 | 松散岩类孔隙含水岩组 | 中等:单井涌水量1.2~5.8 L/S | |
| 下游 | 3 | 2002.96 | -14.0±0.4 | -106.6±1.9 | 5.3±3.3 | 松散岩类孔隙含水岩组 | 丰富:单井涌水量> 5.8 L/S | |
| 出湖口 | 1 | 1991.96 | -12.3 | -95.0 | 3.7 | 碎屑岩类孔隙裂隙含水岩组 | 中等:泉流量0.1~1.0 L/S | |
表3 洱海流域雨季入湖河水δD、δ18O和d-excess值Tab. 3 The δD, δ18O and d-excess values of the inflowing river water in the Erhai Lake Basin during the rainy season |
| 位置 | 样品 个数 | δD(‰) | δ18O(‰) | d-excess(‰) | |||||
|---|---|---|---|---|---|---|---|---|---|
| 均值±标准差 | 变化范围 | 均值±标准差 | 变化范围 | 均值±标准差 | 变化范围 | ||||
| 北部区域 | 32 | -93.6±6.9 | -106.0~-80.2 | -11.6±1.4 | -13.6~-8.8 | -0.5±5.2 | -11.4~9.6 | ||
| 凤羽—茈碧湖盆地 | 13 | -93.7±5.2 | -102.4~-80.2 | -12.0±1.1 | -13.4~-8.8 | 1.9±4.6 | -9.7~9.6 | ||
| 西湖—永安江盆地 | 19 | -93.5±7.9 | -106.0~-80.5 | -11.4±1.5 | -13.6~-8.9 | -2.1±4.9 | -11.4~6.5 | ||
| 苍山东坡 | 47 | -88.4±3.6 | -99.2~-81.8 | -11.6±0.9 | -13.4~-9.1 | 4.5±4.1 | -9.1~11.4 | ||
| 苍山东坡上游 | 15 | -89.8±4.1 | -99.2~-81.8 | -11.9±1.0 | -13.4~-9.1 | 5.5±4.7 | -9.1~10.5 | ||
| 苍山东坡中游 | 17 | -87.1±3.5 | -94.0~-82.1 | -11.3±0.9 | -12.7~-9.6 | 3.3±4.5 | 5.4~11.4 | ||
| 苍山东坡下游 | 15 | -88.6±2.6 | -92.6~-82.1 | -11.7±0.6 | -12.8~-10.4 | 4.8±2.4 | 1.1~10.6 | ||
| 南部区域 | 3 | -88.6±5.9 | -95.8~-81.4 | -11.1±0.6 | -11.9~-10.5 | -0.1±1.8 | -2.0~2.4 | ||
表4 地表水及其补给源的δ18O、d-excess值和其贡献率Tab. 4 The δ18O and d-excess values of suface water and its recharge sources, and their contribution rates |
| 补给水源 | 汇(混合水体) | 数量(个) | δ18O(‰) | d-exess(‰) | 贡献率(%) |
|---|---|---|---|---|---|
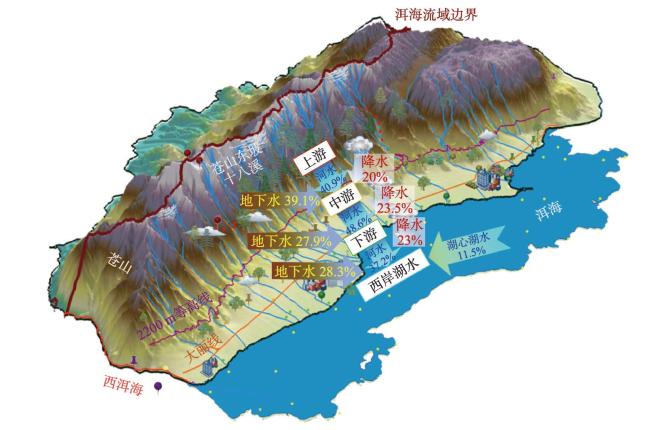
| 苍山东坡上游河水 | 15 | -11.9±1.0 | 5.6±4.7 | 40.9 | |
| 苍山东坡上游降水 | 3 | -16.2±2.2 | 5.3±7.8 | 20.0 | |
| 苍山东坡上游地下水 | 3 | -12.8±1.2 | 2.2±5.7 | 39.1 | |
| 苍山东坡中游河水 | 17 | -11.3±0.9 | 3.3±4.5 | - | |
| 苍山东坡中游河水 | 17 | -11.3±0.9 | 3.3±4.5 | 48.6 | |
| 苍山东坡中游降水 | 4 | -15.0±0.6 | 4.8±4.5 | 23.5 | |
| 苍山东坡中游地下水 | 8 | -12.8±0.3 | 5.5±2.0 | 27.9 | |
| 苍山东坡下游河水 | 15 | -11.7±0.6 | 4.8±2.4 | - | |
| 苍山东坡下游河水 | 15 | -11.7±0.6 | 4.8±2.4 | 37.2 | |
| 苍山东坡下游降水 | 3 | -15.4±1.4 | 5.5±2.5 | 23.0 | |
| 苍山东坡下游地下水 | 3 | -14.0±0.4 | 5.3±3.3 | 28.3 | |
| 洱海湖心湖水 | 5 | -6.1±0.4 | -11.2±2.6 | 11.5 | |
| 洱海西岸湖水 | 8 | -6.4±0.4 | -9.3±2.3 | - |
表5 中国典型山区地表水的补给来源及其比例Tab. 5 Sources and proportions of surface water recharge in typical mountainous areas of China |
| 混合水体(汇) | 补给水源及其比例(%) | 主要覆 盖时间 | 文献 来源 | ||||||||
|---|---|---|---|---|---|---|---|---|---|---|---|
| 降水 | 冰雪融水 | 多年冻土水 | 地下水 | 地热水 | 基流水 | 其上游河水 | 湖心湖水 | ||||
| 祁连山葫芦沟河水 | 68 | 11 | 21 | - | - | - | - | - | 1 a | [18] | |
| 祁连山和河西走廊河水 | 70 | 8 | 22 | - | - | - | - | - | 1 a | [22] | |
| 长江河水 | 30 | 16 | 54 | - | - | - | - | - | 5—10月 | [55] | |
| 黄河河水 | 63 | 5 | 32 | - | - | - | - | - | |||
| 澜沧江河水 | 63 | 7 | 30 | - | - | - | - | - | |||
| 疏勒河河水 | 62.5 | 5.8 | - | 19.8 | 11.9 | - | 6—9月 | [56] | |||
| 三江源 区河水 | 干流 | 61 | 5 | 34 | - | - | - | - | - | 6—9月 | [57] |
| 支流 | 32 | 15 | 53 | - | — | - | - | - | |||
| 雅鲁藏布江流域支流 | 拉萨河河水 | 34.2 | 28.8 | - | - | 37.0 | - | - | - | 7月 | [12,58] |
| 柴曲河水 | 24.5 | 70.39 | - | - | 5.2 | - | - | - | [58] | ||
| 多雄藏布江河水 | 27.6 | 68.16 | - | - | 4.3 | - | - | - | |||
| 湘曲河 | 52.9 | 0 | - | - | 47.1 | - | - | - | |||
| 年楚河河水 | 65.9 | 26.5 | - | - | 7.6 | - | - | - | |||
| 娘曲河水 | 10.7 | 51 | - | - | 38.3 | - | - | - | |||
| 帕隆藏布江河水 | 33.3 | 66.7 | - | - | 0 | - | - | - | |||
| 苍山 东坡 十八溪 | 中游河水 | 20 | - | - | 39.1 | - | - | 40.9 | - | 7—8月 | 本文 |
| 下游河水 | 23.5 | - | - | 27.9 | - | - | 48.6 | - | |||
| 洱海西岸湖水 | 23 | - | - | 28.3 | - | - | 37.2 | 11.5 | |||
| [1] |
|
| [2] |
|
| [3] |
|
| [4] |
[周思捷, 孙从建, 陈伟, 等. 黄土高原东部夏半年降水稳定同位素特征及水汽来源分析. 地理学报, 2022, 77(7): 1745-1761.]
|
| [5] |
[章新平, 姚檀栋. 利用稳定同位素比率估计湖泊的蒸发. 冰川冻土, 1997, 19(2): 161-166.]
|
| [6] |
|
| [7] |
[郝帅, 李发东. 艾比湖流域典型荒漠植被水分利用来源研究. 地理学报, 2021, 76(7): 1649-1661.]
|
| [8] |
|
| [9] |
|
| [10] |
[王诗语, 孙从建, 陈伟, 等. 基于水化学及径流组成的中国西北内陆河流域水资源风险评估. 地理学报, 2023, 78 (11): 2763-2780.]
|
| [11] |
|
| [12] |
|
| [13] |
|
| [14] |
|
| [15] |
|
| [16] |
|
| [17] |
[李铮, 钟君, 李思亮, 等. 青藏高原北部典型冰川流域化学风化研究. 地理学报, 2023, 78(7): 1792-1808.]
|
| [18] |
|
| [19] |
|
| [20] |
|
| [21] |
|
| [22] |
|
| [23] |
|
| [24] |
|
| [25] |
|
| [26] |
[齐冬梅, 李跃清. 高原季风研究主要进展及其科学意义. 干旱气象, 2007, 25(4): 74-79.]
|
| [27] |
[刘志林, 丁银平, 角媛梅. 中国西南—东南季风交汇区降水时空格局变化及其对食物产量的影响. 地理学报, 2021, 76(9): 2297-2311.]
|
| [28] |
[卢珊, 胡泽勇, 王百朋, 等. 近56年中国极端降水事件的时空变化格局. 高原气象, 2020, 39(4): 683-693.]
|
| [29] |
|
| [30] |
|
| [31] |
|
| [32] |
|
| [33] |
[刘君龙, 许继军, 袁喆, 等. CMADS驱动SWAT模型在水循环模拟中的应用: 以洱海流域为例. 人民长江, 2020, 51(3): 65-72.]
|
| [34] |
|
| [35] |
|
| [36] |
|
| [37] |
[黄慧君, 王永平, 李庆红. 洱海流域近50年气候变化特征及其对洱海水资源的影响. 气象, 2013, 39(4): 436-442.]
|
| [38] |
[李文娟, 严昌荣, 刘恩科, 等. 洱海流域近59年水资源的多时间尺度分析. 中国农业气象, 2010, 31(Suppl.1): 10-15, 19.]
|
| [39] |
|
| [40] |
|
| [41] |
|
| [42] |
|
| [43] |
|
| [44] |
|
| [45] |
|
| [46] |
|
| [47] |
[于津生. 中国同位素地球化学研究. 北京: 科学出版社, 1997: 112-113.]
|
| [48] |
|
| [49] |
|
| [50] |
|
| [51] |
|
| [52] |
|
| [53] |
[徐安伦, 李育, 杨帆, 等. 连年干旱背景下洱海流域降水的精细化特征. 高原气象, 2017, 36(6): 1557-1566.]
|
| [54] |
|
| [55] |
|
| [56] |
|
| [57] |
|
| [58] |
|
/
| 〈 |
|
〉 |
