
黄土高原典型小流域土壤侵蚀时空演变
|
石学瑾(2000-), 女, 湖南常德人, 硕士生, 主要从事土壤侵蚀过程研究。E-mail: shixuejin13@163.com |
收稿日期: 2023-07-10
修回日期: 2024-05-28
网络出版日期: 2024-07-30
基金资助
国家自然科学基金项目(41671276)
Spatial-temporal evolution of soil erosion in a typical watershed of the Loess Plateau
Received date: 2023-07-10
Revised date: 2024-05-28
Online published: 2024-07-30
Supported by
National Natural Science Foundation of China(41671276)
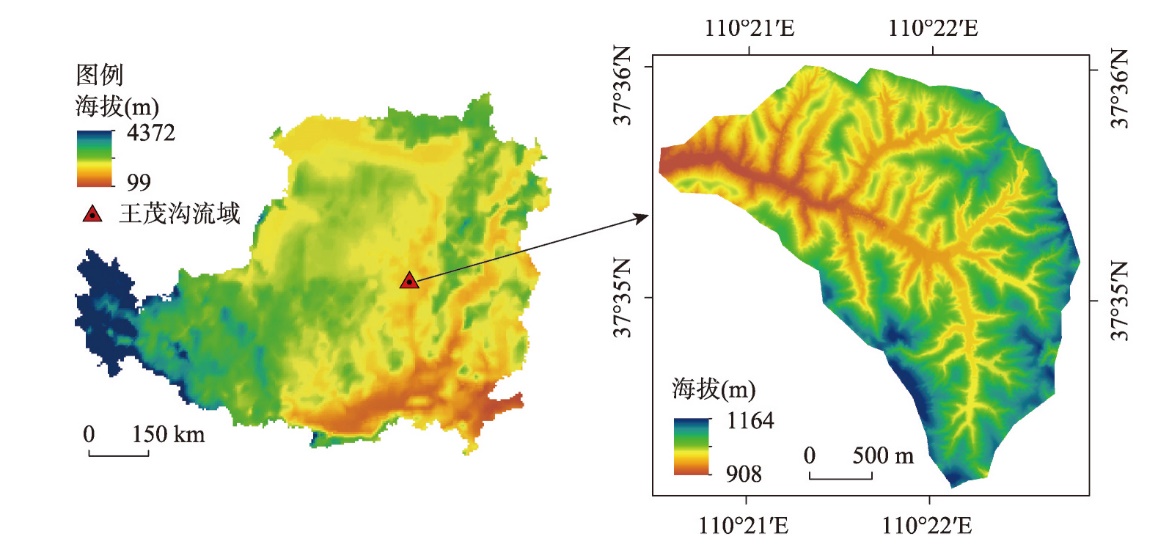
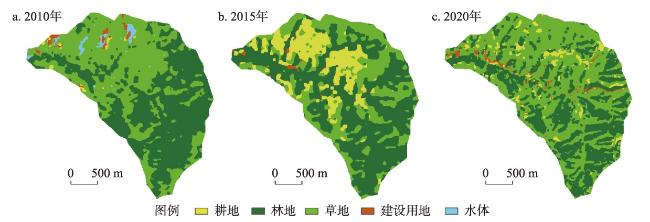
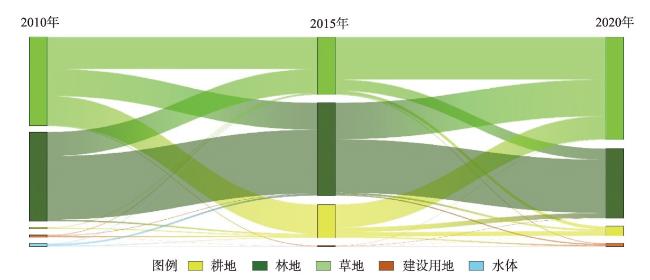
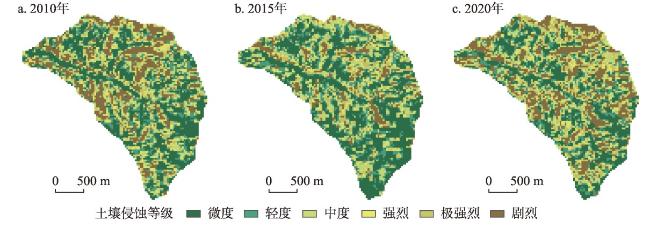
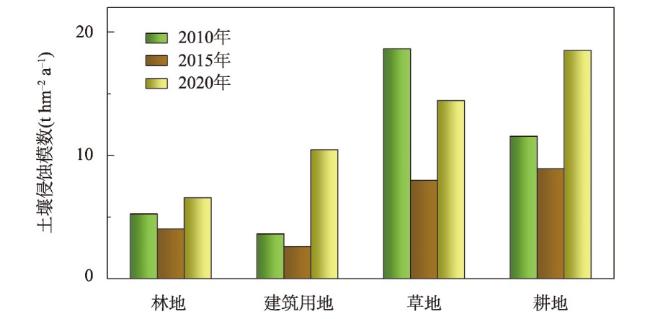
土壤侵蚀受土地利用、气候变化等多种因素的综合影响。王茂沟流域作为黄土高原丘陵沟壑区的典型治理小区,从20世纪开始实行了退耕还林等一系列水土保持措施。本文基于CSLE模型评估流域内2010年、2015年和2020年土壤侵蚀强度及时空演变特征,并结合土地利用/覆被变化(LUCC)探究不同时段其土地利用空间分布格局与土壤侵蚀的响应规律,以此验证水土保持成效。结果表明:2010—2020年王茂沟流域年均土壤侵蚀模数下降0.11 t hm-2 a-1,整体土壤侵蚀状况略有改善,但微度侵蚀占比减少5.56%,极强烈侵蚀增加4.02%,侵蚀严重区域主要分布在流域北部、中部及西北部;由于降雨减少以及植被恢复,2015年流域土壤侵蚀状况较2010年得到极大缓解,而极端降雨的发生和植被覆盖质量下降又使得2020年土壤侵蚀模数出现回弹;2010—2020年间流域北部及东北部草地与耕地间转化极为明显,草地质量下降致使其土壤侵蚀模数均值较耕地更大,分别为13.69 t hm-2 a-1与12.99 t hm-2 a-1。研究成果有助于厘清黄土高原典型小流域土壤侵蚀与极端气候和土地利用变化间的响应关系,为未来提高水土保持效益与降低水土流失风险提供科学的数据支持。
石学瑾 , 张彪 , 郭家龙 , 冯浩 , 吴淑芳 . 黄土高原典型小流域土壤侵蚀时空演变[J]. 地理学报, 2024 , 79(7) : 1787 -1803 . DOI: 10.11821/dlxb202407010
Soil erosion is influenced by various factors, such as land use and climate change. The Wangmaogou watershed, as a typical area for soil and water conservation in the hilly and gully regions of the Loess Plateau, has implemented a series of measures since the 20th century, including the Grain for Green Project. This study evaluated the spatial and temporal evolution characteristics of soil erosion intensity in the watershed in the years of 2010, 2015, and 2020 using the CSLE model. It also studied the situation of land use/cover change (LUCC) to analyze the spatial distribution patterns of land use and the responses of soil erosion in different time periods, thereby verifying the effectiveness of the soil and water conservation measures. The results revealed that from 2010 to 2020, the annual average soil erosion modulus in the study area decreased by 0.11 t hm-2 a-1, indicating a slight improvement in overall soil erosion conditions. However, the proportion of slight erosion decreased by 5.56%, while severe erosion increased by 4.02%, with the higher erosion zone mainly distributed in the northern, central, and northwestern parts of the watershed. Compared to the year 2010, soil erosion conditions in the watershed were greatly relieved in 2015 due to the decrease of rainfall and restoration of vegetation, but rebounded in 2020 resulting from the extreme rainfall events and declining vegetation cover quality. From 2010 to 2020, there were significant conversions between grassland and farmland in the northern and northeastern parts of the watershed. The decline in grassland quality resulted in a higher average soil erosion modulus compared to farmland, at 13.69 t hm-2 a-1 and 12.99 t hm-2 a-1, respectively. This study would contribute to figuring out the relationship between soil erosion in typical small watersheds of the Loess Plateau, extreme climatic events, and land use changes, providing scientific data support for future efforts to improve soil and water conservation benefits and mitigate soil erosion risks.
Key words: soil erosion; CSLE model; LUCC; Loess Plateau
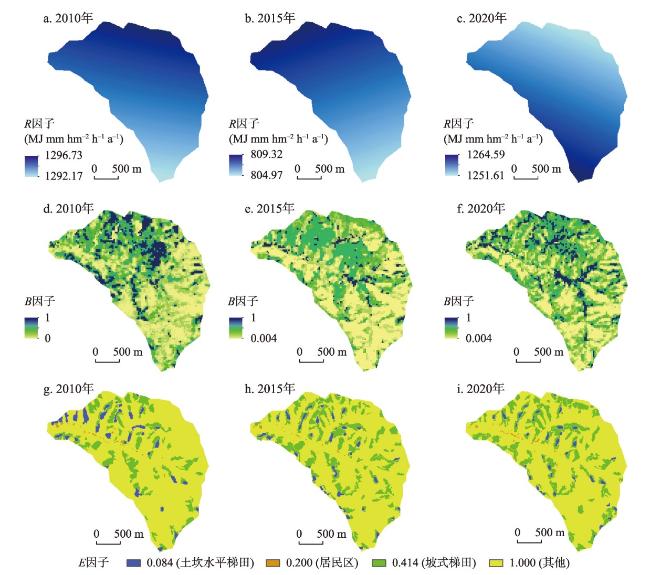
表1 不同土地利用类型和不同植被覆盖度组合下的B值Tab. 1 B value under different combinations of land use types and different vegetation cover |
| 不同植被覆盖度(%) | 林地 | 草地 | 建设用地 | 耕地 | 裸地 |
|---|---|---|---|---|---|
| 0~20 | 0.100 | 0.450 | 0.025 | 0.230 | 0.800 |
| 20~40 | 0.080 | 0.240 | |||
| 40~60 | 0.060 | 0.150 | |||
| 60~80 | 0.020 | 0.090 | |||
| 80~100 | 0.004 | 0.043 |
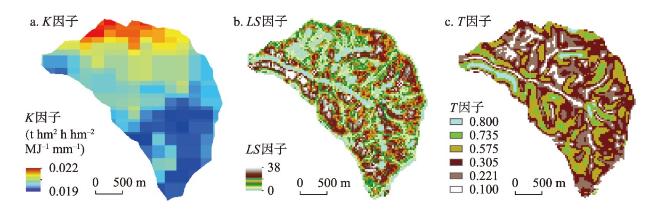
表2 不同坡度条件下的T值Tab. 2 T values under different slope conditions |
| 坡度分级(°) | ≤5 | 5~10 | 10~15 | 15~20 | 20~25 | >25 |
|---|---|---|---|---|---|---|
| T值 | 0.100 | 0.221 | 0.305 | 0.575 | 0.735 | 0.800 |
表3 王茂沟流域不同类型梯田面积变化Tab. 3 Variations in the area of different types of terraced fields in the Wangmaogou watershed |
| 梯田面积(hm2) | 2010年 | 2015年 | 2020年 |
|---|---|---|---|
| 土坎水平梯田 | 27.78 | 20.04 | 14.60 |
| 坡式梯田 | 85.04 | 121.43 | 123.32 |
| 总计 | 112.83 | 141.47 | 137.93 |
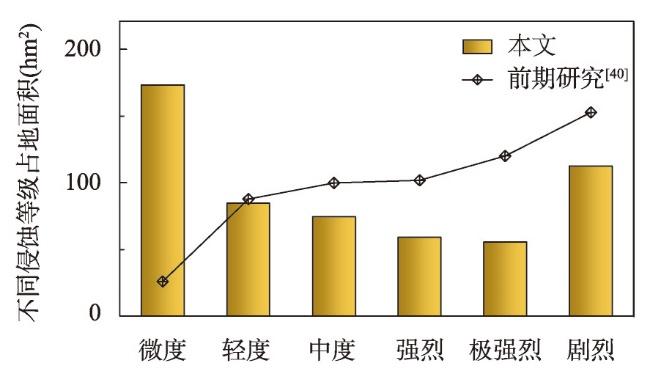
表4 2010—2020年王茂沟流域土壤侵蚀分级面积占比Tab. 4 Proportion of soil erosion classification area in the Wangmaogou watershed from 2010 to 2020 |
| 侵蚀等级 | 2010年 | 2015年 | 2020年 | |||||
|---|---|---|---|---|---|---|---|---|
| 面积(hm2) | 比例(%) | 面积(hm2) | 比例(%) | 面积(hm2) | 比例(%) | |||
| 微度 | 173.34 | 30.98 | 216.27 | 38.66 | 142.20 | 25.42 | ||
| 轻度 | 84.51 | 15.11 | 98.55 | 17.62 | 81.27 | 14.53 | ||
| 中度 | 74.52 | 13.32 | 90.00 | 16.09 | 76.86 | 13.74 | ||
| 强烈 | 58.95 | 10.54 | 46.44 | 8.30 | 57.87 | 10.34 | ||
| 极强烈 | 55.71 | 9.96 | 55.62 | 9.94 | 78.21 | 13.98 | ||
| 剧烈 | 112.41 | 20.09 | 52.56 | 9.40 | 123.03 | 21.99 | ||
| 总计 | 559.44 | 100.00 | 559.44 | 100.00 | 559.44 | 100.00 | ||
表5 2010—2020年王茂沟流域土壤侵蚀分级面积转移矩阵(hm2)Tab. 5 Transfer matrix of soil erosion classification area for the Wangmaogou watershed from 2010 to 2020 (hm2) |
| 侵蚀等级 | 微度 | 轻度 | 中度 | 强烈 | 极强烈 | 剧烈 | 2010年总计 |
|---|---|---|---|---|---|---|---|
| 微度 | 104.76 | 28.08 | 22.05 | 7.47 | 6.21 | 4.77 | 173.34 |
| 轻度 | 19.17 | 24.57 | 13.41 | 10.62 | 10.62 | 6.12 | 84.51 |
| 中度 | 11.34 | 11.34 | 17.55 | 10.08 | 13.86 | 10.35 | 74.52 |
| 强烈 | 3.42 | 10.35 | 9.45 | 11.07 | 9.72 | 14.94 | 58.95 |
| 极强烈 | 1.98 | 4.41 | 8.19 | 8.01 | 15.57 | 17.55 | 55.71 |
| 剧烈 | 1.53 | 2.52 | 6.21 | 10.62 | 22.23 | 69.30 | 112.41 |
| 2020年总计 | 142.20 | 81.27 | 76.86 | 57.87 | 78.21 | 123.03 | 559.44 |
注:主对角线元素代表各侵蚀等级中没有发生变化的面积。 |
表6 2010—2020年王茂沟流域各土地利用类型不同侵蚀等级面积(hm2)Tab. 6 Areas of different erosion classification for various land use types in the Wangmaogou watershed from 2010 to 2020 (hm2) |
| 侵蚀 等级 | 2010年 | 2015年 | 2020年 | |||||||||||
|---|---|---|---|---|---|---|---|---|---|---|---|---|---|---|
| 草地 | 林地 | 耕地 | 建设 用地 | 草地 | 林地 | 耕地 | 建设 用地 | 草地 | 林地 | 耕地 | 建设 用地 | |||
| 微度 | 49.23 | 113.13 | 1.35 | 3.33 | 32.85 | 152.90 | 28.26 | 2.25 | 51.21 | 82.35 | 4.68 | 3.96 | ||
| 轻度 | 27.99 | 54.09 | 0.90 | 1.26 | 28.98 | 51.03 | 18.27 | 0.27 | 35.64 | 40.23 | 3.60 | 1.80 | ||
| 中度 | 33.48 | 40.05 | 0.27 | 0.54 | 29.97 | 43.47 | 16.38 | 0.18 | 41.85 | 30.24 | 3.60 | 1.17 | ||
| 强烈 | 29.34 | 28.26 | 0.63 | 0.36 | 22.86 | 14.49 | 9.00 | 0.09 | 36.81 | 18.18 | 2.34 | 0.54 | ||
| 极强烈 | 36.00 | 18.54 | 0.18 | 0.09 | 25.56 | 13.23 | 16.65 | 0.18 | 53.46 | 19.26 | 4.77 | 0.72 | ||
| 剧烈 | 94.68 | 16.47 | 0.54 | 0.54 | 25.83 | 10.71 | 15.84 | 0.18 | 90.81 | 21.33 | 8.82 | 2.07 | ||
| [1] |
|
| [2] |
|
| [3] |
|
| [4] |
|
| [5] |
|
| [6] |
[陈朝良, 赵广举, 穆兴民, 等. 基于RUSLE模型的湟水流域土壤侵蚀时空变化. 水土保持学报, 2021, 35(4): 73-79.]
|
| [7] |
[刘文超, 刘纪远, 匡文慧. 陕北地区退耕还林还草工程土壤保护效应的时空特征. 地理学报, 2019, 74(9): 1835-1852.]
|
| [8] |
[张光辉. 植被恢复背景下土壤侵蚀研究需要加强的内容. 中国水土保持, 2020(9): 76-79.]
|
| [9] |
|
| [10] |
|
| [11] |
|
| [12] |
|
| [13] |
|
| [14] |
|
| [15] |
|
| [16] |
|
| [17] |
|
| [18] |
|
| [19] |
[汤秋鸿, 徐锡蒙, 贺莉, 等. 黄河中游生态水文模型及洪旱灾害风险评估. 地理学报, 2023, 78(7): 1666-1676.]
|
| [20] |
|
| [21] |
|
| [22] |
[朱青, 周自翔, 刘婷, 等. 黄土高原植被恢复与生态系统土壤保持服务价值增益研究: 以延河流域为例. 生态学报, 2021, 41(7): 2557-2570.]
|
| [23] |
[高海东, 刘晗, 贾莲莲, 等. 2000—2017年河龙区间输沙量锐减归因分析. 地理学报, 2019, 74(9): 1745-1757.]
|
| [24] |
[胡健, 胡金娇, 吕一河. 基于黄土高原关键带类型的土地利用与年径流产沙关系空间分异研究. 生态学报, 2021, 41(16): 6417-6429.]
|
| [25] |
[何佳瑛, 任立清, 蒋晓辉, 等. 延河流域土壤侵蚀对LUCC的响应及驱动力. 水土保持研究, 2022, 29(4): 184-191, 206.]
|
| [26] |
|
| [27] |
[李婷, 刘康, 马力阳, 等. 秦岭山地丹江流域土地利用变化的土壤侵蚀效应评价. 自然资源学报, 2016, 31(4): 583-595.]
|
| [28] |
[章文波, 谢云, 刘宝元. 中国降雨侵蚀力空间变化特征. 山地学报, 2003, 21(1): 33-40.]
|
| [29] |
|
| [30] |
|
| [31] |
[张岩, 袁建平, 刘宝元. 土壤侵蚀预报模型中的植被覆盖与管理因子研究进展. 应用生态学报, 2002, 13(8): 1033-1036.]
|
| [32] |
[江忠善, 王志强, 刘志. 黄土丘陵区小流域土壤侵蚀空间变化定量研究. 土壤侵蚀与水土保持学报, 1996, 2(1): 1-9.]
|
| [33] |
[冯强, 赵文武. USLE/RUSLE中植被覆盖与管理因子研究进展. 生态学报, 2014, 34(16): 4461-4472.]
|
| [34] |
[游松财, 李文卿. GIS支持下的土壤侵蚀量估算: 以江西省泰和县灌溪乡为例. 自然资源学报, 1999, 14(1): 62-68.]
|
| [35] |
[黄小芳, 林丽蓉, 高超, 等. CSLE模型中水土保持耕作措施因子研究进展. 中国水土保持科学(中英文), 2021, 19(5): 142-152.]
|
| [36] |
|
| [37] |
|
| [38] |
[冯俊鑫, 陈国坤, 左丽君, 等. 基于GF-6 WFV影像和CSLE模型的山区耕地侵蚀定量评价及特征分析. 农业工程学报, 2022, 38(21): 169-179.]
|
| [39] |
[余万洋, 赵龙山, 张劲松, 等. 黄河小浪底库区土壤侵蚀驱动因子定量归因分析. 水土保持学报, 2023, 37(3): 155-163, 171.]
|
| [40] |
[杨勤科. 陕西省50 m分辨率土壤侵蚀模数图(2010年). 地球系统科学数据共享平台: 黄土高原科学数据共享平台. 2014.]
|
| [41] |
[谢红霞, 李锐, 杨勤科, 等. 退耕还林(草)和降雨变化对延河流域土壤侵蚀的影响. 中国农业科学, 2009, 42(2): 569-576.]
|
| [42] |
[程琳, 杨勤科, 谢红霞, 等. 基于GIS和CSLE的陕西省土壤侵蚀定量评价方法研究. 水土保持学报, 2009, 23(5): 61-66.]
|
| [43] |
[李奎, 岳大鹏, 刘鹏, 等. 基于GIS与RUSLE的榆林市土壤侵蚀空间分布研究. 水土保持通报, 2014, 34(6): 172-178, 371.]
|
| [44] |
[刘立峰, 金绥庆, 付明胜, 等. 基于坝地泥沙淤积信息的流域侵蚀产沙特征研究. 山西水土保持科技, 2015(1): 10-13.]
|
| [45] |
|
| [46] |
|
| [47] |
|
| [48] |
|
| [49] |
|
| [50] |
|
| [51] |
|
| [52] |
|
| [53] |
|
| [54] |
|
| [55] |
|
| [56] |
[党维勤, 郝鲁东, 高健健, 等. 基于“7·26”暴雨洪水灾害的淤地坝作用分析与思考. 中国水利, 2019(8): 52-55.]
|
| [57] |
|
| [58] |
|
| [59] |
|
| [60] |
|
| [61] |
[王泽宇, 陈旭阳, 马彩诗, 等. 陕北榆林市退耕还林前后土壤侵蚀及生态服务价值变化. 西北林学院学报, 2021, 36(3): 59-67.]
|
| [62] |
|
| [63] |
|
| [64] |
[朱锐鹏, 刘殿君, 张世豪, 等. 黄土丘陵沟壑区不同土地利用类型水土流失效应. 水土保持研究, 2022, 29(4): 10-17.]
|
| [65] |
|
/
| 〈 |
|
〉 |
