土地利用/土地覆被变化与地表过程

北极地区热融湖分布特征及变化机制研究

  • 刘诗奇 , 1 ,
  • 王平 , 1, 2 ,
  • 于静洁 1, 2 ,
  • 蔡红艳 3 ,
  • 杨林生 2, 4 ,
  • 牟翠翠 5 ,
  • 刘昌明 1
展开
  • 1.中国科学院地理科学与资源研究所 中国科学院陆地水循环及地表过程重点实验室,北京 100101
  • 2.中国科学院大学,北京 100049
  • 3.中国科学院地理科学与资源研究所资源与环境信息系统国家重点实验室,北京 100101
  • 4.中国科学院地理科学与资源研究所 中国科学院陆地表层格局与模拟重点实验室,北京 100101
  • 5.兰州大学资源环境学院西部环境教育部重点实验室,兰州 730000
王平(1979-), 男, 安徽人, 研究员, 研究方向为水文水资源。E-mail:

刘诗奇(1990-), 女, 黑龙江人, 助理研究员, 中国地理学会会员(S110008059M), 研究方向为北极典型流域沉积环境及水碳循环。E-mail:

收稿日期: 2023-11-22

  修回日期: 2024-07-02

  网络出版日期: 2024-07-30

基金资助

国家自然科学基金项目(42371033)

国家自然科学基金中俄合作研究项目(42061134017)

国家科技基础资源调查专项课题(2022FY101900)

国家科技基础资源调查专项课题(2022FY101901)

Distribution charactieristics and change mechanisms of thermokarst lakes in the Arctic

  • LIU Shiqi , 1 ,
  • WANG Ping , 1, 2 ,
  • YU Jingjie 1, 2 ,
  • CAI Hongyan 3 ,
  • YANG Linsheng 2, 4 ,
  • MU Cuicui 5 ,
  • LIU Changming 1
Expand
  • 1. Key Laboratory of Water Cycle and Related Land Surface Processes, Institute of Geographic Sciences and Natural Resources Research, CAS, Beijing 100101, China
  • 2. University of Chinese Academy of Sciences, Beijing 100049, China
  • 3. State Key Laboratory of Resources and Environmental Information System, Institute of Geographic Sciences and Natural Resources Research, CAS, Beijing 100101, China
  • 4. Key Laboratory of Land Surface Pattern and Simulation, Institute of Geographic Sciences and Natural Resources Research, CAS, Beijing 100101, China
  • 5. Key Laboratory of Western China's Environmental Systems Ministry of Education, College of Earth and Environmental Sciences, Lanzhou University, Lanzhou 730000, China

Received date: 2023-11-22

  Revised date: 2024-07-02

  Online published: 2024-07-30

Supported by

National Natural Science Foundation of China(42371033)

National Natural Science Foundation of China-Russian Science Foundation(42061134017)

Science & Technology Fundamental Resources Investigation Program(2022FY101900)

Science & Technology Fundamental Resources Investigation Program(2022FY101901)

摘要

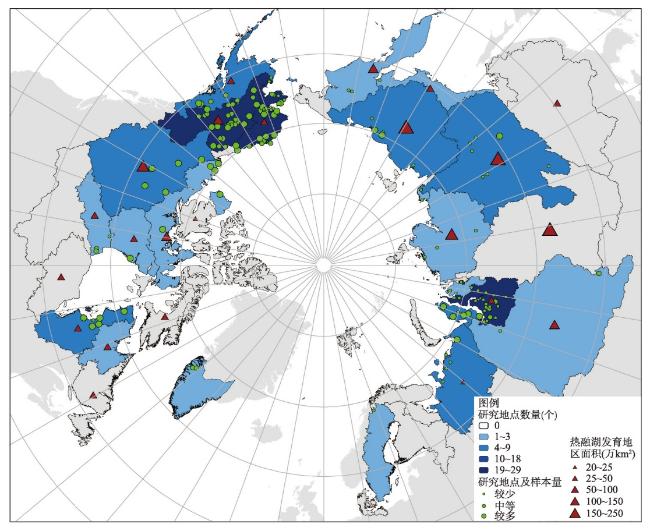
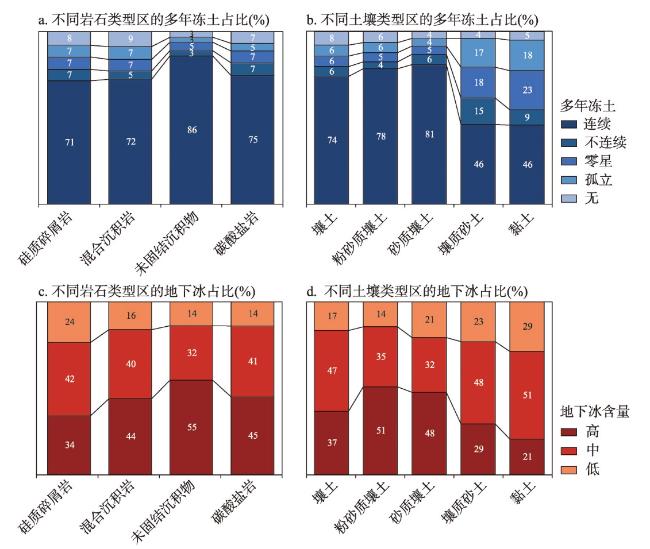
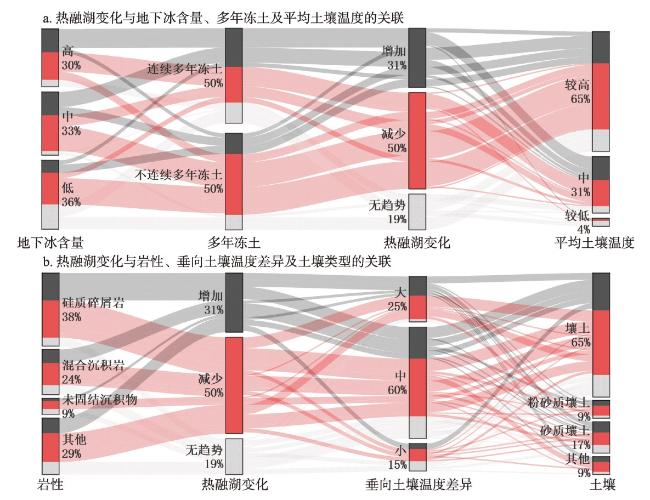
北极热融湖作为多年冻土区典型热喀斯特景观之一,其分布和变化规律深刻影响着区域的生态植被、水文和碳循环过程。然而,对于整个北极热融湖分布特征和变化机制的理解仍然不足,为此,本文基于荟萃分析和数理统计方法,对热融湖的分布规律和变化机制展开研究。结果表明,北极热融湖的分布和变化具有较强的时空异质性,且与多年冻土条件、岩石土壤类型、地下冰含量和土壤温度等密切相关。大部分北极热融湖分布在连续多年冻土区、地下冰含量高于10%、平均土壤温度在-4 ℃以上且存在一定垂向土壤温度差异的具有特定岩石和土壤类型的地区,而不同环境条件下的热融湖变化趋势存在差异。总体上,北极热融湖的变化过程包括初始形成、中期扩张和晚期萎缩三大阶段,且受到水量与水热平衡的双重影响。热融湖作为反映多年冻土退化和气候环境变化的重要指示,对北极生态系统碳循环、水文过程和生态环境变化等均具有深远影响。

本文引用格式

刘诗奇 , 王平 , 于静洁 , 蔡红艳 , 杨林生 , 牟翠翠 , 刘昌明 . 北极地区热融湖分布特征及变化机制研究[J]. 地理学报, 2024 , 79(7) : 1751 -1767 . DOI: 10.11821/dlxb202407008

Abstract

Thermokarst lakes, as prominent thermokarst landscapes in permafrost regions, significantly influence ecological vegetation, hydrological processes, and carbon cycling in the Arctic. However, the current understanding of the distribution characteristics and change mechanisms of Arctic thermokarst lakes remains limited. To address this gap, this study employs meta-analysis and mathematical statistical methods to investigate the distribution patterns and dynamics of thermokarst lakes. The results reveal a pronounced spatio-temporal heterogeneity in the distribution and changes of Arctic thermokarst lakes. These variations are closely associated with permafrost conditions, lithology, soil types, subterranean ice content, and soil temperatures. Most Arctic thermokarst lakes are located in continuous permafrost area, where subterranean ice content exceeds 10%, average soil temperatures are above -4°C, and there are specific vertical soil temperature gradients. The change trends of thermokarst lakes differ under various environmental conditions. Generally, the development of thermokarst lakes follows three stages: initial formation, mid-term expansion, and late-stage contraction, all influenced by hydrological and thermohydrological balances. As critical indicators of permafrost degradation and climatic environmental changes, thermokarst lakes profoundly impact carbon cycling, hydrological processes, and ecological environmental changes within the Arctic ecosystem.

1 引言

全球90%的多年冻土分布在极地地区[1]。伴随着全球气候变暖,北极地区多年冻土温度升高、活动层厚度增加、多年冻土不断退化[2-3],不仅引发了地表塌陷和热融湖等热喀斯特地貌的局地变化,还导致了诸如北冰洋淡水汇入量增加、大气碳排放增加、河流水文及碳循环过程变化等全球范围的显著改变[4-6]。全球气候模型(CCSM3)数据预测,到2100年北半球近地表多年冻土将迅速减少至100万 km2 [7-8],并促使热融湖大量发育[9]。2019年IPCC《气候变化中的海洋和冰冻圈特别报告》指出,在多年冻土退化、地下冰流失、冰川退缩等共同影响下,2100年约20%的北极多年冻土(RCP8.5)发生突然融化和地面沉降,并将导致包括热融湖在内的北极湖泊面积增加50%以上(中等信度)[10]
热融湖作为北极流域水文系统变化及多年冻土退化的重要体现[11-12],其数量、规模、分布及动态十分复杂[13],蒸发、降水、地质条件、径流特征、地貌景观及多年冻土退化等均能对热融湖产生显著影响[14-17],并引发一系列环境后果。一方面,北极多年冻土区的热融湖变化易引发下游洪水,如自1955年以来阿拉斯加北部地区已发生了18次此类洪水事件[18],而1951—2007年育空河流域Old Crow Flats的灾难性洪水频率增加了5倍多[13]。另一方面,热融湖作为温室气体排放的热点(Hotspot)[9,19],其释放的甲烷(CH4)和二氧化碳(CO2)会进一步加速气候变暖及多年冻土退化[20]。此外,热融湖作为多年冻土泥炭地(Peatland)泥炭丘湿地复合体(Palsas Mire Complex)的重要组成部分,其动态变化一定程度上反映了多年冻土对气候变化的响应[21]。因此,包括热融湖分布和变化特征在内的北极陆地环境变化,深刻影响着北极地区的水文、生态、地球化学过程、冻土工程设施及第一产业资源的可持续利用与开发[22-25]
近年来,尽管北极地区热融湖变化已引起学术界的广泛关注,但由于北极地区实地考察难度较大、观测数据稀缺、水文过程及变化机制复杂多变、研究对象和尺度存在差异,对热融湖分布特征、动态变化及机制的理解仍然存在不足[26-27],更难以量化其对气候变化响应以及对多年冻土退化、温室气体排放等的贡献。因此,北极热融湖的分布于变化机制研究仍有待进一步深入。本文在前人研究基础上,结合热融湖所在地区的多年冻土、岩石土壤类型、地下冰含量、土壤温度条件数据,在流域尺度上分析了北极热融湖的分布规律及其主要环境特征,对比了热融湖变化在不同环境条件下的差异,并揭示了北极热融湖变化的关键阶段和驱动要素,为深入了解全球变暖条件下的北极热融湖演化过程提供科学依据。

2 数据与方法

为解北极地区热融湖发育及分布特征,对北半球热融湖泊、多年冻土、岩性、土壤、地下冰、土壤温度等数据进行统计分析,并在ArcGIS软件环境下,对环北极不同热融湖覆盖度地区的上述本底条件进行叠置分析,探讨热融湖分布规律及主要环境特征。其中,热融湖数据来自于美国国家航空航天局(NASA)下属的Earthdata数据开放平台(https://daac.ornl.gov/cgi-bin/dsviewer.pl?ds_id=1332),该数据集提供了截至2015年北极多年冻土区各类热喀斯特地貌景观的分布及面积估算,并根据热融湖覆盖度(Landscape Coverage)将其划分为很高(60%~100%)、高(30%~60%)、中等(10%~30%)、低(1%~10%)和无(0~1%)5种类型[28]。北极多年冻土数据源于国家青藏高原科学数据中心的高分辨率北半球多年冻土数据集(2000—2016年)(http://data.tpdc.ac.cn/zh-hans/data/5093d9ff-a5fc-4f10-a53f-c01e7b781368/),空间分辨率1 km,并包含多年冻土活动层厚度(ALT,cm)数据,其中多年冻土可依据其空间发生概率(Probability,%)分为4种类型,包括连续(90%~100%)、不连续(50%~90%)、零散(10%~50%)、孤立(< 10%)多年冻土[29]。岩性数据来自PANGAEA数据库中Hartmann等的全球岩性地图(GLiM),空间分辨率0.5° [30]。土壤数据来源于全球30弧秒土壤数据集(Harmonized World Soil Database,HWSD version 1.2),选取0~30 cm表层土壤结构属划分土壤类型[31]。地下冰含量数据来自Brown等[32]的环北极多年冻土与地下冰数据集(第二版),并将地下冰含量划分为高(> 20%)、中(10%~20%)和低(< 10%)3种类型。不同深度的土壤温度数据(0~7 cm、7~28 cm、28~100 cm、100~289 cm)来自于ERA5-Land[33],并计算了4个不同深度的平均土壤温度和垂向土壤温度差异(最深与最浅层土壤温度差异)。北极地区的流域边界来自HydroSHEDS水文地理数据集中的3级(level 3)流域边界[34]

3 北极地区热融湖分布及环境特征

热喀斯特(Thermokarst)现象,是指由于富冰多年冻土或地下冰融化所导致的一系列特殊地貌的形成过程,并形成热融湖、热融滑塌、热融湿地等不同地貌[35]。其中,北极地区的热融湖更易形成在地形坡度小于1.88°的地区[36],其深度普遍介于几米至十余米之间,而在Yedoma多年冻土区,深度甚至可超过20 m[35,37]。热融湖的湖盆特征与其所在位置和成因密切相关,是地质条件和气候因素的综合作用结果。例如,北冰洋沿岸海相粉砂岩发育地区形成的热融湖通常具有水体较浅(约2 m)、水深相对均匀,且较少发育滨湖带(Littoral Shelve)的特征;相较之下,北极海岸平原内陆区的热融湖,由于受到风成砂岩的低含冰量影响,其平均水深更浅(约1 m),但湖盆中心水体可达3~5 m深,反映了深层融区(Talik)与滨—浅湖砂岩沉积作用的复杂影响[38]。因此,深入剖析热融湖的分布规律及环境特征,对于理解气候变化条件下的寒区水热平衡和水文动态变化的复杂机理过程十分重要。

3.1 北极地区热融湖分布特征

北极热融湖(Thermokarst Lake/Pond)作为典型的热喀斯特地貌,广泛分布在美国阿拉斯加[22,39]、加拿大[16,40]、俄罗斯西伯利亚[41-43]及亚欧大陆北部[44]等地区(图1)。整体上,北极热融湖总面积约1.3×106 km2 [28],约占多年冻土区的7.1%[45],但受局地条件影响,不同地区的热融湖发育面积和覆盖程度存在显著差异。
图1 北极地区热融湖分布特征

Fig. 1 Distribution characteristics of thermokarst lakes in the Arctic

从流域尺度来看,北极大河流域热融湖发育地区的区域总面积较大,其中最为典型的包括勒拿河、俄罗斯远东主要河流(雅纳河、因迪吉尔卡河、阿拉泽亚河、科雷马河及帕里亚瓦姆河等)、叶尼塞河、麦肯锡河、拉普捷夫海沿岸Yedoma发育地带主要河流(雅西纳河、哈坦加河、波皮盖河和奥列内克河)、育空河、鄂毕河、堪察加半岛和北极海—哈德逊湾地区主要河流(科珀曼河、巴克河、埃利斯河和海斯河)等流域(表1),这些流域热融湖发育地区的区域总面积均超过50万km2,占流域总面积的80%以上(除麦肯锡河75%、叶尼塞河62%和鄂毕河21%)。在上述大河流域中,尽管热融湖发育地区的区域总面积较大,但绝大部分热融湖发育地区属于中等、低或无热融湖发育地区,即热融湖覆盖度小于30%。即便对于勒拿河、俄罗斯远东河流、麦肯锡河和拉普捷夫海沿岸Yedoma流域等地区,热融湖覆盖度很高和高的地区范围较大(17.4万~34.7万km2),但其在流域总面积中的占比仍然很小,仅为8%~22%。
表1 北极典型流域/地区的热融湖发育面积

Tab. 1 Development area of thermokarst lake development regions in typical Arctic river basins/areas

序号 流域/地区 不同覆盖度热融湖发育地区面积(万km2) 热融湖发育地区
名称 总面积
(万km2)
很高 中等 总面积
(万km2)
占比(%)
1 勒拿河 246.77 10.52 9.78 0.37 15.82 209.98 246.48 99.88
2 俄罗斯远东主要河流 162.52 34.16 0.50 3.08 6.79 116.60 161.14 99.15
3 西西伯利亚平原北部河流 44.03 17.16 6.27 8.15 5.99 6.07 43.64 99.12
4 育空河 83.82 1.96 2.35 0.84 13.44 64.39 82.97 98.99
5 拉普捷夫海沿岸主要河流 114.58 16.25 1.67 12.7 9.12 73.45 113.23 98.82
6 北极海—哈德逊湾地区
主要河流
55.21 2.41 0 5.02 0.03 46.42 53.88 97.60
7 加拿大西北部 15.56 6.43 0.89 5.38 1.95 0.45 15.10 97.06
8 俄罗斯亚马尔半岛 11.81 10.86 0 0.12 0.00 0.42 11.39 96.47
9 新西伯利亚群岛 3.87 1.53 0 1.28 0.00 0.58 3.39 87.68
10 堪察加半岛 75.52 5.87 0.07 1.55 2.65 50.05 60.19 79.70
11 麦肯锡河 180.59 5.39 12.02 2.83 33.72 81.77 135.73 75.16
12 叶尼塞河 251.82 2.22 0.59 1.29 7.78 144.48 156.36 62.09
13 鄂毕河 310.32 1.75 0.45 0.88 5.61 54.94 63.63 20.50
此外,北极地区部分流域尽管总面积较小,但热融湖发育程度却较高,如俄罗斯亚马尔半岛、西西伯利亚平原北部河流(纳德姆河、普尔河、塔兹河)等(图1)。亚马尔半岛为热融湖发育地区的区域总面积约11.4万km2,占流域总面积的96%,且几乎全部为热融湖覆盖度很高和高的地区。此外,加拿大西北部(安德森河、霍顿河、霍纳戴河)和新西伯利亚群岛也是热融湖相对较为发育的地区,热融湖发育地区的区域总面积分别占流域整体的97%和88%,其中将近一半为热融湖覆盖度很高和高的地区。
当前有关热融湖面积演变的研究多集中在北美育空河流域、阿拉斯加州北部地区(科尔维尔河、诺阿塔克河、科布克河),以及俄罗斯亚马尔—涅涅茨自治区等地[46]。然而,受限于偏远的地理位置和较为恶劣的气候条件,对加拿大北部的哈德逊湾沿岸平原、加拿大北极群岛(尤其是巴芬岛、维多利亚岛和伊丽莎白女王群岛)以及俄罗斯新西伯利亚群岛、楚科奇半岛和新地岛等地区热融湖的相关研究仍面临诸多挑战,相关研究成果相对匮乏。因此,深入研究北极地区热融湖,需更多地结合遥感技术、实地考察及区域环境分析,以揭示其分布特征和对气候变化的响应机制。

3.2 北极热融湖分布地区的主要环境特征

通过分析北极热融湖所在区域的主要环境特征,发现绝大部分热融湖(约占总面积的91%)分布在连续多年冻土区(图2a),但不同热融湖分布地区的岩石土壤类型、地下冰含量和土壤温度等条件方面存在显著差异(表2)。
图2 北极热融湖覆盖地区的主要多年冻土类型[29]、岩性[30]、土壤[31]、土壤温度[33]及地下冰含量[32]特征

Fig. 2 Characteristics of permafrost[29], lithology[30], soil[31], soil temperature[33] and ground ice content[32] in the thermokarst lake developed area

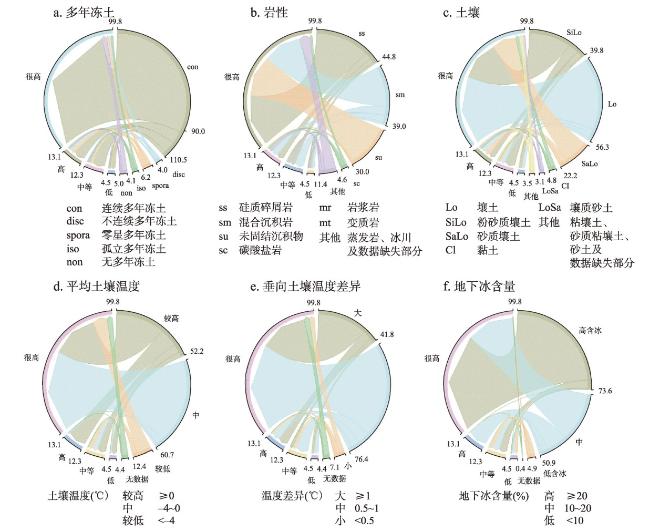
表2 不同多年冻土类型、岩性、土壤类型、土壤温度及地下冰含量条件下的北极热融湖面积

Tab. 2 The area of Arctic thermokarst lake under different permafrost, lithology, soil, soil temperature and ground ice content conditions

序号 参数 类别 热融湖面积(万 km²) 占比(%)
1 多年冻土类型 连续多年冻土 11052.20 85.16
2 不连续多年冻土 398.53 3.07
3 零星多年冻土 618.85 4.77
4 孤立多年冻土 405.63 3.13
5 无多年冻土 502.71 3.87
6 岩性 硅质碎屑岩 4477.63 34.50
7 混合沉积岩 3901.48 30.06
8 未固结沉积物 2999.26 23.11
9 碳酸盐岩 457.31 3.52
10 岩浆岩 437.16 3.37
11 变质岩 241.70 1.86
12 蒸发岩、冰川及数据缺失部分 463.39 3.57
13 土壤类型 壤土 5630.82 43.39
14 粉砂质壤土 3982.00 30.68
15 砂质壤土 2216.91 17.08
16 黏土 484.51 3.73
17 壤质砂土 311.30 2.40
18 粘壤土、砂质粘壤土、砂土及数据缺失部分 352.38 2.72
19 平均土壤温度 较低 1241.70 9.57
20 6073.65 46.80
21 较高 5219.04 40.21
22 无数据 443.54 3.42
23 垂向土壤温度差异 4180.06 32.21
24 7642.32 58.89
25 712.00 5.49
26 无数据 443.54 3.42
27 地下冰含量 7363.45 56.74
28 5088.18 39.21
29 488.09 3.76
30 无数据 38.21 0.29
其中,分布在硅质碎屑岩、混合沉积岩和未固结沉积物地区的热融湖,其面积约占热融湖总面积的88%(图2b)。在土壤类型方面,近91%面积的热融湖位于表层土壤(0~30 cm)为壤土、粉砂质壤土和砂质壤土的地区(图2c)。此外,热融湖的分布也随着土壤温度条件变化存在差异。北极热融湖分布地区的平均表层土壤温度介于-21.7~6.5 ℃之间,但超过80%的热融湖分布面积集中在平均表层土壤温度高于-4 ℃的地区。值得注意的是,分布在土壤温度-4~0 ℃的热融湖面积略高于土壤温度0 ℃以上地区(图2d),指示着热融湖分布与土壤温度条件的非线性响应关系。同时,近60%面积的热融湖所在地区呈现出0.5~1 ℃的垂向土壤温度差异,而近1/3的热融湖位于垂向土壤温度差异超过1 ℃的地区(图2e)。除此之外,超过一半(约57%)面积的热融湖分布在高地下冰含量地区,而分布在地下冰含量10%~20%地区热融湖的面积占比近40%(图2f)。整体上,地下冰含量较低、土壤温度较低或垂向土壤温度差异较小的地区热融湖分布相对较少(表3)。
表3 北极热融湖地区的主要多年冻土类型、岩性、土壤及地下冰条件特征

Tab. 3 Characteristics of permafrost, lithology, soil and ground ice conditions in the Arctic thermokarst lake developed area

序号 多年冻土类型 岩石类型 土壤类型 地下冰含量 土壤平均
温度(℃)
垂向土壤
温差(℃)
热融湖
覆盖度
热融湖地区区域
面积(106 hm2)
累计占比(%)
1 连续多年冻土 未固结沉积物 壤土 -4~0 > 1 很高 6.12 4.72
2 连续多年冻土 硅质碎屑岩 壤土 -4~0 0.5~1 很高 5.31 8.80
3 连续多年冻土 硅质碎屑岩 壤土 -4~0 0.5~1 很高 4.53 12.29
4 连续多年冻土 未固结沉积物 壤土 -4~0 0.5~1 很高 3.63 15.09
5 连续多年冻土 硅质碎屑岩 粉砂质壤土 -4~0 0.5~1 很高 3.07 17.46
6 连续多年冻土 混合沉积岩 粉砂质壤土 -4~0 >1 很高 2.82 19.63
7 连续多年冻土 混合沉积岩 壤土 -4~0 0.5~1 很高 2.65 21.67
8 连续多年冻土 硅质碎屑岩 砂质壤土 > 0 > 1 很高 2.48 23.58
9 连续多年冻土 混合沉积岩 砂质壤土 -4~0 0.5~1 很高 2.24 25.31
10 硅质碎屑岩 壤土 >0 0.5~1 很高 1.86 26.74
11 连续多年冻土 未固结沉积物 粉砂质壤土 -4~0 0.5~1 很高 1.85 28.17
12 连续多年冻土 混合沉积岩 粉砂质壤土 > 0 > 1 很高 1.76 29.52
13 连续多年冻土 未固结沉积物 壤土 > 0 0.5~1 很高 1.73 30.85
14 连续多年冻土 未固结沉积物 粉砂质壤土 -4~0 > 1 很高 1.71 32.17
15 连续多年冻土 混合沉积岩 粉砂质壤土 -4~0 0.5~1 很高 1.63 33.43
16 连续多年冻土 硅质碎屑岩 壤土 -4~0 > 1 很高 1.61 34.67
17 连续多年冻土 混合沉积岩 粉砂质壤土 -4~0 0.5~1 很高 1.56 35.87
18 连续多年冻土 硅质碎屑岩 壤土 > 0 0.5~1 很高 1.46 37.00
19 连续多年冻土 未固结沉积物 砂质壤土 < -4 0.5~1 很高 1.45 38.12
20 连续多年冻土 未固结沉积物 壤土 < -4 0.5~1 很高 1.39 39.19
21
连续多年冻土 混合沉积岩 粉砂质壤土 <-4 0.5~1 1.32 40.20
22 连续多年冻土 混合沉积岩 粉砂质壤土 >0 0.5~1 很高 1.31 41.22
23 连续多年冻土 混合沉积岩 砂质壤土 -4~0 > 1 很高 1.31 42.23
24 连续多年冻土 未固结沉积物 砂质壤土 -4~0 0.5~1 很高 1.30 43.23
25 连续多年冻土 混合沉积岩 壤土 > 0 0.5~1 很高 1.21 44.16
26 连续多年冻土 硅质碎屑岩 砂质壤土 > 0 > 1 1.17 45.07
27 连续多年冻土 硅质碎屑岩 粉砂质壤土 -4~0 0.5~1 很高 1.11 45.92
28 连续多年冻土 硅质碎屑岩 壤土 -4~0 > 1 很高 1.09 46.76
29 连续多年冻土 混合沉积岩 壤土 -4~0 0.5~1 很高 1.03 47.56
30 连续多年冻土 混合沉积岩 壤土 -4~0 > 1 很高 0.97 48.31
31 连续多年冻土 未固结沉积物 砂质壤土 -4~0 > 1 很高 0.88 48.99
32 连续多年冻土 混合沉积岩 粉砂质壤土 -4~0 0.5~1 0.85 49.64
33 连续多年冻土 混合沉积岩 粉砂质壤土 > 0 0.5~1 很高 0.84 50.29

注:土壤平均温度和垂向温差均基于0~7 cm、7~28 cm、28~100 cm和100~289 cm 4层土壤温度数据计算获取。

岩石和土壤类型也会一定程度上影响热融湖分布地区的地下冰含量和多年冻土特征。例如,相比于其他岩性,未固结沉积物的比热容和含水率通常较高[47],可能导致在相同的水热条件下,这些地区的地下冰含量和连续多年冻土比例可能更高(图3a、3c)。同时,不同土壤类型中的液态水含量及其冻结过程差异[48],可能是导致壤土、粉砂质壤土和砂质壤土地区连续多年冻土比例较高且地下冰含量不同的关键因素(图3b、3d)。此外,岩石和土壤类型的变化,作为气候、地貌和植被等环境要素综合作用的结果,其指示的环境条件差异也会影响热融湖的分布规律。例如,在勒拿河三角洲地区,西部的现代河漫滩地带热融湖较多,20 hm2以上热融湖数量约占全区的67%,而在细粒和富冰沉积物发育的三角洲沿岸及南部地区,大面积的热融湖较少[49],尤其是在Yedoma发育地区,热融湖覆盖度低于其他地区(约5.2%)[50]。因此,岩性和土壤类型通过其物理性质如渗透性、导热率、保水能力和比热容等的差异,间接影响区域地下冰含量和多年冻土的特征,进而作用于热融湖的形成与分布。
图3 北极热融湖发育地区不同岩石、土壤类型地区的多年冻土与地下冰占比特征

Fig. 3 The proportion of different permafrost types and ground ice content in the Arctic thermokarst lake developed area under different rock and soil types

4 热融湖的变化规律与机制

北极多年冻土区的热融湖最初多形成于末次冰期之后,即晚更新世末期至全新世期间,并在中全新世大暖期的鼎盛阶段(Holocene Thermal Maximum)达到顶峰[51-52]。在当前复杂的北极区域背景下,伴随着全球气候波动,热融湖的规模、数量及分布规律均发生明显变化,且具有显著的时空异质性。基于Webb等对139个热融湖变化地点的研究[46],本文进一步综合热融湖分布地区的多年冻土特征、岩石土壤类型、地下冰含量及土壤温度条件等因素,探讨当前北极热融湖变化的主要规律和环境特征,并分析导致热融湖形成与演化的关键机制,为理解北极热融湖演化提供新的视角。

4.1 北极热融湖的变化规律及环境特征

北极地区的热融湖变化包括新增、扩张、萎缩和干涸等多种形式,不同发展阶段的热融湖可在同一地理区域共存,并在较大的地理范围内表现为区域内热融湖面积或数量的整体增减。具体而言,俄罗斯中央雅库特地区作为北极热融湖面积增加的代表性区域[53-58],其热融湖面积在1999—2014年间增加了48.5%[59];同时,包括巴芬岛等在内的加拿大努纳武特地区[60]、科雷马河低地[43],以及加拿大西北部图克托亚图克半岛[15-16]等地区热融湖面积也以增加为主。与之相反,在北美阿拉斯加地区[14,39,61 -62]、俄罗斯西西伯利亚低地[56]和亚马尔苔原[63]等地区,热融湖面积主要呈减少趋势。
进一步研究表明,不同环境下的北极热融湖变化具有一定规律性特征,以多年冻土条件为例,约85%的北极干涸热融湖位于连续多年冻土边界200 km范围内[44]。此外,对于整个北极地区而言,热融湖在连续和不连续多年冻土区也呈现出显著不同的变化趋势,即位于不连续多年冻土区的大部分(63%)热融湖面积呈缩小趋势,而在连续多年冻土区,面积增加(40%)和减少(38%)的热融湖数量大体持平[46]。值得注意的是,这种热融湖变化规律在较大时空范围内更为普遍,而在某些特定时期或地区,热融湖的变化可能更为复杂,甚至呈现出相反的趋势。例如,在加拿大连续多年冻土区,面积增加的热融湖略多于面积减少的,而在不连续多年冻土区,大多数热融湖(63%)的面积呈现出增加趋势(表4)。另外,从时间维度上看,1990年之后,北极连续多年冻土区大部分热融湖(60%)面积呈减少趋势;然而,若将时间范围扩展至1990年之前,则面积增加(46%)的热融湖数量超过了面积减少(30%)的数量(表5)。
表4 不同地区连续与不连续多年冻土区热融湖变化趋势差异

Tab. 4 The differences of thermokarst lake change trends across continuous and discontinuous permafrost areas in different regions

国家/地区 多年冻土类型 热融湖变化趋势 研究站点数量(个) 研究站点数量占比(%)
阿拉斯加 连续多年冻土 减少 6 31.58
无趋势 6 31.58
增加 7 36.84
不连续多年冻土 减少 27 69.23
无趋势 6 15.38
增加 6 15.38
加拿大 连续多年冻土 减少 6 40.00
无趋势 2 13.33
增加 7 46.67
不连续多年冻土 减少 1 12.50
无趋势 2 25.00
增加 5 62.50
俄罗斯 连续多年冻土 减少 13 38.24
无趋势 7 20.59
增加 14 41.18
不连续多年冻土 减少 15 68.18
无趋势 3 13.64
增加 4 18.18
格陵兰 连续多年冻土 减少 1 100
不连续多年冻土 减少 1 100
连续多年冻土 增加 0 0
不连续多年冻土 增加 0 0
表5 不同研究时间范围的连续与不连续多年冻土区热融湖变化趋势差异

Tab. 5 The differences in thermokarst lakes change trends across continuous and discontinuous permafrost areas during different study periods

多年冻土类型
研究时段的起始年份 热融湖变化趋势 研究站点数量(个) 研究站点数量占比(%)
连续多年冻土 早于1990年 减少 17 31.48
无趋势 12 22.22
增加 25 46.30
晚于1990年 减少 9 60.00
无趋势 3 20.00
增加 3 20.00
不连续多年冻土 早于1990年 减少 35 62.50
无趋势 7 12.50
增加 14 25.00
晚于1990年 减少 9 64.29
无趋势 4 28.57
增加 1 7.14
此外,北极热融湖的变化规律也会在不同岩石土壤类型、地下冰含量以及土壤温度条件下存在一定差异。具体而言,大多数面积增加的热融湖出现在中、高地下冰含量地区,而无明显变化趋势的热融湖主要分布在地下冰含量较低的地区;与此同时,当平均土壤温度较低时(≤ -4 ℃),面积发生变化的热融湖数量相对较少;在平均土壤温度处于中等水平(-4~0 ℃)的地区,面积发生变化的热融湖数量明显增加,并且面积增加与减少的热融湖数量大致相当;而在平均土壤温度较高(> 0 ℃)的情况下,面积减少的热融湖数量则明显多于面积增加的热融湖(图4a)。除此之外,当垂向土壤温度差异超过1.0 ℃时,热融湖面积的增加与减少占比大致相当;而在0.5~1.0 ℃的垂向土壤温度差异条件下,面积减少的热融湖占比更高;同时,热融湖变化在不同岩石土壤类型地区直接也有所不同,在未固结沉积物较为发育的地区,热融湖面积增加的情况相对较少,而就土壤类型而言,大多数热融湖的面积变化集中在壤土区域(图4b)。
图4 北极热融面积变化的环境要素特征

注:热融湖变化数据来源自Webb和Liljedahl[46]

Fig. 4 Characteristics of environmental factors in the area changes of Arctic thermokarst lake

4.2 北极热融湖的主要发展阶段与关键机制

整体而言,北极热融湖的发育可分为初始形成、中期扩张和晚期干涸3个阶段。其中,促使热融湖形成的关键驱动要素因其发育环境不同而存在一定差异(图5a)。例如,广泛分布于苔原或北方低地的热融湖[43,64 -66],其形成过程通常与富冰多年冻土退化及厚层地下冰融化所导致的地面沉降、塌陷和排水量增加有关[26,67 -69]。然而,对于冰川较为发育的多年冻土区而言,热融湖的形成还与冰川冰和沉积物内冰的融化密切相关[70],对于地下冰楔发育等地区,当地表存在如森林火灾或暴雨引起的植被破坏,以及上覆泥炭层破裂导致的冰楔出露等能量扰动时,也会进一步促使热融湖的形成和发育[71]。此外,对于多年冻土不发育的地区,当其地下水位较浅且广泛分布渗透率较低的泥炭地时,也可能导致形成热融湖(例如西伯利亚西部部分地区)[44]
图5 热融湖演化过程及关键过程示意图

Fig. 5 Schematic diagram of the evolution and key processes of thermokarst lakes

在随后的扩张和干涸阶段,热融湖的湖盆形态和水热条件均发生显著变化(图5b~5c)。以勒拿河三角洲苔原低洼地带的热融湖为例[50],在早期苔原多边形发展成为热融湖后,进入中期扩张期,进一步在横向和纵向上持续扩张并在热融湖底部发生沉积作用,该阶段的热融湖下方易形成深层融区,直至湖盆底部含冰复合沉积物(Ice Complex Deposits)完全融化时,热融湖开始仅发生横向上的扩张;在此之后,受地表水渗漏等作用的影响,热融湖面积缩小、水体变浅并进入晚期干涸阶段,该阶段常伴随部分出露湖底沉积物和融区的再次冻结,并在湖盆下方形成更为复杂的含冰复合体。
热融湖的发展受气候变化、多年冻土条件、水文过程、地形地貌以及土地覆盖状况等多种因素的综合影响[72-74]。总体上,这些因素主要通过水量和水热两大驱动机制对热融湖产生影响。就水量而言,气候变化通过改变降水、蒸发、径流以及积雪/多年冻土融水等水文要素,在局地尺度上直接影响着热融湖的变化趋势。例如,2002—2015年格陵兰岛西南部地区由于蒸发量增加,使得康埃卢苏阿克附近的局地热融湖总面积整体呈减小趋势,而在西西缪特海岸附近,受局地降水量显著增加的影响,热融湖面积反而呈增加趋势[75];尽管降水对热融湖变化的影响存在一定时滞效应[16],但整体上高降水量年份通常伴随着热融湖的显著扩张[64];此外,一定量的积雪融水也会促进热融湖的扩张,但过量的融水则可能引起热融湖的快速排水和萎缩[76]。在水热条件方面,冻融过程是引起北极热融湖变化的关键因素,多年冻土的初期融化往往伴随着热融湖面积的增加,而持续的升温则会导致进一步的融化,最终使热融湖面积减少[46]。一方面,热侵蚀和物理侵蚀作用会促使热融湖扩大并与相邻水体合并,形成更大的热融湖,尤其是在冰川发育的多年冻土区[70]。另一方面,异常温暖的年份加剧了热侵蚀作用,导致热融湖频繁排水,从而减少热融湖水量[39,77]。值得注意的是,随着多年冻土退化,尤其是当热融湖下方深层融区穿透多年冻土层时[78],热融湖更易因地下水渗漏而发生萎缩甚至完全干涸(图5c)。因此,热融湖的动态变化与其发育阶段、深层融区形成程度、浅层含水层渗透性、冻融状态等因素紧密相关[44,79]。这一热融湖萎缩的关键机制已经通过地球物理勘测方法(如探地雷达(GPR)和直流电阻率法(DC))在阿拉斯加部分不连续多年冻土区域的热融湖研究中得到了证实[78-79]。除此之外,近年来北极地区频繁发生的极端高温和极端降水事件也是影响热融湖变化的关键性因素之一,并通过加剧热侵蚀作用和改变水量而引起热融湖的突发性排水事件,进而改变热融湖的规模和数量[76,80]。这些北极气候及陆地环境的变化均会影响北极地区的可持续发展[25,81 -82]。因此,鉴于热融湖的变化和发展过程极为复杂,其影响因素和作用机制在特定时空范围乃至整个北极地区都存在差异,因此需要通过进一步的观测和模拟分析来加深理解,为气候及陆地环境变化下的北极地区可持续发展提供更多科学依据。

5 结论与展望

在全球增温的背景下,北极的热融湖分布表现出显著的时空异质性。其中,在勒拿河、叶尼塞河和麦肯锡河等大河流域,热融湖分布地区的总面积较广,但覆盖度却相对较低;相反,在俄罗斯亚马尔半岛和西西伯利亚平原北部等地,尽管热融湖的分布面积较小,但覆盖度却较高。受限于偏远的地理位置和较为恶劣的气候条件,对热融湖进行大范围野外考察存在较高难度,而卫星遥感技术分辨率有限,因此对于部分北极地区的热融湖相关研究仍相对匮乏。
通过研究北极热融湖分布地区的环境特征,发现热融湖的分布和变化与多年冻土条件、岩石土壤类型、地下冰含量和土壤温度等密切相关。具体来说,北极热融湖主要分布在连续多年冻土地区、地下冰含量超过10%的地区,以及平均土壤温度高于-4 ℃且存在一定垂向土壤温度差异的环境中,而不同环境条件下的热融湖变化趋势也有所不同。鉴于北极热融湖的分布和变化机制极其复杂,关于热融湖变化的季节性特征、不同生态位的热融湖变化其主控要素差异、极端气候对热融湖的影响,以及气候变化条件下环境要素与热融湖水文过程的互馈关系的研究与模拟,将是未来热融湖研究的关键所在。
此外,北极热融湖的变化过程包括初始形成、中期扩张和晚期萎缩三大阶段,且受到水量与水热平衡的双重影响,不同发展阶段的热融湖可交替存在并相互影响。然而,如何将局地尺度的热融湖演化过程应用于更大范围的热融湖变化机制研究,并进一步量化热融湖变化在多年冻土退化、深层融区演化、温室气体排放和生态系统稳定性等方面的作用,仍然是热融湖研究中的重点和难点问题。

感谢中国科学院地理科学与资源研究所李全文博士、研究生王文奇,以及郑州大学研究生崔梦珠在数据处理与制图方面提供的帮助,特别感谢两位匿名审稿人对本文的修改与完善所给予的宝贵建议。

[1]
Xiao Cunde, Su Bo, Dou Tingfeng, et al. Interpretation of lPCC SROCC on polar system changes and their impacts and adaptations. Climate Change Research, 2020, 16(2): 153-162.

[效存德, 苏勃, 窦挺峰, 等. 极地系统变化及其影响与适应新认识. 气候变化研究进展, 2020, 16(2): 153-162.]

[2]
Grosse G, Goetz S, McGuire A D, et al. Changing permafrost in a warming world and feedbacks to the Earth system. Environmental Research Letters, 2016, 11(4): 040201. DOI: 10.1088/1748-9326/11/4/040201.

[3]
Biskaborn B K, Smith S L, Noetzli J, et al. Permafrost is warming at a global scale. Nature Communications, 2019, 10(1): 264. DOI: 10.1038/s41467-018-08240-4.

[4]
Lim A G, Loiko S V, Kuzmina D M, et al. Dispersed ground ice of permafrost peatlands: Potential unaccounted carbon, nutrient and metal sources. Chemosphere, 2021, 266: 128953. DOI: 10.1016/j.chemosphere.2020.128953.

[5]
Wang Ping, Huang Qiwei, Liu Shiqi, et al. Arctic runoff changes and their driving mechanisms under rapid warming: A review. Acta Geographica Sinica, 2023, 78(11): 2718-2734.

DOI

[王平, 黄其威, 刘诗奇, 等. 快速升温下的北极径流变化及其驱动机制综述. 地理学报, 2023, 78(11): 2718-2734.]

DOI

[6]
Liu S Q, Wang P, Huang Q W, et al. Seasonal and spatial variations in riverine DOC exports in permafrost-dominated Arctic river basins. Journal of Hydrology, 2022, 612: 128060. DOI: 10.1016/j.jhydrol.2022.128060.

[7]
Lawrence D M, Slater A G, Romanovsky V E, et al. Sensitivity of a model projection of near‐surface permafrost degradation to soil column depth and representation of soil organic matter. Journal of Geophysical Research: Earth Surface, 2008, 113(F2): F02011. DOI: 10.1029/2007JF000883.

[8]
Lawrence D M, Slater A G. A projection of severe near-surface permafrost degradation during the 21st century. Geophysical Research Letters, 2005, 32(24): L24401. DOI: 10.1029/2005GL025080.

[9]
In't Zandt M H, Liebner S, Welte C U. Roles of thermokarst lakes in a warming world. Trends in Microbiology, 2020, 28(9): 769-779.

DOI PMID

[10]
Abram N, Adler C, Bindoff N L, et al. Summary for policymakers//IPCC. Special Report on the Ocean and Cryosphere in a Changing Climate. The Second Joint Session of Working Groups I and II of the IPCC and accepted by the 51th Session of the IPCC, Principality of Monaco, 2019.

[11]
Schuur E A G, Mcguire A D, Schädel C, et al. Climate change and the permafrost carbon feedback. Nature, 2015, 520(7546): 171-179.

[12]
Janiec P, Nowosad J, Zwoliński Z. A machine learning method for Arctic lakes detection in the permafrost areas of Siberia. European Journal of Remote Sensing, 2023, 56(1): 2163923. DOI: 10.1080/22797254.2022.2163923.

[13]
Lantz T C, Turner K W. Changes in lake area in response to thermokarst processes and climate in Old Crow Flats, Yukon. Journal of Geophysical Research: Biogeosciences, 2015, 120(3): 513-524.

[14]
Chen M, Rowland J C, Wilson C J, et al. Temporal and spatial pattern of thermokarst lake area changes at Yukon Flats, Alaska. Hydrological Processes, 2014, 28(3): 837-852.

[15]
Olthof I, Fraser R H, Schmitt C. Landsat-based mapping of thermokarst lake dynamics on the Tuktoyaktuk Coastal Plain, Northwest Territories, Canada since 1985. Remote Sensing of Environment, 2015, 168(15): 194-204.

[16]
Plug L J, Walls C, Scott B M. Tundra lake changes from 1978 to 2001 on the Tuktoyaktuk Peninsula, western Canadian Arctic. Geophysical Research Letters, 2008, 35: L03502. DOI: 10.1029/2007GL032303.

[17]
Rupp D L, Larsen A S. Surface water area in a changing climate: Differential responses of Alaska's subarctic lakes. Plos Climate, 2022, 1(6): e0000036. DOI: 10.1371/journal.pclm.0000036.

[18]
Arp C D, Drew K A, Bondurant A C. Observation of a rapid lake-drainage event in the Arctic: Set-up and trigger mechanisms, outburst flood behaviour, and broader fluvial impacts. Earth Surface Processes and Landforms, 2023, 48(8): 1615-1629.

[19]
Pokrovsky O, Manasypov R, Pavlova O, et al. Carbon, nutrient and metal controls on phytoplankton concentration and biodiversity in thermokarst lakes of latitudinal gradient from isolated to continuous permafrost. Science of the Total Environment, 2021, 806(P3): 151250. DOI: 10.1016/J.SCITOTENV.2021.151250.

[20]
Walter K M, Zimov S A, Chanton J P, et al. Methane bubbling from Siberian thaw lakes as a positive feedback to climate warming. Nature, 2006, 443(7107): 71-75.

[21]
Kirpotin S N, Polishchuk Y, Bryksina N. Abrupt changes of thermokarst lakes in Western Siberia: Impacts of climatic warming on permafrost melting. International Journal of Environmental Studies, 2009, 66(4): 423-431.

[22]
Farquharson L M, Mann D H, Grosse G, et al. Spatial distribution of thermokarst terrain in Arctic Alaska. Geomorphology, 2016, 273: 116-133.

[23]
Li L, Zhang X D, Li X, et al. Thermokarst lake changes over the past 40 years in the Qinghai-Tibet Plateau, China. Frontiers in Environmental Science, 2022, 10: 1051086. DOI: 10.3389/fenvs.2022.1051086.

[24]
Yang Zhen, Wen Zhi, Niu Fujun, et al. Research on thermokarst lakes in permafrost regions: Present state and prospect. Journal of Glaciology and Geocryology, 2013, 35(6): 1519-1526.

DOI

[杨振, 温智, 牛富俊, 等. 多年冻土区热融湖研究现状与展望. 冰川冻土, 2013, 35(6): 1519-1526.]

DOI

[25]
Zhao Cenliang, Zhu Wenquan, Guo Hongxiang, et al. The impact of Arctic climatic and terrestrial environmental changes on primary industry: A review. Acta Geographica Sinica, 2022, 77(11): 2838-2861.

DOI

[赵涔良, 朱文泉, 郭红翔, 等. 北极气候和陆地环境变化对第一产业影响研究进展. 地理学报, 2022, 77(11): 2838-2861.]

DOI

[26]
Bouchard F, Francus P, Pienitz R, et al. Subarctic thermokarst ponds: Investigating recent landscape evolution and sediment dynamics in thawed permafrost of Northern Québec (Canada). Arctic, Antarctic, and Alpine Research, 2014, 46(1): 251-271.

[27]
Bryksina N A, Polishchuk Y. Studying the distribution of thermokarst lakes areas in arctic zone of Western Siberia and their dynamics by the ultrahigh resolution satellite images. Bulletin of the Tomsk Polytechnic University: Geo Assets Engineering, 2016, 327(7): 13-21.

[28]
Olefeldt D, Goswami S, Grosse G, et al. Arctic circumpolar distribution and soil carbon of thermokarst landscapes. ORNL Distributed Active Archive Center, 2015. DOI: 10.3334/ORNLDAAC/1332.

[29]
Ran Youhua, Li Xin, Cheng Guodong, et al. High-resolution datasets of permafrost thermal state and hydrothermal zonation in the Northern Hemisphere (2000-2016). Beijing: National Tibetan Plateau Data Center, DOI:10.11888/Geocry.tpdc.271190; CSTR:18406.11.Geocry.tpdc.271190, 2021.

[冉有华, 李新, 程国栋, 等. 高分辨率北半球多年冻土数据集(2000—2016). 北京: 国家青藏高原科学数据中心. DOI: 10.11888/Geocry.tpdc.271190; CSTR:18406.11.Geocry.tpdc.271190, 2021.]

[30]
Hartmann J, Moosdorf N. Global Lithological Map Database v1.0 (gridded to 0.5° spatial resolution). The new global lithological map database GLiM: A representation of rock properties at the Earth surface. Geochemistry, Geophysics, Geosystems, 2012, 13(12): Q12004. DOI: 10.1594/PANGAEA.788537.

[31]
FAO, IIASA, ISRIC, et al. Harmonized World Soil Database (version 1.2). FAO, Rome, Italy and IIASA, Laxenburg, Austria. 2012.

[32]
Brown J, Ferrians O J, Heginbottom J A, et al. Circum-Arctic map of permafrost and ground-ice conditions, version 2. National Snow and Ice Data Center, 2002. DOI: 10.7265/SKBG-KF16.

[33]
Muñoz S J. ERA5-Land monthly averaged data from 1950 to present. Copernicus Climate Change Service (C3S) Climate Data Store (CDS), 2019. DOI: 10.24381/cds.68d2bb30.

[34]
Linke S, Lehner B, Ouellet Dallaire C, et al. Global hydro-environmental sub-basin and river reach characteristics at high spatial resolution. Scientific Data, 2019, 6(1): 283. DOI: 10.1038/s41597-019-0300-6.

[35]
Kokelj S V, Jorgenson M T. Advances in thermokarst research. Permafrost and Periglacial Processes, 2013, 24(2): 108-119.

[36]
Wang R, Guo L L, Yang Y T, et al. Thermokarst lake susceptibility assessment using machine learning models in permafrost landscapes of the Arctic. Science of the Total Environment, 2023, 900: 165709. DOI: 10.1016/J.scitotenv.2023.165709.

[37]
Morgenstern A, Ulrich M, Günther F, et al. Evolution of thermokarst in East Siberian ice-rich permafrost: A case study. Geomorphology, 2013, 201(4): 363-379.

[38]
Hinkel K M, Sheng Y W, Lenters J D, et al. Thermokarst lakes on the Arctic Coastal Plain of Alaska: Geomorphic controls on bathymetry. Permafrost and Periglacial Processes, 2012, 23(3): 218-230.

[39]
Jones B M, Grosse G, Arp C D, et al. Modern thermokarst lake dynamics in the continuous permafrost zone, northern Seward Peninsula, Alaska. Journal of Geophysical Research: Biogeosciences, 2011, 116(G2): G00M03. DOI: 10.1029/2011JG001666.

[40]
Hinkel K M, Jones B M, Eisner W R, et al. Methods to assess natural and anthropogenic thaw lake drainage on the western Arctic coastal plain of northern Alaska. Journal of Geophysical Research: Earth Surface, 2007, 112(F2): F02S16. DOI: 10.1029/2006JF000584.

[41]
Grosse G, Schirrmeister L, Kunitsky V V, et al. The use of CORONA images in remote sensing of periglacial geomorphology: An illustration from the NE Siberian coast. Permafrost and Periglacial Processes, 2005, 16(2): 163-172.

[42]
Bryksina N A, Polishchuk Y M. Analysis of changes in the number of thermokarst lakes in permafrost of West Siberia on the basis of satellite images (in Russian). Earth's Cryosphere, 2015, 19(2): 100-105.

[43]
Veremeeva A, Nitze I, Günther F, et al. Geomorphological and climatic drivers of thermokarst lake area increase trend (1999-2018) in the Kolyma Lowland Yedoma Region, North-Eastern Siberia. Remote Sensing, 2021, 13(2): 178. DOI: 10.3390/RS13020178.

[44]
Smith L C, Sheng Y, Macdonald G M, et al. Disappearing Arctic Lakes. Science, 2005, 308(5727): 1429. DOI: 10.1126/science.1108142.

[45]
Olefeldt D, Goswami S, Grosse G, et al. Circumpolar distribution and carbon storage of thermokarst landscapes. Nature Communications, 2016, 7(1): 13043. DOI: 10.1038/ncomms13043.

[46]
Webb E E, Liljedahl A K. Diminishing lake area across the northern permafrost zone. Nature Geoscience, 2023, 16(3): 202-209.

[47]
Zhu X, Gao Z J, Chen T, et al. Study on the thermophysical properties and influencing factors of regional surface shallow rock and soil in China. Frontiers in Earth Science, 2022, 10: 864548. DOI: 10.3389/FEART.2022.864548.

[48]
Watanabe K, Kito T, Wake T, et al. Freezing experiments on unsaturated sand, loam and silt loam. Annals of Glaciology, 2011, 52(58): 37-43.

[49]
Morgenstern A, Grosse G, Schirrmeister L. Genetic, morphological, and statistical characterization of lakes in the permafrost-dominated Lena Delta. Proceedings of the 9th International Conference on Permafrost, 2008: 1239-1244.

[50]
Morgenstern A, Grosse G, Günther F, et al. Spatial analyses of thermokarst lakes and basins in Yedoma landscapes of the Lena Delta. The Cryosphere, 2011, 5(4): 849-867.

[51]
Kaufman D S, Ager T A, Anderson N J, et al. Holocene thermal maximum in the western Arctic (0-180°W). Quaternary Science Reviews, 2004, 23(5/6): 529-560.

[52]
Mann D H, Peteet D M, Reanier R E, et al. Responses of an Arctic landscape to Lateglacial and early Holocene climatic changes: The importance of moisture. Quaternary Science Reviews, 2002, 21(8-9): 997-1021.

[53]
Kravtsova V, Bystrova A G. Changes in thermokarst lake size in different regions of Russia for the last 30 years. Earth's Cryosphere, 2009, 13(2): 16-26.

[54]
Ulrich M, Matthes H, Schirrmeister L, et al. Differences in behavior and distribution of permafrost-related lakes in Central Yakutia and their response to climatic drivers. Water Resources Research, 2017, 53(2): 1167-1188.

[55]
Boike J, Grau T, Heim B, et al. Satellite-derived changes in the permafrost landscape of central Yakutia, 2000-2011: Wetting, drying, and fires. Global and Planetary Change, 2016, 139: 116-127.

[56]
Nitze I, Grosse G, Jones B M, et al. Remote sensing quantifies widespread abundance of permafrost region disturbances across the Arctic and Subarctic. Nature Communications, 2018, 9(1): 5423. DOI: 10.1038/s41467-018-07663-3.

[57]
Kravtsova V I, Rodinova T V. Variations in size and number of thermokarst lakes in different permafrost regions: Spaceborne evidence. Earth's Cryosphere, 2016, 20(1): 75-81.

[58]
Czerniawska J, Chlachula J. Climate-change induced permafrost degradation in Yakutia, East Siberia. Arctic, 2020, 73(4): 509-528.

[59]
Nitze I, Grosse G, Jones B M, et al. Landsat-based trend analysis of lake dynamics across northern permafrost regions. Remote Sensing, 2017, 9(7): 640. DOI: 10.3390/rs9070640.

[60]
Carroll M L, Loboda T V. Multi-decadal surface water dynamics in North American tundra. Remote Sensing, 2017, 9(5): 497. DOI: 10.3390/rs9050497.

[61]
Andresen C G, Lougheed V L. Disappearing Arctic tundra ponds: Fine-scale analysis of surface hydrology in drained thaw lake basins over a 65 year period (1948-2013). Journal of Geophysical Research: Biogeosciences, 2015, 120(3): 466-479..

[62]
Riordan B, Verbyla D, McGuire A D. Shrinking ponds in subarctic Alaska based on 1950-2002 remotely sensed images. Journal of Geophysical Research: Biogeosciences, 2006, 111(G4): G04002. DOI: 10.1029/2005JG000150.

[63]
Polishchuk Y M, Kupriyanov M A. Studying the dynamics of thermokarst lakes in the West Siberian Arctic based on the analysis of time series of satellite measurements. Yugra State University Bulletin, 2022, 18(3): 137-144.

[64]
Jia Lin, Fan Chengyan, Mu Mei, et al. Studies of thermokarst and its effects on ecosystem carbon cycle in the Third Polar regions and the Arctic. Journal of Glaciology and Geocryology, 2020, 42(1): 157-169.

DOI

[贾麟, 范成彦, 母梅, 等. 从第三极到北极: 热喀斯特及其对碳循环影响研究进展. 冰川冻土, 2020, 42(1): 157-169.]

DOI

[65]
Burn C R. Tundra lakes and permafrost, Richards Island, western Arctic coast, Canada. Canadian Journal of Earth Sciences, 2002, 39(8): 1281-1298.

[66]
Grosse G, Romanovsky V, Walter K, et al. Distribution of thermokarst lakes and ponds at three Yedoma sites in Siberia. Ninth International Conference on Permafrost, 2008: 551-556.

[67]
Everett K, Research A. Glossary of permafrost and related ground-ice terms. Arctic and alpine research, 1989, 21(2): 213. DOI: 10.2307/1551636.

[68]
Sannel A B K, Kuhry P. Warming-induced destabilization of peat plateau/thermokarst lake complexes. Journal of Geophysical Research, 2011, 116, G03035. DOI: 10.1029/2010JG001635.

[69]
Farquharson L, Anthony K W, Bigelow N, et al. Facies analysis of yedoma thermokarst lakes on the northern Seward Peninsula, Alaska. Sedimentary Geology, 2016, 340: 25-37.

[70]
Coulombe S, Fortier D, Bouchard F, et al. Contrasted geomorphological and limnological properties of thermokarst lakes formed in buried glacier ice and ice-wedge polygon terrain. The Cryosphere, 2022, 16(7): 2837-2857.

[71]
Burn C R. Thermokarst lakes. Canadian Geographies/Géographies Canadiennes, 1992, 36(1): 81-85.

[72]
Liu A B, Chen Y T, Cheng X. Monitoring thermokarst lake drainage dynamics in Northeast Siberian Coastal Tundra. Remote Sensing, 2023, 15(18): 4396. DOI: 10.3390/rs15184396.

[73]
Baisheva I, Pestryakova L, Levina S, et al. Permafrost-thaw lake development in Central Yakutia: Sedimentary ancient DNA and element analyses from a Holocene sediment record. Journal of Paleolimnology, 2023, 70(2): 95-112.

[74]
Zhou G H, Liu W H, Xie C W, et al. Accelerating thermokarst lake changes on the Qinghai-Tibetan Plateau. Scientific Reports, 2024, 14(1): 2985. DOI: 10.1038/s41598-024-52558-7.

[75]
Law A C, Nobajas A, Sangonzalo R. Heterogeneous changes in the surface area of lakes in the Kangerlussuaq area of southwestern Greenland between 1995 and 2017. Arctic, Antarctic, and Alpine Research, 2018, 50(1): S100027. DOI: 10.1080/15230430.2018.1487744.

[76]
Nitze I, Cooley S W, Duguay C R, et al. The catastrophic thermokarst lake drainage events of 2018 in northwestern Alaska: Fast-forward into the future. The Cryosphere, 2020, 14(12): 4279-4297.

[77]
Oleg D T, Pavel Y K, Vladimir V S, et al. The influence of climate warming on the hydrological regime of thermokarst lakes in the Subarctic (Chukotka, Russia). Environmental Sciences, 2024. DOI: 10.5772/intechopen.111959.

[78]
Yoshikawa K, Hinzman L D. Shrinking thermokarst ponds and groundwater dynamics in discontinuous permafrost near council, Alaska. Permafrost and Periglacial Processes, 2003, 14(2): 151-160.

[79]
Jepsen S M, Voss C I, Walvoord M A, et al. Linkages between lake shrinkage/expansion and sublacustrine permafrost distribution determined from remote sensing of interior Alaska, USA. Geophysical Research Letters, 2013, 40(5): 882-887.

[80]
Sakai T, Matsunaga T, Maksyutov S, et al. Climate-induced extreme hydrologic events in the Arctic. Remote Sensing, 2016, 8(11): 971. DOI: 10.3390/rs8110971.

[81]
Zhang Tianyuan, Huang Jixia, Wang Li. Maritime accessibility and navigation cost evolution estimation of Sino-Russian oil and gas resources from 2030 to 2070. Acta Geographica Sinica, 2021, 76(5): 1122-1135.

DOI

[张天媛, 黄季夏, 王利. 2030—2070年中俄油气资源海运可达性与通航成本演变预估. 地理学报, 2021, 76(5): 1122-1135.]

DOI

[82]
Huang Jixia, Zhang Tianyuan, Cao Yunfeng, et al. The evolution of navigation performance of Northeast Passage under the scenario of Arctic sea ice melting. Acta Geographica Sinica, 2021, 76(5): 1051-1064.

DOI

[黄季夏, 张天媛, 曹云锋, 等. 北极海冰消融情景下东北航道通航性能演变分析. 地理学报, 2021, 76(5): 1051-1064.]

DOI

文章导航

/