
粤港澳大湾区技术转移的空间关联与内生动力
|
戴靓(1989-), 女, 江苏镇江人, 博士, 副教授, 硕士生导师, 中国地理学会会员(S110014330M), 研究方向为城市网络与区域发展。E-mail: 9120181027@nufe.edu.cn |
收稿日期: 2023-01-16
修回日期: 2023-06-30
网络出版日期: 2024-06-19
基金资助
国家自然科学基金项目(42271212)
国家自然科学基金项目(41971209)
国家自然科学基金项目(52008298)
Spatial linkages and endogenous mechanisms of technology transfer in the Guangdong-Hong Kong-Macao Greater Bay Area
Received date: 2023-01-16
Revised date: 2023-06-30
Online published: 2024-06-19
Supported by
National Natural Science Foundation of China(42271212)
National Natural Science Foundation of China(41971209)
National Natural Science Foundation of China(52008298)
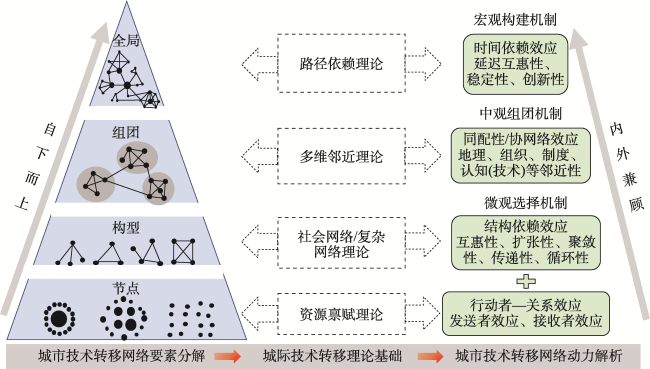
技术转移是缩小区域差距、优化资源配置、实现协同创新的重要途径。既有文献多从技术势差、技术需求、技术吸收、邻近性等理论探究技术转移的影响因素,本文从网络共生演化视角,提出来自内生结构和微观机制的新发现。基于国家知识产权局发明专利的转让数据,构建2007—2018年6个时间节点的粤港澳大湾区技术转移空间关联网络,分析其空间格局与网络结构的演化特征,并建立动态指数随机图模型,探讨网络演化的动力机制。结果表明:① 大湾区技术转移网络由松散均质向双核驱动再向多中心发展。深圳、广州是区域的技术交易中心,与第二梯队的东莞、佛山、中山、惠州,形成了多维邻近的“深惠莞广佛中”组团。在大湾区城市群尺度下,受制度差异和地域分工影响,香港、澳门在区域多为单向技术输出且较为边缘化。② 大湾区技术转移网络规模和结构有显著提升,技术转移路径稳中有变,不断优化。网络关系的互惠性提升明显,等级结构趋向收敛,网络传输性与凝聚力增强,朝多核联动的均衡化和社群化发展。③ 大湾区技术转移网络演化受内外生动力共同驱动,内生因素可降低对外生因素的依赖。城市经济发展水平、研发投入和科研成果转化能力可促进技术转移,存在发送者效应和接收者效应。制度邻近对技术转移的促进效果显著,其次是空间邻接和技术邻近。结构依赖和时间依赖是大湾区技术转移网络演化的重要内生动力,主要表现为延迟互惠性、传递闭合性、稳定性和创新性。

戴靓 , 丁子军 , 马海涛 , 曹湛 , 王瑞霖 . 粤港澳大湾区技术转移的空间关联与内生动力[J]. 地理学报, 2024 , 79(6) : 1503 -1520 . DOI: 10.11821/dlxb202406009
Technology transfer is pivotal in narrowing regional disparities, optimizing resource allocation, and fostering collaborative innovation. While existing literature predominantly explores the factors influencing technology transfer based on theories of technology disparity, technology demand, technology absorption, and proximity, this study introduces new insights from the perspective of network symbiotic evolution, with a focus on endogenous structures and micro mechanisms. By analyzing data on invention patent transfers obtained from the China National Intellectual Property Administration, this study constructs spatial linkage networks of technology transfer in the Guangdong-Hong Kong-Macao Greater Bay Area for six time points spanning 2007 to 2018. It then examines the evolutionary characteristics of the spatial patterns and explores the underlying mechanisms through temporal exponential random graph models. The findings reveal the following: (1) The technology transfer network in the Greater Bay Area has evolved from loose and homogeneous linkages to a dual-core pattern and subsequently to a polycentric structure. Shenzhen and Guangzhou are regional technology trade centers, while Dongguan, Foshan, Zhongshan, and Huizhou are second-tier cities. Together, they form a Shenzhen-Dongguan-Huizhou-Guangzhou-Foshan-Zhongshan community characterized by multi-dimensional proximity. Hong Kong and Macao are relatively marginalized cities within the Greater Bay Area urban agglomeration, primarily engaged in one-way technology transfer due to institutional differences and regional division. (2) The scale and structure of the technology transfer network in the Greater Bay Area have significantly improved. The technology transfer path has undergone steady changes and gradual optimization, demonstrating increasing reciprocity. The hierarchical structure of the network tends to converge, exhibiting enhanced connectivity and cohesion as it develops into a balanced, clustering, and polycentric network. (3) Both endogenous and exogenous forces drive the evolution of the technology transfer network in the Greater Bay Area. Endogenous factors can reduce cities' reliance on exogenous factors. The level of economic development, R&D investment, and the ability to transform technological and scientific outputs within a city can promote technology transfer. Moreover, there are sender effects and receiver effects. Institutional proximity facilitates technology transfer, followed by spatial contiguity and technological proximity. Structural dependence and time dependence are crucial endogenous driving forces for the evolution of the technology transfer network in the Greater Bay Area, as evidenced by delayed reciprocity, transfer closure, stability, and innovation.
表1 网络整体结构指标及解释Tab. 1 Indicators and explanation of global network structures |
| 指标 | 解释 |
|---|---|
| 网络密度 | 网络中实际存在的边数与可能边数的比值,衡量网络疏密程度 |
| 平均度 | 入度或出度的平均值,两者相等,衡量网络中参与专利交易的伙伴数 |
| 平均加权度 | 加权入度或加权出度的平均值,两者相等,衡量网络中专利交易规模 |
| 度中心势 | 最大度与其他度的差值之和与最大可能差值总和的比值,衡量节点度的集中程度,1代表极化、0代表均衡。有向网络中可区分入度中心势和出度中心势 |
| 互惠性 | 网络中的互惠连接边数占总边数的比值,衡量有向专利交易的互惠程度 |
| 度相关性 | 网络中节点自身的度与其邻节点平均度之间的相关性,衡量网络的同配或异配性 |
| 平均路径长度 | 网络中任意两节点间最短路径的平均值,衡量网络的传输效率 |
| 全局集聚系数 | 网络中所有节点集聚系数的平均值,衡量网络的集群化发展程度 |
| QAP相关性 | 两个网络之间的相关性,衡量网络整体结构的相似程度 |
表2 动态指数随机图的统计量设定Tab. 2 Statistics specification of temporal exponential random graph models |
| 类型 | 统计量 | 示意图 | 解释 | 假设 | |
|---|---|---|---|---|---|
| 基础效应 | 边 | edges |  | 发生技术转移的基准倾向,类似于常数项 | / |
| 城市节点属性 | 发送者效应 | nodeocov(GDP) |  | 经济水平、研发投入、转化能力强的城市有更多技术输出的倾向 | H1a |
| nodeocov(exp) | |||||
| nodeocov(tech) | |||||
| 接收者效应 | nodeicov(GDP) |  | 经济水平、研发投入、转化能力强的城市有更多技术输入的倾向 | H1b | |
| nodeicov(exp) | |||||
| nodeicov(tech) | |||||
| 城际关系属性 | 趋同性 | nodematch(ins) |  | 制度、认知、地理邻近的城市间有更多技术转移关系的倾向 | H2 |
| 协网络效应 | edgecov(cog) |  | |||
| edgecov(geo) | |||||
| 互惠效应 | 当期互惠性 | mutual |  | 单向技术转移在本期获得回馈互惠的倾向 | H3a |
| 延迟互惠性 | delrecip |  | 单向技术转移在下期获得回馈互惠的倾向 | H3b | |
| 结构依赖效应 | 扩张性 | gwodegree | 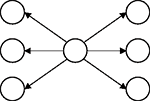 | 城市技术输出关系呈星形分布的倾向 | H4a |
| 聚敛性 | gwidegree | 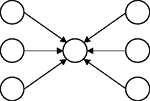 | 城市技术输入关系呈星形分布的倾向 | H4b | |
| 传递闭合性 | ttriple | 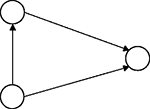 | 3个城市间形成等级传递式技术转移关系的倾向 | H5a | |
| 循环闭合性 | ctriple | 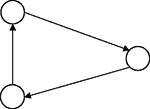 | 3个城市间形成扁平循环式技术转移关系的倾向 | H5b | |
| 时间依赖效应 | 稳定性 | stability | 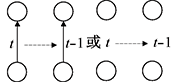 | 两城市间技术转移关系保持不变的倾向 | H6a |
| 创新性 | innovation | 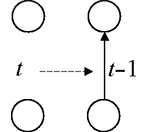 | 两城市间技术转移关系从无到有的倾向 | H6b | |
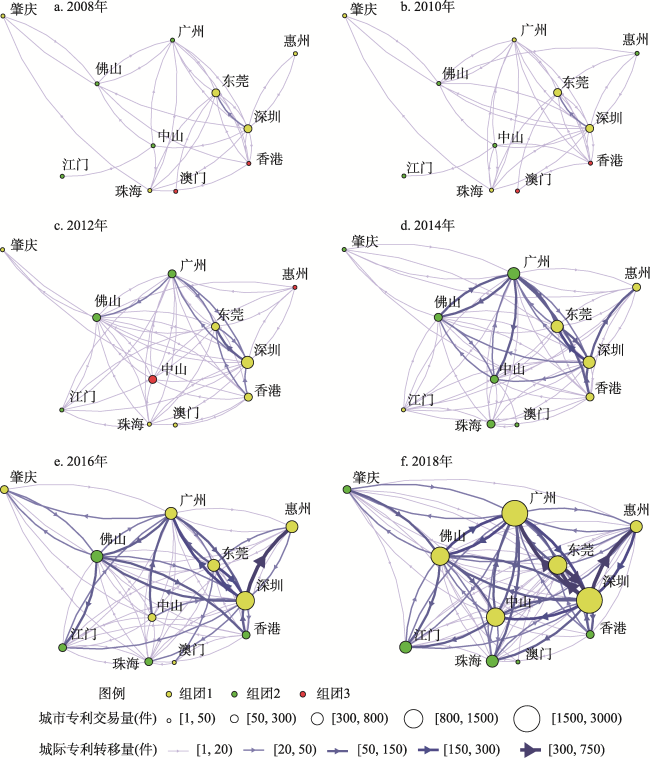
图2 2008—2018年大湾区城市技术转移网络演化Fig. 2 Evolution of urban technology transfer networks in the Guangdong-Hong Kong-Macao Greater Bay Area, 2008-2018 |
表3 2008—2018年大湾区城市技术转移量(件)Tab. 3 Technology transfer volume of cities in Guangdong-Hong Kong-Macao Greater Bay Area, 2008-2018 (Piece) |
| 2008年 | 2010年 | 2012年 | 2014年 | 2016年 | 2018年 | ||||||||||||
|---|---|---|---|---|---|---|---|---|---|---|---|---|---|---|---|---|---|
| 总交 易量 | 净转 出量 | 总交 易量 | 净转 出量 | 总交 易量 | 净转 出量 | 总交 易量 | 净转 出量 | 总交 易量 | 净转 出量 | 总交 易量 | 净转 出量 | ||||||
| 深圳 | 78 | 36 | 103 | 35 | 353 | 103 | 726 | 220 | 1461 | 577 | 2918 | 1012 | |||||
| 广州 | 47 | 9 | 44 | 8 | 212 | 28 | 534 | 86 | 682 | -110 | 1814 | -80 | |||||
| 东莞 | 57 | -39 | 84 | -44 | 224 | -128 | 512 | -174 | 662 | -10 | 1438 | -468 | |||||
| 佛山 | 19 | -9 | 28 | 2 | 90 | -20 | 265 | -43 | 481 | 59 | 995 | 11 | |||||
| 中山 | 34 | 6 | 23 | 13 | 62 | 6 | 197 | -51 | 168 | 62 | 835 | -311 | |||||
| 惠州 | 3 | 1 | 16 | -12 | 35 | -9 | 135 | -83 | 509 | -385 | 691 | -95 | |||||
| 珠海 | 38 | 2 | 39 | 9 | 34 | -10 | 81 | 3 | 106 | -8 | 403 | -115 | |||||
| 江门 | 3 | -3 | 3 | -3 | 18 | -2 | 38 | -14 | 182 | -66 | 322 | -116 | |||||
| 肇庆 | 12 | -8 | 11 | -9 | 20 | -20 | 25 | -7 | 116 | -60 | 266 | 108 | |||||
| 香港 | 17 | 3 | 37 | -17 | 83 | 53 | 196 | 62 | 212 | -38 | 251 | 55 | |||||
| 澳门 | 2 | 2 | 18 | 18 | 1 | -1 | 3 | 1 | 27 | -21 | 5 | -1 | |||||
表4 2008—2018年大湾区城市技术转移网络属性Tab. 4 Properties of urban technology transfer networks in Guangdong-Hong Kong-Macao Greater Bay Area, 2008-2018 |
| 指标 | 2008年 | 2010年 | 2012年 | 2014年 | 2016年 | 2018年 |
|---|---|---|---|---|---|---|
| 节点数 | 11 | 11 | 11 | 11 | 11 | 11 |
| 边数 | 30 | 36 | 49 | 62 | 69 | 82 |
| 网络密度 | 0.273 | 0.327 | 0.445 | 0.564 | 0.627 | 0.745 |
| 平均度 | 2.727 | 3.273 | 4.455 | 5.636 | 6.273 | 7.455 |
| 平均加权度 | 14 | 18 | 51 | 123 | 209 | 452 |
| 度中心势 | 0.522 | 0.578 | 0.556 | 0.411 | 0.456 | 0.311 |
| 出度中心势 | 0.470 | 0.520 | 0.500 | 0.370 | 0.300 | 0.280 |
| 入度中心势 | 0.250 | 0.300 | 0.390 | 0.370 | 0.300 | 0.270 |
| 互惠性 | 0.145 | 0.200 | 0.273 | 0.418 | 0.491 | 0.655 |
| 度相关性 | -0.133 | -0.181 | -0.234 | -0.199 | -0.146 | -0.145 |
| 平均路径长度 | 2.022 | 1.791 | 1.544 | 1.500 | 1.391 | 1.255 |
| 全局集聚系数 | 0.108 | 0.153 | 0.271 | 0.288 | 0.331 | 0.521 |
表5 2008—2018年大湾区城市技术转移网络的QAP相关性Tab. 5 QAP correlations of urban technology transfer networks in Guangdong-Hong Kong-Macao Greater Bay Area, 2008-2018 |
| 2008年 | 2010年 | 2012年 | 2014年 | 2016年 | 2018年 | |
|---|---|---|---|---|---|---|
| 2008年 | 1 | 0.764 | 0.721 | 0.646 | 0.639 | 0.606 |
| 2010年 | 0.764 | 1 | 0.741 | 0.706 | 0.681 | 0.610 |
| 2012年 | 0.721 | 0.741 | 1 | 0.782 | 0.716 | 0.635 |
| 2014年 | 0.646 | 0.706 | 0.782 | 1 | 0.737 | 0.705 |
| 2016年 | 0.639 | 0.681 | 0.716 | 0.737 | 1 | 0.817 |
| 2018年 | 0.606 | 0.610 | 0.635 | 0.705 | 0.817 | 1 |
表6 动态指数随机图模型的拟合结果Tab. 6 Estimation results of temporal exponential random graph models |
| 类型 | 统计量 | 模型1 | 模型2 | 模型3 | 模型4 | 模型5 | 模型6 |
|---|---|---|---|---|---|---|---|
| 基础项 | edges | -15.327*** | -12.765*** | -10.735*** | -10.288*** | -10.154*** | -8.795*** |
| (1.518) | (1.511) | (1.653) | (1.762) | (1.775) | (1.932) | ||
| 城市节点属性 | nodeocov(GDP) | 0.004** | 0.004** | 0.002** | 0.001* | 0.001* | 0.001* |
| (0.001) | (0.002) | (0.001) | (0.001) | (0.001) | (0.001) | ||
| nodeocov(exp) | 0.015** | 0.005** | 0.005** | 0.004** | 0.005** | 0.004** | |
| (0.012) | (0.012) | (0.013) | (0.013) | (0.015) | (0.016) | ||
| nodeocov(tech) | 2.530*** | 1.580*** | 1.511*** | 0.773** | 0.598* | 0.285* | |
| (0.934) | (0.965) | (1.096) | (1.067) | (1.132) | (1.221) | ||
| nodeicov(GDP) | 0.002** | 0.001** | 0.001** | 0.001** | 0.001** | 0.001* | |
| (0.001) | (0.001) | (0.001) | (0.001) | (0.001) | (0.001) | ||
| nodeicov(exp) | 0.042** | 0.041** | 0.052*** | 0.062*** | 0.059*** | 0.052** | |
| (0.014) | (0.014) | (0.015) | (0.016) | (0.018) | (0.018) | ||
| nodeicov(tech) | 2.067*** | 1.119*** | 1.015* | 0.528** | 0.099* | 0.170* | |
| (0.921) | (1.041) | (1.135) | (1.193) | (1.235) | (1.310) | ||
| 城际关系属性 | nodematch(ins) | 1.936*** | 1.561*** | 1.188*** | 0.902* | 0.902** | 0.922** |
| (0.306) | (0.285) | (0.333) | (0.354) | (0.340) | (0.373) | ||
| edgecov(cog) | 0.643*** | 0.620*** | 0.587*** | 0.564** | 0.379* | 0.022* | |
| (0.846) | (0.837) | (0.750) | (0.771) | (0.733) | (0.631) | ||
| edgecov(geo) | 1.275*** | 1.001*** | 0.802** | 0.967*** | 1.007*** | 0.871** | |
| (0.223) | (0.210) | (0.259) | (0.263) | (0.270) | (0.292) | ||
| 内生结构属性 | mutual | 1.304*** | 1.043** | 0.775* | 0.567 | 0.076 | |
| (0.301) | (0.338) | (0.331) | (0.353) | (0.426) | |||
| delrecip | 1.600*** | 1.509*** | 1.436*** | 1.330*** | |||
| (0.254) | (0.257) | (0.254) | (0.297) | ||||
| gwodegree | 0.073*** | 0.052 | 0.059* | ||||
| (0.015) | (0.023) | (0.025) | |||||
| gwidegree | 0.038** | 0.012 | 0.031 | ||||
| (0.013) | (0.023) | (0.024) | |||||
| ttriple | 0.152*** | 0.185*** | |||||
| (0.168) | (0.167) | ||||||
| ctriple | -0.022** | -0.020** | |||||
| (0.079) | (0.082) | ||||||
| stability | 1.401*** | ||||||
| (0.275) | |||||||
| innovation | 0.409* | ||||||
| (0.141) | |||||||
| AIC | 5740 | 5722 | 3874 | 3847 | 3847 | 3821 | |
| BIC | 5804 | 5792 | 3946 | 3931 | 3943 | 3923 | |
| Log Likelihood | -2860 | -2850 | -1925 | -1910 | -1907 | -1894 | |
注:***表示p < 0.001,**表示p < 0.01,*表示p < 0.05;括号中数值为稳健标准误。 |
| [1] |
|
| [2] |
[刘承良, 管明明. 基于专利转移网络视角的长三角城市群城际技术流动的时空演化. 地理研究, 2018, 37(5): 981-994.]
|
| [3] |
[李丹丹, 马海涛, 苗长虹. 黄河流域创新网络演化与郑洛西创新走廊培育研究. 中国科学院院刊, 2022, 37(12): 1807-1818.]
|
| [4] |
[吴康敏, 张虹鸥, 叶玉瑶, 等. 粤港澳大湾区协同创新的综合测度与演化特征. 地理科学进展, 2022, 41(9): 1662-1676.]
|
| [5] |
[王云, 杨宇, 刘毅. 粤港澳大湾区建设国际科技创新中心的全球视野与理论模式. 地理研究, 2020, 39(9): 1958-1971.]
|
| [6] |
|
| [7] |
[刘耀彬, 孙敏. 中国城市技术转移网络空间格局分析: 基于企业控股与专利转移的视角. 地理科学, 2022, 42(10): 1695-1705.]
|
| [8] |
[潘雄锋, 张静, 米谷. 中国区际技术转移的空间格局演变及内部差异研究. 科学学研究, 2017, 35(2): 240-246.]
|
| [9] |
|
| [10] |
[黄永春, 钱昕怡, 严翔, 等. 长三角绿色技术转移空间关联网络演化及驱动因素研究. 科技进步与对策, 2022, 39(21): 45-55.]
|
| [11] |
|
| [12] |
[李庆博, 李子彪. 京津冀区域技术转移网络结构与网络治理. 科技管理研究, 2019, 39(3): 99-106.]
|
| [13] |
[张建伟, 梁常安, 胡正玉, 等. 黄河流域市际技术转移网络的时空特征. 经济地理, 2020, 40(5): 58-69.]
|
| [14] |
[王帮娟, 王涛, 刘承良. 中国技术转移枢纽及其网络腹地的时空演化. 地理学报, 2023, 78(2): 293-314.]
|
| [15] |
[段德忠, 杜德斌, 谌颖, 等. 中国城市创新网络的时空复杂性及生长机制研究. 地理科学, 2018, 38(11): 1759-1768.]
|
| [16] |
|
| [17] |
[栾心晨, 朱晟君, 毛熙彦. 多尺度视角下技术转移网络对城市创新能力的影响. 地理科学, 2023, 43(1): 11-19.]
|
| [18] |
[刘承良, 闫姗姗. 中国跨国城际技术通道的空间演化及其影响因素. 地理学报, 2022, 77(2): 331-352.]
|
| [19] |
|
| [20] |
|
| [21] |
[刘承良, 牛彩澄. 东北三省城际技术转移网络的空间演化及影响因素. 地理学报, 2019, 74(10): 2092-2107.]
|
| [22] |
|
| [23] |
[戴靓, 曹湛, 马海涛, 等. 中国城市知识合作网络结构演化的影响机制. 地理学报, 2023, 78(2): 334-350.]
|
| [24] |
[王秋玉, 曾刚, 杨文龙, 等. 长江经济带技术转移网络结构及影响机制探究. 长江流域资源与环境, 2022, 31(1): 1-12.]
|
| [25] |
|
| [26] |
[陈钰芬, 王科平, 喻成. 中国省际技术转移: 空间关联与内生演化机制. 科学学研究, 2023, 41(1): 38-50.]
|
| [27] |
[戴靓, 刘承良, 王嵩, 等. 长三角城市科研合作的邻近性与自组织性. 地理研究, 2022, 41(9): 2499-2515.]
|
| [28] |
|
| [29] |
[顾伟男, 刘慧, 王亮. 国外创新网络演化机制研究. 地理科学进展, 2019, 38(12): 1977-1990.]
|
| [30] |
|
| [31] |
|
| [32] |
[桂钦昌, 杜德斌, 刘承良, 等. 基于随机行动者模型的全球科学合作网络演化研究. 地理研究, 2022, 41(10): 2631-2647.]
|
| [33] |
|
| [34] |
[王姣娥, 杜方叶, 景悦, 等.东北地区城际专利转移的空间: 行业路径与影响因素. 资源科学, 2022, 44(2): 365-374.]
|
| [35] |
|
| [36] |
|
| [37] |
|
| [38] |
[刘林青, 闫小斐, 杨理斯, 等. 国际贸易依赖网络的演化及内生机制研究. 中国工业经济, 2021(2): 98-116.]
|
| [39] |
|
| [40] |
[罗超亮, 符正平, 刘冰, 等. 战略性新兴产业国际贸易网络的演化及动力机制研究. 国际贸易问题, 2022(3): 121-139.]
|
| [41] |
|
| [42] |
|
| [43] |
|
| [44] |
[叶玉瑶, 王景诗, 吴康敏, 等. 粤港澳大湾区建设国际科技创新中心的战略思考. 热带地理, 2020, 40(1): 27-39.]
|
| [45] |
[毕鹏翔, 唐子来, 李紫玥. 创新一体化进程中的长三角城市网络演化: 基于技术转移的视角. 城市规划学刊, 2022(1): 35-43.]
|
| [46] |
|
| [47] |
[刘心怡. 粤港澳大湾区城市创新网络结构与分工研究. 地理科学, 2020, 40(6): 874-881.]
|
| [48] |
[程风雨. 粤港澳大湾区科技创新的空间关联及其驱动机制. 统计与决策, 2022, 38(20): 77-82.]
|
| [49] |
[唐晓彬, 崔茂生. “一带一路”货物贸易网络结构动态变化及其影响机制. 财经研究, 2020, 46(7): 138-153.]
|
| [50] |
[李文辉, 冼楚盈, 陈丽茹, 等. 基于专利计量的粤港澳大湾区技术创新流动研究. 世界地理研究, 2023, 32(12): 129-141.]
|
/
| 〈 |
|
〉 |