
东北地区收缩城市房屋空置的时空分异及影响机制——基于实体地域城市尺度
|
孙宏日(1996-), 女, 辽宁丹东人, 博士生, 主要从事城市地理、城市与区域发展研究。E-mail: sunhr429@nenu.edu.cn |
收稿日期: 2023-06-05
修回日期: 2024-04-22
网络出版日期: 2024-06-19
基金资助
国家自然科学基金项目(42171191)
国家自然科学基金项目(41771172)
Spatio-temporal differentiation pattern and influence mechanism of housing vacancy in shrinking cities of Northeast China
Received date: 2023-06-05
Revised date: 2024-04-22
Online published: 2024-06-19
Supported by
National Natural Science Foundation of China(42171191)
National Natural Science Foundation of China(41771172)
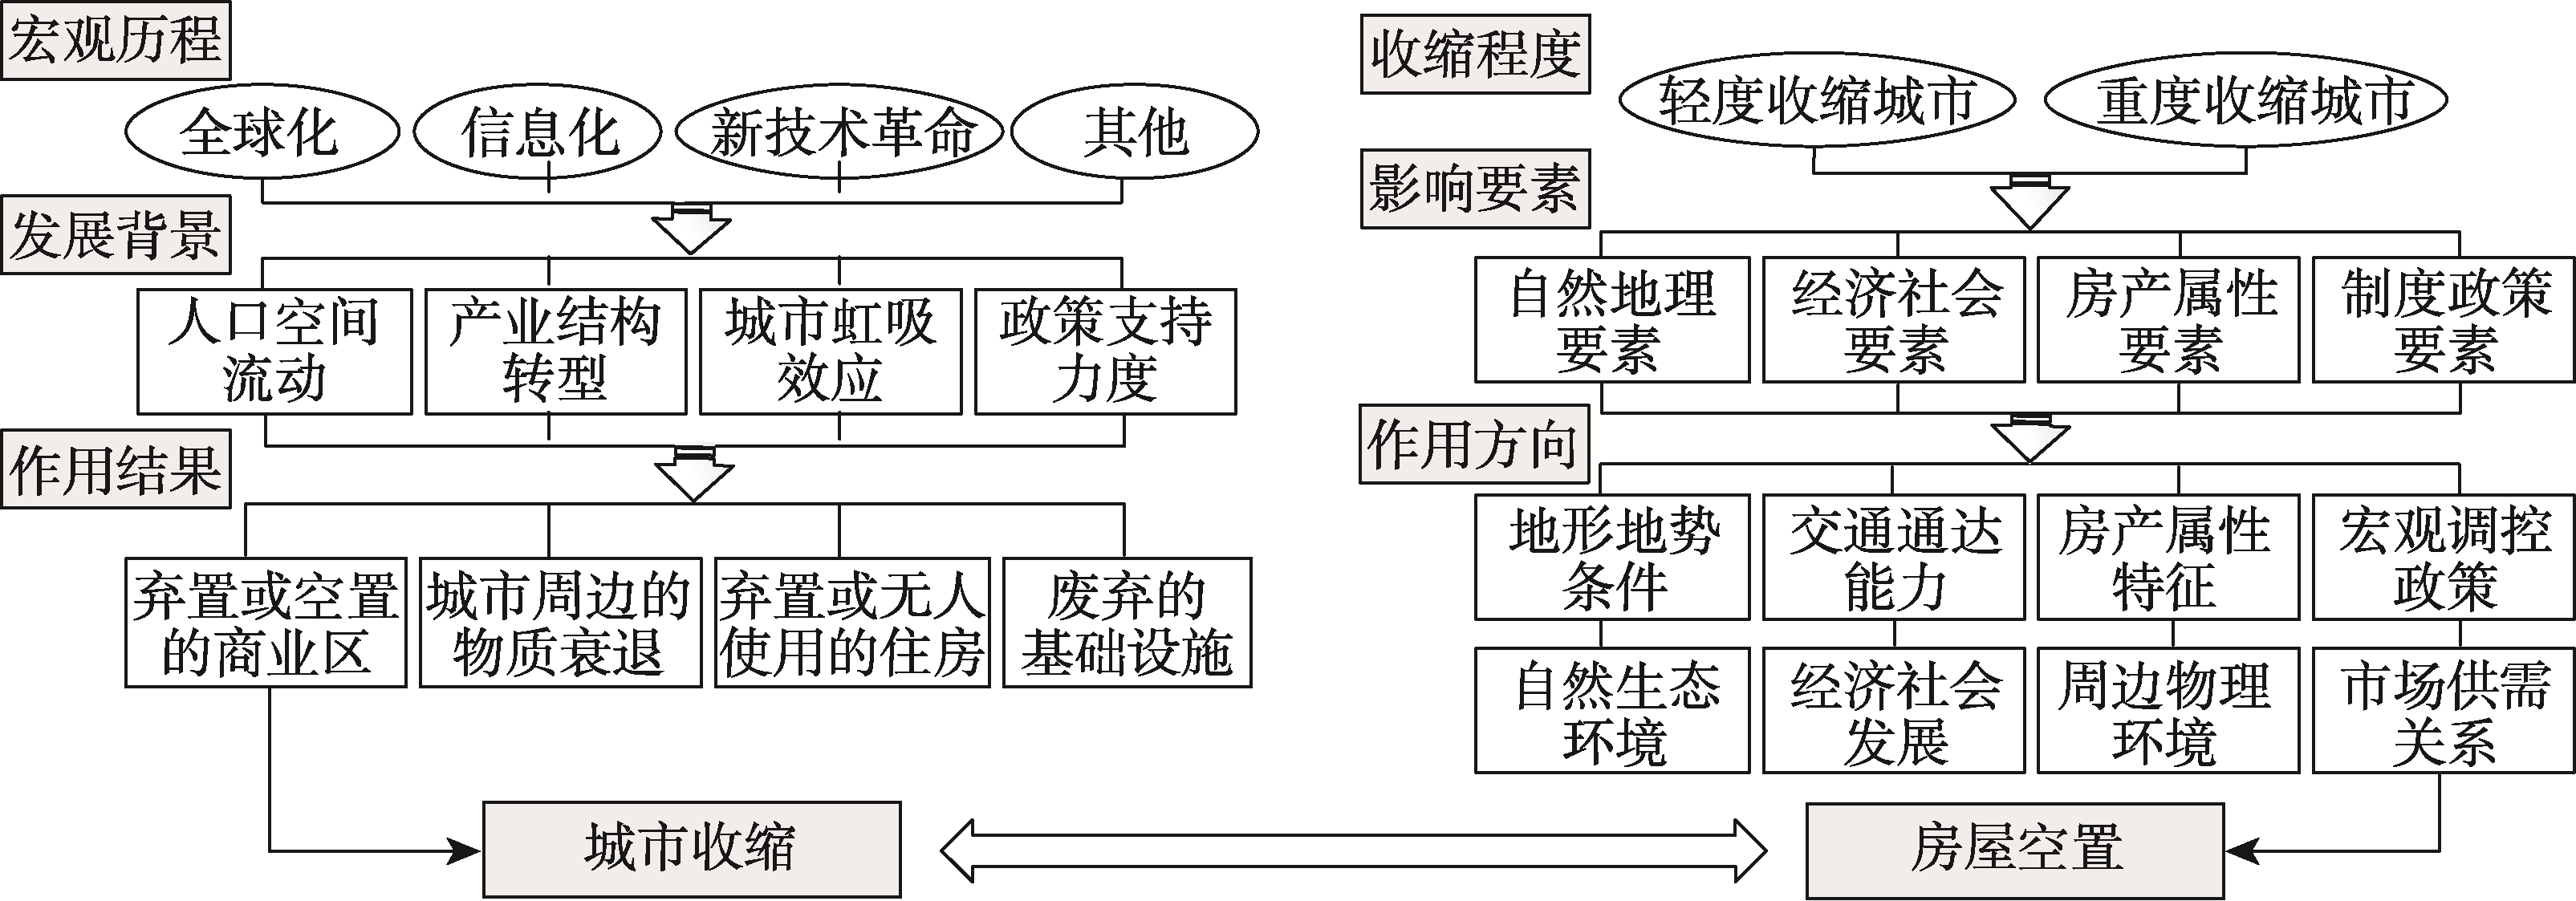
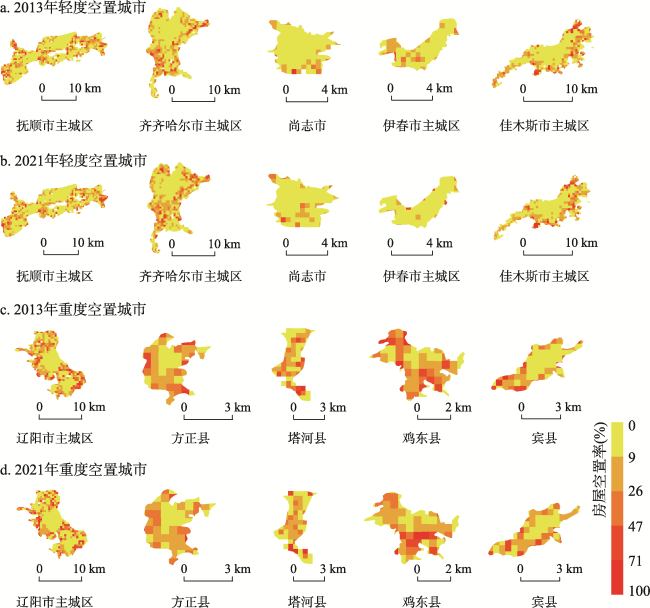
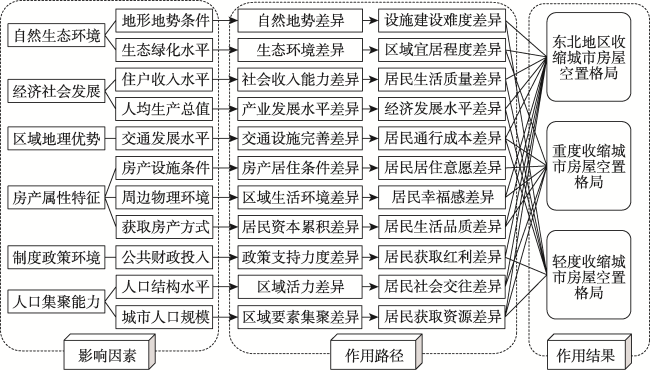
城市收缩逐渐成为全球性的经济社会现象,房屋空置是城市收缩的重要伴生效应,收缩城市的房屋空置是亟须重点研究的关键问题。本文以中国收缩城市集中地区——东北地区为研究区域,利用多类遥感影像数据和地理数据,基于实体地域城市视角识别收缩城市,估算房屋空置率,分析收缩城市房屋空置的时空分异特征,探讨不同类型收缩城市房屋空置的影响要素及作用机制。研究结论为:① 2013—2021年东北地区城市收缩现象显著,房屋空置率呈上升趋势,且重度收缩城市空置率普遍较高。② 房产设施配置与周边环境特征是房屋空置的重要影响因素。城市经济发展水平、区域交通条件和自然资源条件对房屋空置的影响逐渐增强。③ 提高经济效益,增加居民收入,有助于缓解轻度收缩城市空置压力,重度收缩城市需调节房产设施水平与优化交通设施布局以降低空置率。
孙宏日 , 刘艳军 , 付慧 , 金雨 , 周国磊 . 东北地区收缩城市房屋空置的时空分异及影响机制——基于实体地域城市尺度[J]. 地理学报, 2024 , 79(6) : 1412 -1432 . DOI: 10.11821/dlxb202406004
Urban shrinkage has gradually become a global economic and social phenomenon, and housing vacancy is an important concomitant effect of urban shrinkage. Housing vacancy in shrinking cities is a key issue that needs to be studied urgently. Taking Northeast China, a concentrated area of shrinking cities in the country, as the research object, this study uses multiple types of remote sensing imagery data and spatio-temporal big data to construct a shrinking city system based on the perspective of physical urban areas, estimate the housing vacancy rate, analyze the spatio-temporal variation characteristics of housing vacancy in shrinking cities, and explore the influence of housing vacancy in shrinking cities of different scales. The main conclusions are as follows: (1) During the study period, the urban shrinkage phenomenon in Northeast China is significant and the housing vacancy rate is on the rise. The housing vacancy rate is generally higher in severe shrinking cities. (2) The configuration of property facilities and the characteristics of the surrounding environment are the main influencing factors of housing vacancy. The level of urban economic development, regional transportation conditions and natural resource conditions have gradually increased their influence on housing vacancy. (3) Improving economic efficiency and increasing residents' income can help alleviate vacancy in slight shrinking cities, while severe shrinking cities need to adjust the level of property facilities and optimize the layout of transportation facilities to reduce vacancy rates.
表1 收缩城市房屋空置影响因素的指标体系Tab. 1 Index system of factors influencing housing vacancy |
| 指标类别 | 指标名称 | 指标解释 | 数据来源 |
|---|---|---|---|
| 自然生态环境(NE) | 高程[61](X1) | 地形起伏度 | 地理空间数据云 |
| 坡度[52](X2) | 自然地势地貌 | 地理空间数据云 | |
| 人均绿地公园面积[62](X3) | 环境宜居水平 | 统计年鉴数据 | |
| 绿化覆盖率(X4) | 区域绿化水平 | 统计年鉴数据 | |
| 经济社会发展(EDS) | 人均GDP[22](X5) | 经济发展能力 | 统计年鉴数据 |
| 产业结构水平[11,22](X6) | 产业发展能力 | 统计年鉴数据 | |
| 人均住户储蓄存款余额(X7) | 资本累积能力 | 统计年鉴数据 | |
| 万人均普通中学在校学生数(X8) | 社会发展能力 | 统计年鉴数据 | |
| 区域地理优势(RGA) | 是否开通高铁(X9) | 交通设施完善能力 | 中国铁路12306 |
| 是否有铁路站点(X10) | 基础交通条件 | 中国铁路12306 | |
| 城市区位优势[24⇓⇓⇓⇓⇓⇓⇓⇓⇓-34,49,61,63⇓ -65](X11) | 地理位置优势 | 地理数据计算 | |
| 道路密度[65](X12) | 交通通达能力 | 统计年鉴数据 | |
| 交通可达性[65](X13) | 交通便利程度 | 地理数据计算 | |
| 房产属性特征(UPS) | 独栋房产占比(X14) | 周边环境优势 | 建筑数据获取 |
| 含厨房的房产数量占比(X15) | 设施条件水平 | 人口普查数据 | |
| 购买的房产数量占比(X16) | 居民资本实力 | 人口普查数据 | |
| 自建房产数量占比(X17) | 住区环境水平 | 人口普查数据 | |
| 租赁数量占比(X18) | 居民消费能力 | 人口普查数据 | |
| 人均住房建筑面积(X19) | 居住条件水平 | 人口普查数据 | |
| 制度政策环境(IPE) | 土地出让面积(X20) | 市场流通能力 | 中国土地市场网 |
| 人均地方一般公共预算收入(X21) | 财政投资能力 | 统计年鉴数据 | |
| 人均地方一般公共预算支出(X22) | 财政支持力度 | 统计年鉴数据 | |
| 人口集聚能力(PA) | 人口密度[11,22,39,62,66](X23) | 人口承载能力 | Worldpop数据计算 |
| 城市人口规模类型[11,39](X24) | 区域吸纳能力 | 人口普查数据 | |
| 用水人口(X25) | 人口需求水平 | 统计年鉴数据 | |
| 人口老龄化程度[11,39,41,52,66](X26) | 人口结构水平 | 人口普查数据 |
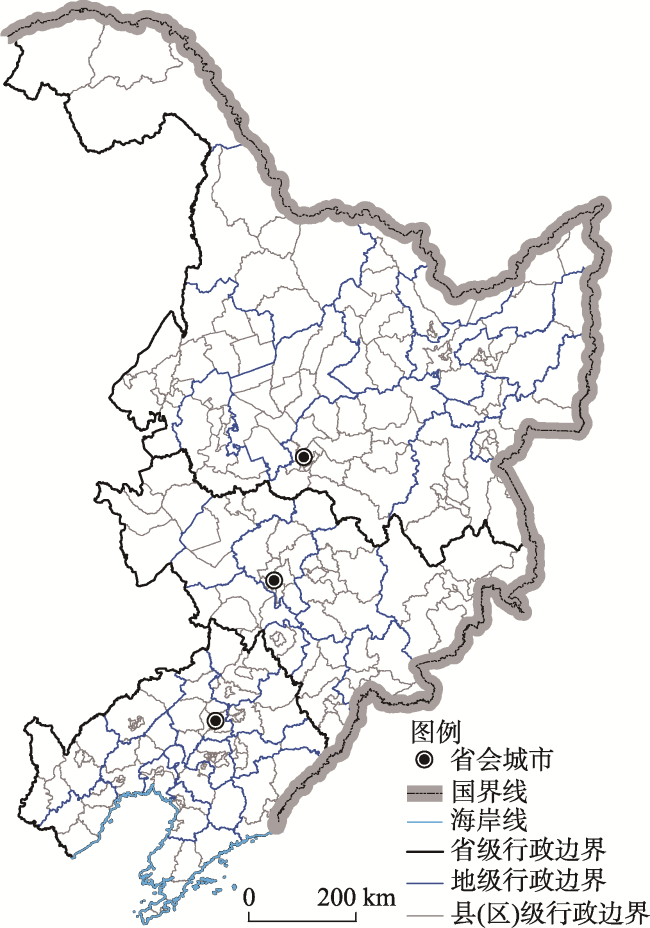
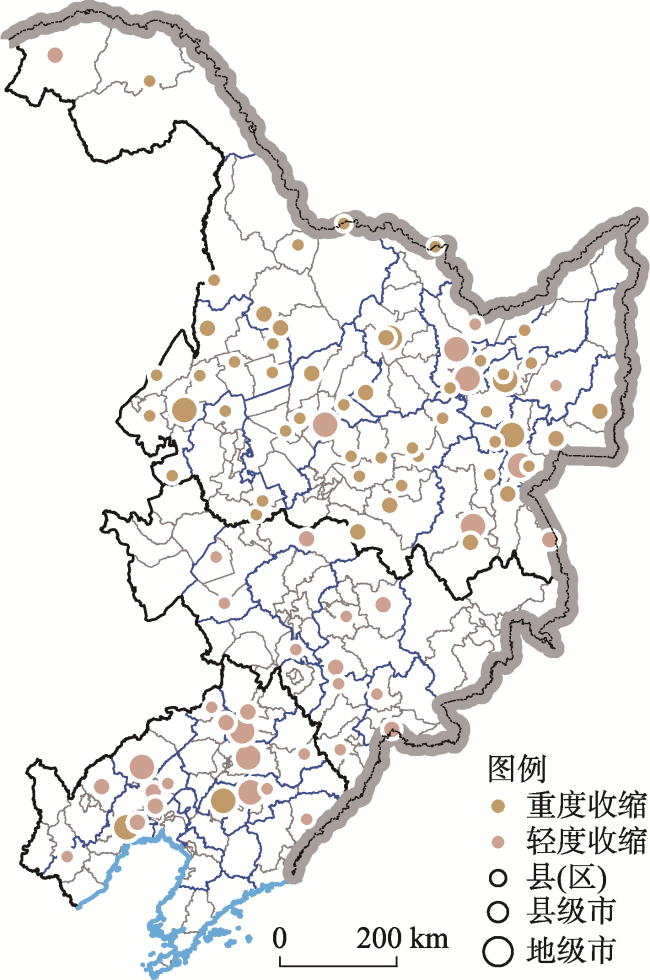
图4 基于实体地域城市的东北地区收缩城市空间分布Fig. 4 Spatial pattern of shrinking cities based on physical urban areas in Northeast China |
表2 2013—2021年东北地区收缩城市数量统计(个)Tab. 2 The quantity statistics of shrinking cities in Northeast China cities, 2023-2021 |
| 省份 | 辽宁省 | 吉林省 | 黑龙江省 | 总计 |
|---|---|---|---|---|
| 轻度收缩 | 17 | 12 | 11 | 40 |
| 重度收缩 | 3 | 0 | 54 | 57 |
| 总计 | 20 | 12 | 65 | 97 |
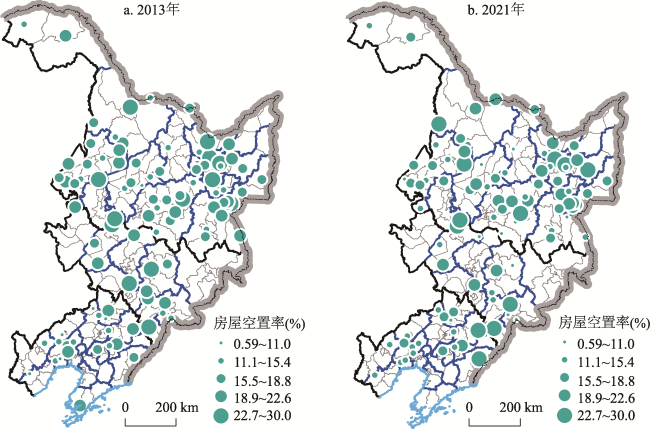
表3 2013年和2021年东北地区收缩城市房屋空置率均值(%)Tab. 3 Statistics of housing vacancy rate in shrinking cities in Northeast China in 2013 and 2021 (%) |
| 年份 | 城市收缩类型 | 辽宁省 | 吉林省 | 黑龙江省 | 东北地区 |
|---|---|---|---|---|---|
| 2013 | 轻度收缩 | 14.09 | 15.96 | 14.07 | 14.65 |
| 重度收缩 | 14.02 | - | 17.04 | 16.88 | |
| 2021 | 轻度收缩 | 15.21 | 15.38 | 15.03 | 15.21 |
| 重度收缩 | 13.84 | - | 17.16 | 16.98 |
表4 东北地区收缩城市房屋空置调研基本信息统计Tab. 4 Information statistics of survey of housing vacancy in shrinking cities in Northeast China |
| 变量 | 类别 | 数量(份) | 比例(%) |
|---|---|---|---|
| 性别 | 男 | 358 | 47.73 |
| 女 | 392 | 52.27 | |
| 年龄(岁) | 18~29 | 23 | 3.07 |
| 30~39 | 108 | 14.40 | |
| 40~49 | 114 | 15.20 | |
| 50~59 | 179 | 23.87 | |
| ≥ 60 | 326 | 43.47 | |
| 受教育水平 | 小学及以下 | 120 | 16.00 |
| 初中 | 227 | 30.27 | |
| 高中 | 130 | 17.33 | |
| 中专、大专 | 161 | 21.47 | |
| 本科及以上 | 112 | 14.93 | |
| 职业 | 机关、党群组织及事业单位工作人员 | 111 | 14.80 |
| 企业从业人员 | 88 | 11.73 | |
| 个体户 | 61 | 8.13 | |
| 学生 | 2 | 0.27 | |
| 自由职业者 | 27 | 3.60 | |
| 商业服务业从业人员 | 61 | 8.13 | |
| 离退休人员 | 306 | 40.80 | |
| 无业 | 79 | 10.53 | |
| 其他 | 15 | 2.00 | |
| 个人月收入(元) | < 3000 | 353 | 47.07 |
| 3000~5000 | 237 | 31.60 | |
| 5000~8000 | 132 | 17.60 | |
| ≥ 8000 | 28 | 3.73 | |
| 住房类型 | 商品房 | 569 | 75.87 |
| 经济适用房 | 4 | 0.53 | |
| 廉租房 | 2 | 0.27 | |
| 安置房 | 130 | 17.33 | |
| 其他(单位宿舍、租房等) | 45 | 6.00 | |
| 本社区居住时长(a) | < 2 | 78 | 10.40 |
| 2~5 | 147 | 19.60 | |
| 5~20 | 375 | 50.00 | |
| ≥ 20 | 150 | 20.00 |
表5 调研城市居民对居住区整体氛围的感知情况统计(份)Tab. 5 Information statistics on the perception of urban research residents towards the overall atmosphere of residential areas (qustionares) |
| 调研城市 | 非常荒凉 | 有些不景气 | 没太大感受 | 比较热闹 | 非常繁华 | 总计 |
|---|---|---|---|---|---|---|
| 伊春市主城区 | 8 | 68 | 33 | 34 | 0 | 143 |
| 抚顺市主城区 | 14 | 37 | 28 | 70 | 3 | 152 |
| 辽阳市主城区 | 6 | 32 | 22 | 86 | 4 | 150 |
| 尚志市 | 4 | 31 | 15 | 46 | 0 | 96 |
| 方正县 | 3 | 12 | 29 | 53 | 3 | 100 |
| 白山市江源区 | 8 | 30 | 24 | 47 | 0 | 109 |
| 总计 | 43 | 210 | 151 | 336 | 10 | 750 |
表6 调研城市居民对居住区及附近空置房产、废弃建筑物等现象感知情况统计(份)Tab. 6 Statistics on the perception of urban research residents towards vacant properties, abandoned buildings, and other phenomena in residential areas and nearby areas (qustionares) |
| 调研城市 | 非常少见 | 比较少见 | 一般 | 比较多见 | 非常多见 | 总计 |
|---|---|---|---|---|---|---|
| 伊春市主城区 | 2 | 73 | 18 | 45 | 5 | 143 |
| 抚顺市主城区 | 4 | 44 | 22 | 48 | 34 | 152 |
| 辽阳市主城区 | 18 | 48 | 29 | 44 | 11 | 150 |
| 尚志市 | 6 | 37 | 17 | 32 | 4 | 96 |
| 方正县 | 12 | 48 | 17 | 23 | 0 | 100 |
| 白山市江源区 | 8 | 37 | 21 | 40 | 3 | 109 |
| 总计 | 50 | 287 | 124 | 232 | 57 | 750 |
表7 东北地区收缩城市房屋空置率的空间自相关结果Tab. 7 Spatial autocorrelation results of housing vacancy rate in shrinking cities in Northeast China |
| Moran's I | p值 | z值 | ||||
|---|---|---|---|---|---|---|
| 2013 | 2021 | 2013 | 2021 | 2013 | 2021 | |
| HVR | 0.069 | 0.064 | 0.012 | 0.019 | 2.489 | 2.334 |
表8 东北地区收缩城市房屋空置影响因素分析结果Tab. 8 The analysis results of housing vacancy influence mechanism in shrinking cities in Northeast China |
| 指标类别 | 指标 | 2013年 | 2021年 | |||||
|---|---|---|---|---|---|---|---|---|
| OLS | SLM | SEM | OLS | SLM | SEM | |||
| NE | X1 | - | - | - | -0.148 | -0.144* | -0.149* | |
| X3 | 0.0179 | 0.015 | 0.014 | -0.131 | -0.142 | -0.102 | ||
| X4 | -0.146 | -0.139 | -0.144 | -0.279 | -0.267 | -0.228 | ||
| EDS | X5 | - | - | - | -0.149 | -0.150 | -0.201 | |
| RGA | X9 | -0.045 | -0.047 | -0.045 | -0.056 | -0.055 | -0.061 | |
| X10 | -0.086*** | -0.084*** | -0.087*** | -0.106*** | -0.108*** | -0.107*** | ||
| X12 | - | - | - | -0.056 | -0.058 | -0.089 | ||
| X13 | - | - | - | 0.121 | 0.123 | 0.049 | ||
| UPS | X14 | 0.146** | 0.153** | 0.149** | 0.203** | 0.198** | 0.187** | |
| X15 | - | - | - | - | - | - | ||
| X16 | -3.196*** | -3.231*** | -3.184*** | -0.448* | -0.456** | -0.494** | ||
| X17 | - | - | - | - | - | - | ||
| X18 | 3.011*** | 3.046*** | 2.99*** | 0.349* | 0.348* | 0.367* | ||
| IPE | X22 | -0.123 | -0.122 | -0.123 | - | - | - | |
| PA | X24 | -0.141*** | -0.145*** | -0.141*** | -0.153 | -0.148 | -0.125 | |
| X26 | - | - | - | 0.288 | 0.285* | 0.181 | ||
| R2 | 0.451 | 0.452 | 0.451 | 0.431 | 0.432 | 0.452 | ||
| logL | 62.764 | 62.832 | 62.771 | 62.510 | 62.556 | 63.642 | ||
| AIC | -105.529 | -103.666 | -105.542 | -97.021 | -95.112 | -99.284 | ||
| SC | -79.782 | -75.344 | -79.795 | -60.974 | -56.491 | -63.238 | ||
注:*、**和***分别表示在10%、5%和1%水平上显著。 |
表9 东北地区重度收缩城市房屋空置影响因素分析结果Tab. 9 The analysis results of housing vacancy influence mechanism in severe shrinking cities in Northeast China |
| 指标类别 | 指标 | 2013年 | 2021年 | |||||
|---|---|---|---|---|---|---|---|---|
| OLS | SLM | SEM | OLS | SLM | SEM | |||
| NE | X3 | - | - | - | 0.910 | 1.138** | 1.314** | |
| X4 | 0.031 | 0.048 | 0.011 | - | - | - | ||
| EDS | X5 | -0.121 | -0.142 | -0.062 | - | - | - | |
| X6 | - | - | - | -0.217 | -0.244 | -0.255 | ||
| X7 | - | - | - | -0.146 | -0.134 | -0.264 | ||
| RGA | X9 | -0.018 | -0.027 | -0.022 | -0.026 | -0.038 | -0.025 | |
| X10 | -0.034*** | -0.033*** | -0.031*** | -0.183*** | -0.174*** | -0.174*** | ||
| X13 | 0.069 | 0.102 | 0.090* | - | - | - | ||
| UPS | X14 | 0.106** | 0.111*** | 0.097*** | 0.343** | 0.387*** | 0.382*** | |
| X15 | -2.561*** | -2.205*** | -2.702*** | - | - | - | ||
| X16 | - | - | - | -0.497 | -0.354 | -0.400 | ||
| X17 | 1.134 | 0.923 | 1.238** | - | - | - | ||
| X18 | 1.417*** | 1.278*** | 1.453*** | 0.570** | 0.575*** | 0.652*** | ||
| X19 | - | - | - | -2.424** | -3.005*** | -3.58*** | ||
| IPE | X20 | - | - | - | -0.070 | -0.066 | -0.048 | |
| PA | X25 | - | - | - | -0.680 | -0.852** | -0.859** | |
| X26 | - | - | - | 0.699** | 0.781** | 0.920*** | ||
| R2 | 0.514 | 0.557 | 0.565 | 0.489 | 0.520 | 0.519 | ||
| logL | 105.996 | 107.664 | 107.604 | 38.643 | 39.87 | 39.782 | ||
| AIC | -191.991 | -193.329 | -195.209 | -51.287 | -51.740 | -53.565 | ||
| SC | -171.561 | -170.855 | -174.779 | -24.727 | -23.137 | -27.005 | ||
注:*、**和***分别表示在10%、5%和1%水平上显著。 |
表10 东北地区轻度收缩城市房屋空置影响因素分析结果Tab. 10 The analysis results of housing vacancy influence mechanism in slight shrinking cities in Northeast China |
| 指标类别 | 指标 | 2013年 | 2021年 | |||||
|---|---|---|---|---|---|---|---|---|
| OLS | SLM | SEM | OLS | SLM | SEM | |||
| NE | X1 | -0.022 | -0.022 | -0.022 | -0.059 | -0.059** | -0.060** | |
| X4 | -0.138 | -0.138* | -0.129** | -0.063 | -0.052 | -0.074 | ||
| EDS | X5 | - | - | - | -0.102* | -0.101** | -0.105** | |
| X7 | -0.907** | -0.907*** | -0.897** | - | - | - | ||
| RGA | X9 | - | - | - | -0.033 | -0.032** | -0.036** | |
| X10 | -0.024 | -0.024* | -0.024** | -0.027 | -0.028** | -0.024 | ||
| X11 | - | - | - | 0.029 | 0.027 | 0.038 | ||
| X12 | - | - | - | -0.045 | -0.043 | -0.051 | ||
| UPS | X14 | 0.054 | 0.054 | 0.054 | 0.063 | 0.064 | 0.062 | |
| X15 | -2.003 | -1.99* | -2.132** | - | - | - | ||
| X16 | - | - | - | -0.041 | -0.049 | -0.019 | ||
| X17 | 0.949 | 0.946 | 1.063 | - | - | - | ||
| X18 | 0.998 | 0.997 | 1.015 | - | - | - | ||
| X19 | -0.026 | -0.026 | -0.031 | - | - | - | ||
| IPE | X20 | - | - | - | -0.046 | -0.043 | -0.046 | |
| X21 | 0.917** | 0.917*** | 0.907** | - | - | - | ||
| PA | X24 | -0.044 | -0.044* | -0.045** | - | - | - | |
| X25 | - | - | - | -0.017 | -0.019 | -0.017 | ||
| R2 | 0.512 | 0.512 | 0.515 | 0.425 | 0.429 | 0.432 | ||
| logL | 79.344 | 79.344 | 79.399 | 75.422 | 75.4997 | 75.564 | ||
| AIC | -134.688 | -132.688 | -134.799 | -126.845 | -124.999 | -127.128 | ||
| SC | -114.421 | -110.733 | -114.533 | -106.578 | -103.044 | -106.862 | ||
注:*、**和***分别表示在10%、5%和1%水平上显著。 |
| [1] |
|
| [2] |
[孟祥凤, 马爽, 项雯怡, 等. 基于百度慧眼的中国收缩城市分类研究. 地理学报, 2021, 76(10): 2477-2488.]
|
| [3] |
|
| [4] |
|
| [5] |
|
| [6] |
|
| [7] |
|
| [8] |
|
| [9] |
[吴康, 戚伟. 收缩型城市: 认知误区、统计甄别与测算反思. 地理研究, 2021, 40(1): 213-229.]
|
| [10] |
|
| [11] |
|
| [12] |
|
| [13] |
UN Statistics Division, UN Centre for Human Settlements. Compendium of Human Settlements Statistics. New York: United Nations Publication, 2001.
|
| [14] |
|
| [15] |
|
| [16] |
|
| [17] |
[白艳, 万豫, 张尚书, 等. 住房空置率影响因素探究: 以合肥为例. 建筑与文化, 2019(9): 69-71.]
|
| [18] |
|
| [19] |
[孟斌, 张景秋, 齐志营. 北京市普通住宅空置量调查. 城市问题, 2009(4): 6-11.]
|
| [20] |
|
| [21] |
|
| [22] |
|
| [23] |
|
| [24] |
|
| [25] |
|
| [26] |
|
| [27] |
|
| [28] |
|
| [29] |
|
| [30] |
|
| [31] |
|
| [32] |
|
| [33] |
[张欣, 潘竟虎. 房屋空置的研究现状、热点与趋势: 基于文献计量法和知识图谱分析. 西华师范大学学报(自然科学版), 2023, 44(1): 56-63.]
|
| [34] |
|
| [35] |
|
| [36] |
|
| [37] |
|
| [38] |
|
| [39] |
|
| [40] |
|
| [41] |
|
| [42] |
[衣霄翔, 赵天宇, 吴彦锋, 等. “危机”抑或“契机”应对收缩城市空置问题的国际经验研究. 城市规划学刊, 2020(2): 95-101.]
|
| [43] |
|
| [44] |
[刘艳军, 张艺宁, 孙宏日, 等. 收缩城市住房空置时空分异及影响机制: 基于居民用电量视角. 地理科学, 2021, 41(12): 2087-2095.]
|
| [45] |
|
| [46] |
|
| [47] |
|
| [48] |
[陈慧, 唐如建, 付光辉, 等. 区位优势度对南京市新建商品住宅空置率影响的实证研究. 现代城市研究, 2018, 33(11): 87-93.]
|
| [49] |
|
| [50] |
|
| [51] |
|
| [52] |
|
| [53] |
|
| [54] |
|
| [55] |
|
| [56] |
[菲利普·奥斯瓦尔特. 收缩的城市(第一卷:国际研究). 上海: 同济大学出版社, 2012.]
|
| [57] |
[董磊磊, 潘竟虎, 冯娅娅, 等. 基于夜间灯光的中国房屋空置的空间分异格局. 经济地理, 2017, 37(9): 62-69, 176.]
|
| [58] |
|
| [59] |
[马爽, 龙瀛. 中国城市实体地域识别: 社区尺度的探索. 城市与区域规划研究, 2019, 1(1): 37-50.]
|
| [60] |
|
| [61] |
|
| [62] |
|
| [63] |
|
| [64] |
|
| [65] |
|
| [66] |
|
| [67] |
[乔菲. 对如何计算我国商品房空置率的思考. 当代经济, 2008(12): 12-13.]
|
| [68] |
|
/
| 〈 |
|
〉 |