
中国生态福利绩效驱动分解研究
|
董莹(1995-), 女, 山东菏泽人, 博士生, 研究方向为经济可持续与生态安全。E-mail: dy123ing@163.com |
收稿日期: 2023-04-23
修回日期: 2024-04-17
网络出版日期: 2024-05-31
基金资助
国家社会科学基金项目(18ZDA126)
国家自然科学基金项目(71934001)
Decomposition of ecological welfare performance drivers in China
Received date: 2023-04-23
Revised date: 2024-04-17
Online published: 2024-05-31
Supported by
National Social Science Foundation of China(18ZDA126)
National Natural Science Foundation of China(71934001)
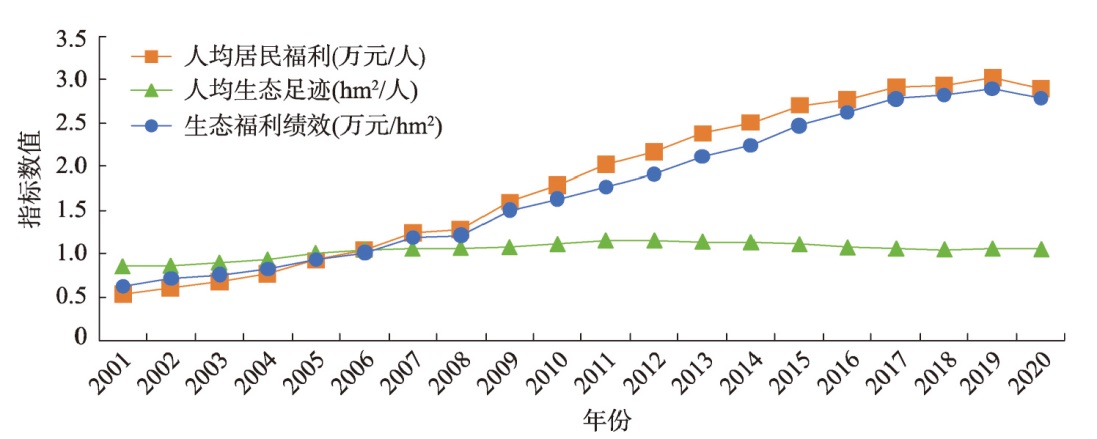
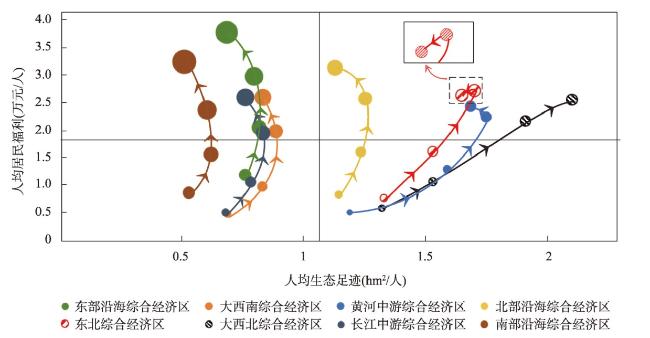
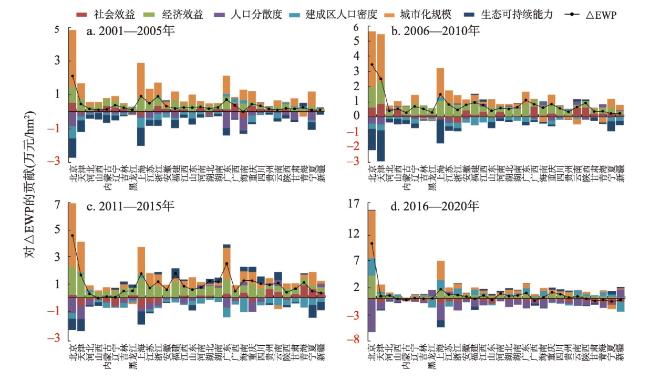
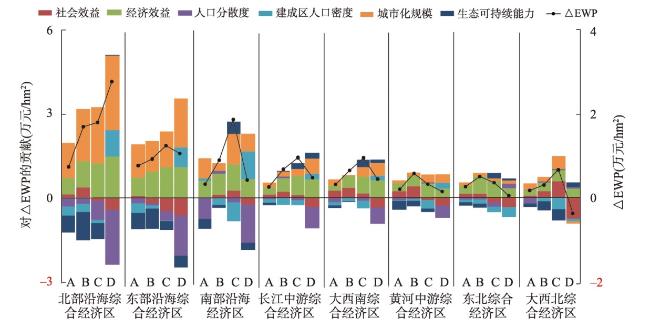
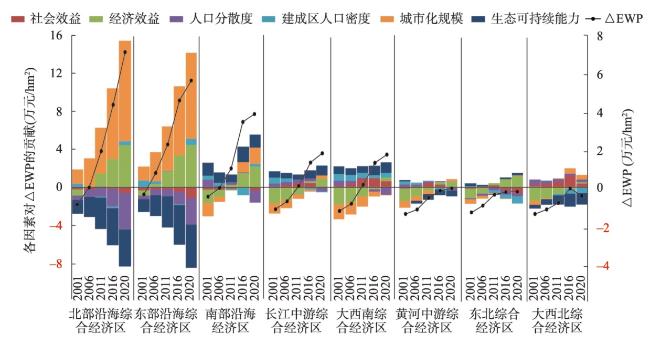
提高生态福利绩效是实现经济可持续发展、推进经济社会全面绿色转型的必要条件。本文围绕居民福利和生态消耗构建了能够量化评估中国生态福利绩效的方法,并在此基础上利用ST-LMDI模型对中国各省份及8个经济区的生态福利绩效进行时间分解和空间分解,拓展当前对生态福利绩效驱动因素分解的研究。研究结果表明,2001—2020年中国生态福利绩效呈现出先升后降的变动趋势,空间上具有显著的地区差异性。其中沿海地区社会经济结构和民生性财政支出具有更高优势,生态福利绩效处于较高水平,且表现出空间溢出效应。引入社会效益、经济效益、人口分散度、建成区人口密度、城市化规模和生态可持续能力6个因素探索其对生态福利绩效的驱动作用,发现时间和空间分解结果表现出显著差异。基于时间分解结果,经济效益和城市化规模为促进生态福利绩效提升的主要因素,人口分散度是抑制生态福利绩效增加的主要因素。但从空间分解结果看,决定各省生态福利高于均值的驱动因素在不同时期内存在区域差异和动态变化特征。综合考虑时间和空间分解结果,全面把握经济增长、生态保护和居民福利提升的关系,有助于为地方政府制订并实施差异化政策提供参考。
董莹 , 孙玉环 , 丁娇 . 中国生态福利绩效驱动分解研究[J]. 地理学报, 2024 , 79(5) : 1337 -1354 . DOI: 10.11821/dlxb202405015
To achieve sustainable economic development and promote the comprehensive green transformation of the economy and society, it is necessary to improve ecological welfare performance. This study constructed a method of quantitatively evaluating ecological welfare performance in China based on residents' welfare and ecological consumption. On this basis, the ST-LMDI model was used for spatial and temporal decomposition of the ecological welfare performance of provincial-level regions and economic zones in China, thus expanding the current research on the decomposition of the driving factors of ecological welfare performance. The results of the study were as follows. First, the trend for China's ecological welfare performance from 2001 to 2020 was first increasing and then decreasing, with significant regional differences. Additionally, because of their advantages in socioeconomic structure and livelihood-based fiscal expenditures, the coastal regions had a higher ecological welfare performance and also showed spatial spillover effects. Second, the six factors of social benefits, economic benefits, population dispersion, population density in built-up areas, scale of urbanization, and ecological sustainability were introduced to explore their driving roles on ecological welfare performance. The findings showed that the spatial and temporal decomposition results were significantly different. The temporal decomposition results proved that economic benefits and scale of urbanization were the main factors promoting ecological welfare performance, whereas population dispersion inhibited growth of ecological welfare performance. However, the spatial decomposition indicated that the drivers that determine above-average ecological welfare in each provincial-level region showed regional differences and dynamic changes in different periods. The combination of spatial and temporal decomposition and the relationships among economic growth, ecological conservation, and enhancement of residents' welfare are comprehensively helpful to provide reference for local governments to formulate and implement differentiated policies.
表1 中国SWI核算框架Tab. 1 The accounting framework of China SWI |
| 正效应 | 负效应 | |
|---|---|---|
| 核算基础 | 居民消费支出 | 收入不平等造成的福利损失 |
| 家庭行为净收益 | 家庭劳动服务价值耐用品服务价值 | 耐用品支出 车辆事故成本和通勤费用 家庭医疗和教育支出 |
| 政府行为净收益 | 卫生和教育公共支出 R&D研发支出 基础设施建设支出 | 城市化成本 |
| 环境成本 | 噪声、水、空气污染成本 不可再生资源枯竭 年度二氧化碳排放的社会成本 自然灾害直接经济损失 固体污染和生活垃圾成本 | |
| 社会因素 | 固定资本形成净额国际地位 | 腐败成本 |
表2 2001—2020年中国各省份人均居民福利、人均生态足迹和生态福利绩效时序变化Tab. 2 Time series changes of SWI per capita, EF per capita and EWP in China's provincial-level regions, 2001-2020 |
 省份 省份 | 人均居民福利(万元/人) | 人均生态足迹(hm2/人) | 生态福利绩效(万元/hm2) | |||||||||
|---|---|---|---|---|---|---|---|---|---|---|---|---|
| A | B | C | D | A | B | C | D | A | B | C | D | |
| 北京 | 1.848 | 3.142 | 4.192 | 6.043 | 0.876 | 0.604 | 0.452 | 0.312 | 2.110 | 5.202 | 9.275 | 19.367 |
| 天津 | 1.504 | 3.295 | 5.996 | 5.648 | 1.252 | 1.102 | 1.020 | 0.826 | 1.201 | 2.990 | 5.879 | 6.838 |
| 河北 | 0.535 | 1.087 | 1.807 | 2.212 | 1.290 | 1.374 | 1.396 | 1.241 | 0.415 | 0.791 | 1.294 | 1.782 |
| 山西 | 0.529 | 1.272 | 2.056 | 2.186 | 1.430 | 1.674 | 1.954 | 2.248 | 0.370 | 0.760 | 1.052 | 0.972 |
| 内蒙古 | 0.742 | 2.086 | 3.734 | 2.743 | 2.610 | 4.209 | 4.800 | 5.035 | 0.284 | 0.495 | 0.778 | 0.545 |
| 辽宁 | 0.931 | 1.915 | 2.984 | 2.242 | 1.097 | 1.324 | 1.443 | 1.245 | 0.848 | 1.446 | 2.068 | 1.801 |
| 吉林 | 0.712 | 1.796 | 2.767 | 2.759 | 1.371 | 1.522 | 1.712 | 1.550 | 0.520 | 1.180 | 1.616 | 1.780 |
| 黑龙江 | 0.633 | 1.180 | 2.431 | 3.102 | 1.567 | 1.785 | 2.022 | 2.267 | 0.404 | 0.661 | 1.202 | 1.368 |
| 上海 | 2.089 | 3.235 | 4.211 | 5.794 | 0.922 | 0.775 | 0.657 | 0.547 | 2.265 | 4.174 | 6.409 | 10.593 |
| 江苏 | 1.034 | 1.825 | 2.843 | 3.740 | 0.780 | 0.863 | 0.915 | 0.824 | 1.325 | 2.115 | 3.107 | 4.539 |
| 浙江 | 1.113 | 1.939 | 2.717 | 3.118 | 0.671 | 0.769 | 0.690 | 0.552 | 1.658 | 2.521 | 3.937 | 5.648 |
| 安徽 | 0.458 | 1.025 | 1.897 | 2.488 | 0.744 | 0.802 | 0.918 | 0.874 | 0.616 | 1.277 | 2.067 | 2.847 |
| 福建 | 0.860 | 1.654 | 2.566 | 3.450 | 0.652 | 0.831 | 0.834 | 0.718 | 1.319 | 1.991 | 3.076 | 4.806 |
| 江西 | 0.507 | 0.991 | 1.757 | 2.482 | 0.571 | 0.698 | 0.749 | 0.697 | 0.888 | 1.420 | 2.346 | 3.561 |
| 山东 | 0.817 | 1.512 | 2.346 | 2.885 | 1.072 | 1.277 | 1.362 | 1.272 | 0.762 | 1.184 | 1.722 | 2.268 |
| 河南 | 0.444 | 1.101 | 1.917 | 2.328 | 0.937 | 1.151 | 1.146 | 0.899 | 0.474 | 0.957 | 1.673 | 2.590 |
| 湖北 | 0.579 | 1.120 | 2.108 | 3.007 | 0.719 | 0.826 | 0.895 | 0.769 | 0.806 | 1.356 | 2.356 | 3.910 |
| 湖南 | 0.485 | 1.097 | 2.027 | 2.474 | 0.656 | 0.785 | 0.764 | 0.696 | 0.740 | 1.397 | 2.653 | 3.554 |
| 广东 | 0.898 | 1.582 | 2.350 | 3.264 | 0.477 | 0.544 | 0.518 | 0.429 | 1.882 | 2.907 | 4.537 | 7.607 |
| 广西 | 0.391 | 1.123 | 2.033 | 2.092 | 0.654 | 0.858 | 0.985 | 1.064 | 0.598 | 1.309 | 2.064 | 1.966 |
| 海南 | 0.551 | 1.089 | 2.048 | 2.598 | 0.539 | 0.584 | 0.688 | 0.633 | 1.023 | 1.865 | 2.977 | 4.104 |
| 重庆 | 0.686 | 1.411 | 2.592 | 3.386 | 0.738 | 0.828 | 0.792 | 0.650 | 0.930 | 1.704 | 3.273 | 5.209 |
| 四川 | 0.532 | 0.875 | 1.887 | 2.484 | 0.663 | 0.748 | 0.749 | 0.663 | 0.802 | 1.170 | 2.519 | 3.747 |
| 贵州 | 0.357 | 0.825 | 1.746 | 2.595 | 0.751 | 0.935 | 1.021 | 0.941 | 0.475 | 0.882 | 1.710 | 2.758 |
| 云南 | 0.456 | 0.870 | 1.953 | 2.902 | 0.680 | 0.872 | 0.989 | 0.932 | 0.671 | 0.997 | 1.974 | 3.114 |
| 陕西 | 0.499 | 1.299 | 2.352 | 2.819 | 0.722 | 0.930 | 1.149 | 1.129 | 0.691 | 1.396 | 2.047 | 2.497 |
| 甘肃 | 0.450 | 0.876 | 1.619 | 2.095 | 0.739 | 0.884 | 1.071 | 1.043 | 0.610 | 0.991 | 1.512 | 2.008 |
| 青海 | 0.747 | 1.379 | 3.321 | 4.255 | 1.327 | 1.488 | 1.680 | 1.722 | 0.563 | 0.927 | 1.977 | 2.471 |
| 宁夏 | 0.710 | 1.570 | 2.837 | 3.096 | 1.913 | 2.493 | 3.366 | 3.986 | 0.371 | 0.630 | 0.843 | 0.777 |
| 新疆 | 0.676 | 1.073 | 2.333 | 2.510 | 1.915 | 2.054 | 2.493 | 2.740 | 0.353 | 0.522 | 0.936 | 0.916 |
注:A、B、C、D分别表示表中时阶2001—2005年、2006—2010年、2011—2015年和2016—2020年,后同。 |
| [1] |
[臧漫丹, 高易, 李金. 行政等级与城市规模对生态福利绩效的影响研究. 自然资源学报, 2022, 37(12): 3201-3216.]
|
| [2] |
[诸大建, 张帅. 生态福利绩效与深化可持续发展的研究. 同济大学学报(社会科学版), 2014, 25(5): 106-115.]
|
| [3] |
|
| [4] |
|
| [5] |
|
| [6] |
[赵林, 曹乃刚, 韩增林, 等. 中国生态福利绩效空间关联网络演变特征与形成机制. 自然资源学报, 2022, 37(12): 3183-3200.]
|
| [7] |
|
| [8] |
|
| [9] |
|
| [10] |
|
| [11] |
|
| [12] |
|
| [13] |
|
| [14] |
[王世豪, 黄麟, 徐新良, 等. 特大城市群生态空间及其生态承载状态的时空分异. 地理学报, 2022, 77(1): 164-181.]
|
| [15] |
[方时姣, 肖权. 中国区域生态福利绩效水平及其空间效应研究. 中国人口·资源与环境, 2019, 29(3): 1-10.]
|
| [16] |
[龙亮军, 王霞, 郭兵. 基于改进DEA模型的城市生态福利绩效评价研究: 以我国35个大中城市为例. 自然资源学报, 2017, 32(4): 595-605.]
|
| [17] |
[邓远建, 杨旭, 马强文, 等. 中国生态福利绩效水平的地区差距及收敛性. 中国人口·资源与环境, 2021, 31(4): 132-143.]
|
| [18] |
|
| [19] |
[夏美君, 李健, 闫永蚕. 京津冀城市群生态福利绩效时空格局及演进特征. 生态环境学报, 2023, 32(4): 814-824.]
|
| [20] |
[王圣云, 韩亚杰, 任慧敏, 等. 中国省域生态福利绩效评估及其驱动效应分解. 资源科学, 2020, 42(5): 840-855.]
|
| [21] |
|
| [22] |
[洪顺发, 郭青海, 李达维. 基于生态足迹理论的中国生态供需平衡时空动态. 资源科学, 2020, 42(5): 980-990.]
|
| [23] |
[张文彬, 郭琪. 中国可持续经济福利水平测度及区域差异分析. 管理学刊, 2019, 32(3): 19-30.]
|
| [24] |
[刘渝琳, 王雨豪, 朱鑫城. 共同富裕目标下可持续经济福利结构均衡增长. 数量经济技术经济研究, 2022, 39(5): 3-24.]
|
| [25] |
[田卫民. 中国基尼系数计算及其变动趋势分析. 人文杂志, 2012, 66(2): 56-61.]
|
| [26] |
|
| [27] |
|
| [28] |
[沈晓艳, 王广洪, 黄贤金. 1997—2013年中国绿色GDP核算及时空格局研究. 自然资源学报, 2017, 32(10): 1639-1650.]
|
| [29] |
|
| [30] |
[张军, 吴桂英, 张吉鹏. 中国省际物质资本存量估算: 1952—2000. 经济研究, 2004(10): 35-44.]
|
| [31] |
|
| [32] |
|
| [33] |
[王班班, 廖晓洁, 谭秀杰. 城市化对雾霾暴露的贡献: 基于对中国城市群的时空分解. 中国人口·资源与环境, 2021, 31(7): 63-74.]
|
| [34] |
[孙平军, 张可秋, 曹乃刚, 等. 东北区域性城市收缩的地理认知与治理逻辑. 地理学报. https://link.cnki.net/urlid/11.1856.P.20231123.1336.002.]
|
/
| 〈 |
|
〉 |
