
1998—2021年长江上游地区环境压力的时空格局特征
|
黄磊(1991-), 男, 湖北孝昌人, 博士, 副教授, 硕士生导师, 主要从事经济地理与区域经济研究。E-mail: huanglei2051@163.com |
收稿日期: 2023-07-27
修回日期: 2024-04-22
网络出版日期: 2024-05-31
基金资助
国家社会科学基金项目(20CJL021)
Spatio-temporal pattern of environmental pressure in the upper reaches of the Yangtze River from 1998 to 2021
Received date: 2023-07-27
Revised date: 2024-04-22
Online published: 2024-05-31
Supported by
National Social Science Foundation of China(20CJL021)
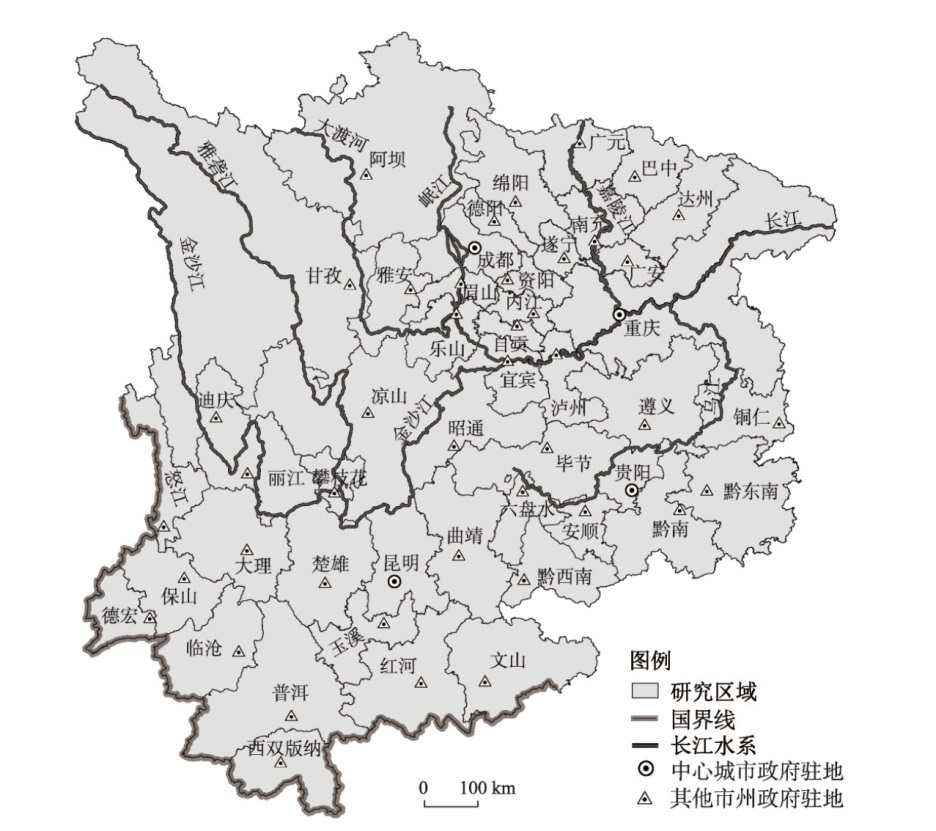
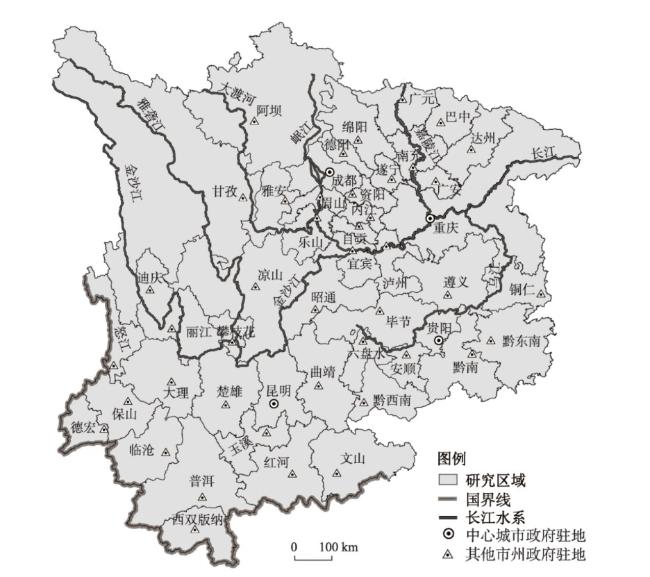
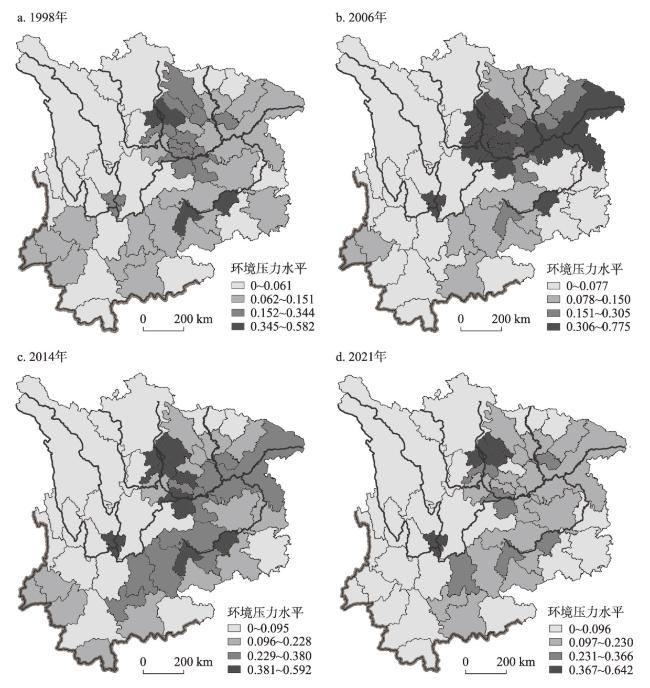
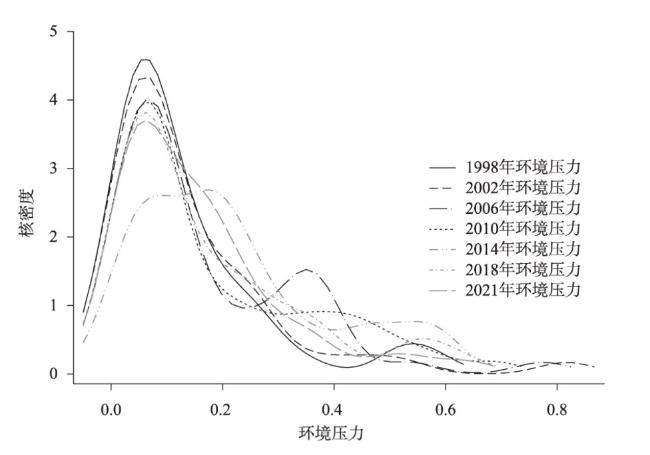
长江上游地区承载着国家重要生态服务功能,也是国家核心增长极,但经济快速发展中的资源消耗给该地区生态系统稳定带来了巨大压力。本文基于1998—2021年长江上游地区47个研究单元面板数据,综合采用Dagum基尼系数、核密度估计、马尔科夫链、空间收敛模型等方法多维度剖析长江上游地区环境压力时空格局。研究发现,1998—2021年长江上游地区整体环境压力倒“V”型微升态势,前期增长的环境代价明显,但后期环境风险得到有效控制;环境压力呈“东高西低”与“高缩低扩”格局,偏东的三大城市化地区特别是成渝地区压力突出,但后期长江大保护政策使高环境压力范围大幅收缩;环境压力总体差异呈阶段性小幅波动态势,地区内差异、地区间净差异与超变密度趋于均衡,云南和贵州稳定存在少数高压力城市;环境压力演化由“多极分化”向“低压集中”趋势转变,前期环境压力梯度分异明显,而后期则普遍向低压力水平聚集;环境压力相对态势具有较强的稳定性,但随时间推移逐渐衰减,并存在环境压力变迁的空间渗透效应;环境压力收敛趋势强劲,空间近邻效应对环境压力趋同有加速作用,后期环境政策趋紧使收敛进程疾速缩短。本文可为筑牢长江上游生态安全屏障提供决策支持。
黄磊 . 1998—2021年长江上游地区环境压力的时空格局特征[J]. 地理学报, 2024 , 79(5) : 1192 -1210 . DOI: 10.11821/dlxb202405007
As a crucial ecological service provider and a key regional growth pole, the upper reaches of the Yangtze River faces significant environmental pressure due to enormous resource consumption during rapid economic development, posing a threat to the stability of its ecosystem. Based on the panel data from 47 prefecture-level and above cities in the upper reaches of the Yangtze River from 1998 to 2021, this paper comprehensively used Dagum Gini Coefficient, kernel density estimation, Markov Chain, spatial convergence model and other methods to deeply analyze the spatiotemporal pattern of environmental pressure. The results are as follows: (1) During the sample period, the overall pressure showed a slight upward trend in an inverted "V"-shaped pattern. The environmental cost of economic growth was high in the early stages, but the environmental risk was effectively controlled in the later stages. (2) The pressure demonstrated a pattern of "high in the east and low in the west" and "high-pressure areas contracted and low-pressure areas expanded". The three urbanized areas in the east, especially Chengdu-Chongqing region, were the pressure centers. However, due to the implementation of the environmental protection policies in the Yangtze River Basin, the scope of high-pressure cities significantly decreased. (3) The overall difference of the pressure exhibited a gently periodic fluctuating trend, with regional difference, net inter-regional difference, and hypervariable density tending towards a state of equilibrium. There were a few stable high-pressure cities in Yunnan-Guizhou region. (4) The evolution of the pressure shifted from a "multi-polar differentiation" trend to a "low-pressure concentration" trend. Initially, there were significant gradients in environmental pressure among cities, but in the later stages, most cities tended to converge towards lower pressure levels. (5) The relative situation of the pressure showed strong stability, but gradually decayed over time, and there existed spatial infiltration effect on the pressure changes. (6) The convergence trend of the pressure was robust, and the spatial proximity accelerated the convergence of environmental pressure. The tightening of environmental policies in the later stages further accelerated the convergence process. This study could provide decision-making support for strengthening ecological security barrier in the study area.
表1 长江上游地区环境压力分析的相关变量描述性统计Tab. 1 Descriptive statistics of related variables in the upper reaches of the Yangtze River |
| 变量名 | 样本量(个) | 均值 | 最小值 | 中位数 | 最大值 | 物理含义 |
|---|---|---|---|---|---|---|
| envir | 1128 | 0.171 | < 0.001 | 0.112 | 0.829 | 环境压力综合水平 |
| pgdp | 1128 | 9.252 | 7.314 | 9.348 | 11.073 | 人均综合生产能力 |
| ladder | 1128 | 1.024 | 0.272 | 0.949 | 3.121 | 二三产业增加值比 |
| indus | 1128 | 0.408 | 0.149 | 0.400 | 0.759 | 第二产业经济份额 |
| consum | 1128 | 0.397 | 0.107 | 0.380 | 3.982 | 单位GDP消费倾向 |
| invest | 1128 | 0.625 | 0.104 | 0.526 | 2.834 | 单位GDP投资倾向 |
表2 1998—2021年长江上游地区环境压力Dagum基尼系数及其分解Tab. 2 Dagum Gini Coefficient and its decomposition of environmental pressure in the upper Yangtze River area |
| 年份 | 总体 差异 | 地区内差异比较 | 地区间净差异比较 | 地区内差异 | 地区间净差异 | 超变密度 | |||||||||||
|---|---|---|---|---|---|---|---|---|---|---|---|---|---|---|---|---|---|
| 川 | 贵 | 云 | 川—贵 | 川—云 | 贵—云 | 系数 | 份额 | 系数 | 份额 | 系数 | 份额 | ||||||
| 1998 | 0.500 | 0.425 | 0.499 | 0.365 | 0.526 | 0.549 | 0.572 | 0.160 | 0.319 | 0.187 | 0.374 | 0.153 | 0.307 | ||||
| 1999 | 0.465 | 0.409 | 0.432 | 0.376 | 0.470 | 0.530 | 0.488 | 0.155 | 0.334 | 0.165 | 0.355 | 0.144 | 0.311 | ||||
| 2000 | 0.472 | 0.411 | 0.376 | 0.397 | 0.415 | 0.591 | 0.518 | 0.157 | 0.333 | 0.208 | 0.440 | 0.107 | 0.227 | ||||
| 2001 | 0.510 | 0.443 | 0.426 | 0.345 | 0.487 | 0.638 | 0.504 | 0.172 | 0.337 | 0.251 | 0.493 | 0.087 | 0.171 | ||||
| 2002 | 0.512 | 0.440 | 0.437 | 0.347 | 0.489 | 0.641 | 0.511 | 0.172 | 0.335 | 0.253 | 0.495 | 0.087 | 0.170 | ||||
| 2003 | 0.531 | 0.451 | 0.446 | 0.375 | 0.513 | 0.668 | 0.522 | 0.179 | 0.337 | 0.270 | 0.509 | 0.082 | 0.154 | ||||
| 2004 | 0.523 | 0.442 | 0.445 | 0.389 | 0.508 | 0.655 | 0.511 | 0.177 | 0.337 | 0.264 | 0.505 | 0.083 | 0.158 | ||||
| 2005 | 0.506 | 0.412 | 0.459 | 0.355 | 0.498 | 0.643 | 0.506 | 0.165 | 0.326 | 0.258 | 0.511 | 0.083 | 0.164 | ||||
| 2006 | 0.488 | 0.386 | 0.396 | 0.346 | 0.499 | 0.635 | 0.432 | 0.157 | 0.322 | 0.271 | 0.555 | 0.060 | 0.123 | ||||
| 2007 | 0.497 | 0.386 | 0.395 | 0.352 | 0.536 | 0.642 | 0.416 | 0.159 | 0.319 | 0.281 | 0.565 | 0.057 | 0.115 | ||||
| 2008 | 0.494 | 0.385 | 0.359 | 0.369 | 0.537 | 0.635 | 0.397 | 0.159 | 0.321 | 0.277 | 0.562 | 0.058 | 0.117 | ||||
| 2009 | 0.507 | 0.389 | 0.359 | 0.359 | 0.573 | 0.651 | 0.391 | 0.161 | 0.318 | 0.292 | 0.575 | 0.054 | 0.107 | ||||
| 2010 | 0.504 | 0.382 | 0.324 | 0.365 | 0.566 | 0.657 | 0.375 | 0.158 | 0.314 | 0.296 | 0.587 | 0.049 | 0.098 | ||||
| 2011 | 0.440 | 0.422 | 0.354 | 0.350 | 0.415 | 0.514 | 0.416 | 0.156 | 0.354 | 0.165 | 0.375 | 0.119 | 0.270 | ||||
| 2012 | 0.425 | 0.411 | 0.338 | 0.348 | 0.396 | 0.495 | 0.416 | 0.149 | 0.351 | 0.146 | 0.343 | 0.130 | 0.306 | ||||
| 2013 | 0.424 | 0.414 | 0.338 | 0.345 | 0.395 | 0.490 | 0.411 | 0.150 | 0.353 | 0.140 | 0.330 | 0.134 | 0.317 | ||||
| 2014 | 0.421 | 0.414 | 0.322 | 0.351 | 0.384 | 0.490 | 0.411 | 0.149 | 0.353 | 0.135 | 0.322 | 0.137 | 0.325 | ||||
| 2015 | 0.450 | 0.412 | 0.382 | 0.435 | 0.416 | 0.517 | 0.464 | 0.158 | 0.351 | 0.142 | 0.317 | 0.150 | 0.333 | ||||
| 2016 | 0.446 | 0.409 | 0.409 | 0.416 | 0.458 | 0.489 | 0.432 | 0.160 | 0.358 | 0.137 | 0.307 | 0.150 | 0.335 | ||||
| 2017 | 0.493 | 0.410 | 0.466 | 0.409 | 0.482 | 0.585 | 0.546 | 0.161 | 0.327 | 0.200 | 0.406 | 0.131 | 0.266 | ||||
| 2018 | 0.495 | 0.433 | 0.448 | 0.448 | 0.462 | 0.581 | 0.547 | 0.168 | 0.338 | 0.181 | 0.365 | 0.147 | 0.297 | ||||
| 2019 | 0.489 | 0.443 | 0.424 | 0.402 | 0.457 | 0.577 | 0.510 | 0.169 | 0.345 | 0.192 | 0.393 | 0.128 | 0.262 | ||||
| 2020 | 0.493 | 0.443 | 0.390 | 0.428 | 0.433 | 0.598 | 0.550 | 0.166 | 0.337 | 0.188 | 0.381 | 0.139 | 0.282 | ||||
| 2021 | 0.466 | 0.439 | 0.332 | 0.409 | 0.414 | 0.560 | 0.467 | 0.164 | 0.353 | 0.182 | 0.390 | 0.120 | 0.258 | ||||
注:川代表四川—重庆,贵代表贵州,云代表云南;由于取值四舍五入,地区内差异、地区间净差异、超变密度占总体差异份额之和可能不等于1,后表同。 |
表3 1998—2021年长江上游地区环境压力多期传统马尔科夫链转移概率矩阵Tab. 3 Multi-period traditional Markov matrix of environmental pressure in the upper reaches of the Yangtze River |
| 跨期(a) | 压力等级 | 低 | 较低 | 较高 | 高 | 跨期(a) | 压力等级 | 低 | 较低 | 较高 | 高 |
|---|---|---|---|---|---|---|---|---|---|---|---|
| 1 | 低 | 0.896 | 0.100 | 0.004 | 0 | 3 | 低 | 0.823 | 0.165 | 0.012 | 0 |
| 较低 | 0.088 | 0.787 | 0.121 | 0.004 | 较低 | 0.149 | 0.661 | 0.173 | 0.016 | ||
| 较高 | 0.004 | 0.090 | 0.779 | 0.127 | 较高 | 0.016 | 0.169 | 0.645 | 0.169 | ||
| 高 | 0.004 | 0.007 | 0.110 | 0.879 | 高 | 0.004 | 0.004 | 0.145 | 0.847 | ||
| 5 | 低 | 0.763 | 0.215 | 0.023 | 0 | 7 | 低 | 0.702 | 0.273 | 0.024 | 0 |
| 较低 | 0.173 | 0.549 | 0.243 | 0.035 | 较低 | 0.152 | 0.471 | 0.333 | 0.044 | ||
| 较高 | 0.035 | 0.206 | 0.526 | 0.232 | 较高 | 0.035 | 0.215 | 0.470 | 0.280 | ||
| 高 | 0.005 | 0.000 | 0.177 | 0.818 | 高 | 0.005 | 0.000 | 0.163 | 0.832 |
表4 1998—2021年长江上游地区环境压力多期空间马尔科夫链转移概率矩阵Tab. 4 Multi-period spatial Markov matrix of environmental pressure in the upper reaches of the Yangtze River |
| WY 类型 | 压力 等级 | t = 1 a | t = 3 a | t = 5 a | t = 7 a | |||||||||||||||
|---|---|---|---|---|---|---|---|---|---|---|---|---|---|---|---|---|---|---|---|---|
| 低 | 较低 | 较高 | 高 | 低 | 较低 | 较高 | 高 | 低 | 较低 | 较高 | 高 | 低 | 较低 | 较高 | 高 | |||||
| 低 | 低 | 0.943 | 0.057 | 0 | 0 | 0.936 | 0.064 | 0 | 0 | 0.941 | 0.059 | 0 | 0 | 0.875 | 0.125 | 0 | 0 | |||
| 较低 | 0.250 | 0.750 | 0 | 0 | 0.273 | 0.636 | 0.091 | 0 | 0.150 | 0.650 | 0.200 | 0 | 0.158 | 0.421 | 0.421 | 0 | ||||
| 较高 | 0 | 0 | 0.875 | 0.125 | 0 | 0 | 0.625 | 0.375 | 0 | 0 | 0.375 | 0.625 | 0 | 0 | 0.125 | 0.875 | ||||
| 高 | 0 | 0 | 0 | 1.000 | 0 | 0 | 0 | 1.000 | 0 | 0 | 0 | 1.000 | 0 | 0 | 0 | 1.000 | ||||
| 较低 | 低 | 0.944 | 0.056 | 0 | 0 | 0.857 | 0.143 | 0 | 0 | 0.727 | 0.260 | 0.013 | 0 | 0.671 | 0.315 | 0.014 | 0 | |||
| 较低 | 0.048 | 0.786 | 0.167 | 0 | 0.099 | 0.642 | 0.259 | 0 | 0.130 | 0.481 | 0.364 | 0.026 | 0.125 | 0.431 | 0.403 | 0.042 | ||||
| 较高 | 0.021 | 0.191 | 0.681 | 0.106 | 0.064 | 0.277 | 0.511 | 0.149 | 0.106 | 0.213 | 0.426 | 0.255 | 0.091 | 0.250 | 0.341 | 0.318 | ||||
| 高 | 0 | 0 | 0.192 | 0.808 | 0 | 0 | 0.200 | 0.800 | 0 | 0 | 0.304 | 0.696 | 0 | 0 | 0.333 | 0.667 | ||||
| 较高 | 低 | 0.763 | 0.224 | 0.013 | 0 | 0.612 | 0.343 | 0.045 | 0 | 0.565 | 0.371 | 0.065 | 0 | 0.500 | 0.431 | 0.069 | 0 | |||
| 较低 | 0.095 | 0.784 | 0.115 | 0.007 | 0.176 | 0.664 | 0.130 | 0.031 | 0.216 | 0.560 | 0.181 | 0.043 | 0.176 | 0.490 | 0.284 | 0.049 | ||||
| 较高 | 0 | 0.096 | 0.801 | 0.103 | 0.007 | 0.179 | 0.701 | 0.112 | 0.025 | 0.256 | 0.579 | 0.140 | 0.028 | 0.239 | 0.550 | 0.183 | ||||
| 高 | 0.008 | 0.016 | 0.079 | 0.898 | 0.009 | 0.009 | 0.117 | 0.865 | 0.011 | 0 | 0.095 | 0.895 | 0.013 | 0 | 0.065 | 0.922 | ||||
| 高 | 低 | 1.000 | 0 | 0 | 0 | 1.000 | 0 | 0 | 0 | 1.000 | 0 | 0 | 0 | 1.000 | 0 | 0 | 0 | |||
| 较低 | 0 | 0.875 | 0.125 | 0 | 0 | 0.786 | 0.214 | 0 | 0.077 | 0.692 | 0.154 | 0.077 | 0.091 | 0.636 | 0.182 | 0.091 | ||||
| 较高 | 0 | 0.015 | 0.788 | 0.197 | 0 | 0.085 | 0.627 | 0.288 | 0 | 0.115 | 0.519 | 0.365 | 0 | 0.154 | 0.462 | 0.385 | ||||
| 高 | 0 | 0 | 0.139 | 0.861 | 0 | 0 | 0.176 | 0.824 | 0 | 0 | 0.245 | 0.755 | 0 | 0 | 0.226 | 0.774 | ||||
表5 收敛模型识别检验Tab. 5 Identification tests of convergent models |
| 类型/参数 | 是否为SLM模型检验 | 是否为SEM模型检验 | |||||
|---|---|---|---|---|---|---|---|
| LM检验 | LR检验 | Wald检验 | LM检验 | LR检验 | Wald检验 | ||
| 绝对β收敛 | 58.472*** [< 0.001] | 2.915* [0.088] | 1.874 [0.171] | 58.951*** [< 0.001] | 0.856 [0.355] | 1.526 [0.217] | |
| 条件β收敛 | 54.691*** [< 0.001] | 16.971*** [0.009] | 16.621** [0.011] | 56.728*** [< 0.001] | 15.179** [0.019] | 9.540 [0.145] | |
注:*、**、***分别表示10%、5%、1%的显著性水平,中括号内为p值,下表同。 |
表6 长江上游地区环境压力的绝对β收敛检验结果Tab. 6 Absolute β convergence test results in the upper reaches of the Yangtze River |
| 变量/模型 | 传统β收敛 | 空间β收敛 | |||||||
|---|---|---|---|---|---|---|---|---|---|
| 1998—2021 | 1998—2006 | 2007—2014 | 2015—2021 | 1998—2021 | 1998—2006 | 2007—2014 | 2015—2021 | ||
| β | -0.260*** | -0.727*** | -0.273*** | -0.818*** | -0.266*** | -0.752*** | -0.292*** | -0.830*** | |
| (0.022) | (0.051) | (0.038) | (0.067) | (0.021) | (0.048) | (0.035) | (0.060) | ||
| ρ | 0.137*** | 0.069 | 0.167** | 0.232*** | |||||
| (0.045) | (0.081) | (0.076) | (0.078) | ||||||
| ϕ | 0.076* | 0.305*** | 0.148** | 0.260** | |||||
| (0.044) | (0.111) | (0.068) | (0.122) | ||||||
| 时间固定 | YES | YES | YES | YES | YES | YES | YES | YES | |
| 个体固定 | YES | YES | YES | YES | YES | YES | YES | YES | |
| N | 1081 | 376 | 329 | 282 | 1081 | 376 | 329 | 282 | |
| R2 | 0.223 | 0.453 | 0.226 | 0.480 | 0.131 | 0.391 | 0.158 | 0.366 | |
| s | 0.013 | 0.162 | 0.046 | 0.284 | 0.013 | 0.174 | 0.049 | 0.296 | |
| τ | 53.017 | 4.271 | 15.227 | 2.440 | 51.614 | 3.982 | 14.070 | 2.345 | |
| Hausman 检验 | 117.201*** | 117.839*** | 53.210*** | 90.454*** | 148.833*** | 214.819*** | 100.818*** | 191.467*** | |
| [< 0.001] | [< 0.001] | [< 0.001] | [0< 0.001] | [< 0.001] | [< 0.001] | [< 0.001] | [< 0.001] | ||
注:括号内为标准误,下表同。 |
表7 长江上游地区环境压力的条件β收敛检验结果Tab. 7 Conditional β convergence test results |
| 变量/模型 | 传统β收敛 | 空间β收敛 | |||||||
|---|---|---|---|---|---|---|---|---|---|
| 1998—2021 | 1998—2006 | 2007—2014 | 2015—2021 | 1998—2021 | 1998—2006 | 2007—2014 | 2015—2021 | ||
| β | -0.265*** | -0.722*** | -0.299*** | -0.877*** | -0.288*** | -0.741*** | -0.355*** | -0.889*** | |
| (0.022) | (0.053) | (0.039) | (0.066) | (0.022) | (0.048) | (0.039) | (0.060) | ||
| ρ | 0.124*** | 0.071 | 0.047 | 0.203** | |||||
| (0.045) | (0.082) | (0.080) | (0.080) | ||||||
| ϕ | 0.043 | 0.280** | -0.009 | 0.254** | |||||
| (0.048) | (0.120) | (0.088) | (0.129) | ||||||
| pgdp | 0.179*** | 0.053 | 0.422 | 0.228 | 0.180** | 0.230** | 0.110 | 0.298 | |
| (0.058) | (0.075) | (0.339) | (0.234) | (0.079) | (0.117) | (0.337) | (0.221) | ||
| ladder | -0.112 | -0.237 | 0.091 | -0.153 | -0.082 | -0.190 | 0.217 | -0.218* | |
| (0.068) | (0.184) | (0.338) | (0.130) | (0.071) | (0.169) | (0.342) | (0.125) | ||
| indus | -0.930*** | -0.846 | -1.618 | -0.119 | -0.473 | -0.947 | 0.183 | -0.564 | |
| (0.351) | (1.092) | (1.474) | (0.743) | (0.399) | (1.008) | (1.551) | (0.788) | ||
| consum | -0.015 | -0.044 | 0.570 | -0.788*** | -0.007 | -0.050 | 0.518 | -0.650** | |
| (0.074) | (0.089) | (0.681) | (0.242) | (0.072) | (0.081) | (0.653) | (0.282) | ||
| invest | -0.052 | 0.108 | -0.072 | 0.105 | -0.139 | 0.060 | -0.063 | 0.067 | |
| (0.040) | (0.229) | (0.083) | (0.150) | (0.056) | (0.219) | (0.098) | (0.161) | ||
| 时间固定 | YES | YES | YES | YES | YES | YES | YES | YES | |
| 个体固定 | YES | YES | YES | YES | YES | YES | YES | YES | |
| N | 1081 | 376 | 329 | 282 | 1081 | 376 | 329 | 282 | |
| R2 | 0.234 | 0.458 | 0.256 | 0.524 | 0.110 | 0.419 | 0.165 | 0.472 | |
| s | 0.013 | 0.160 | 0.051 | 0.350 | 0.015 | 0.169 | 0.063 | 0.366 | |
| τ | 51.875 | 4.334 | 13.664 | 1.981 | 46.884 | 4.109 | 11.059 | 1.893 | |
| Hausman 检验 | 125.261*** | 112.408*** | 63.083*** | 99.831*** | 166.841*** | 211.209*** | 125.885*** | 88.263*** | |
| [< 0.001] | [< 0.001] | [< 0.001] | [< 0.001] | [< 0.001] | [< 0.001] | [< 0.001] | [< 0.001] | ||
| [1] |
[牛方曲, 孙东琪. 资源环境承载力与中国经济发展可持续性模拟. 地理学报, 2019, 74(12): 2604-2613.]
|
| [2] |
[徐福留, 赵珊珊, 杜婷婷, 等. 区域经济发展对生态环境压力的定量评价. 中国人口·资源与环境, 2004, 14(4): 30-36.]
|
| [3] |
[胡美娟, 李在军, 丁正山, 等. 泛长三角城市资源环境压力演化特征及门槛效应. 地理科学, 2020, 40(5): 701-709.]
|
| [4] |
[周正柱, 王俊龙. 长江经济带生态环境压力、状态及响应耦合协调发展研究. 科技管理研究, 2019, 39(17): 234-240.]
|
| [5] |
[郝汉舟, 郑威, 钟学斌, 等. 武汉市城市化过程中资源环境压力测度与分析. 长江流域资源与环境, 2017, 26(12): 2040-2048.]
|
| [6] |
|
| [7] |
[戴铁军, 王婉君, 刘瑞. 中国社会经济系统资源环境压力的时空差异. 资源科学, 2017, 39(10): 1942-1955.]
|
| [8] |
[章恒全, 陈卓然, 张陈俊. 长江经济带工业水环境压力与经济增长脱钩努力研究. 地域研究与开发, 2019, 38(2): 13-18, 30.]
|
| [9] |
|
| [10] |
|
| [11] |
[王世豪, 黄麟, 徐新良, 等. 特大城市群生态空间及其生态承载状态的时空分异. 地理学报, 2022, 77(1): 164-181.]
|
| [12] |
|
| [13] |
[王娟, 蔺雪芹, 周笑, 等. 环渤海地区工业资源环境压力时空演化特征及影响因素. 环境污染与防治, 2021, 43(7): 915-920.]
|
| [14] |
|
| [15] |
|
| [16] |
[杨欣雨, 牛方曲. 辽宁省城市化进程与资源环境压力时空耦合过程研究. 世界地理研究, 2022, 31(2): 317-328.]
|
| [17] |
[彭红松, 郭丽佳, 章锦河, 等. 区域经济增长与资源环境压力的关系研究进展. 资源科学, 2020, 42(4): 593-606.]
|
| [18] |
[赵正. 北京市经济增长与环境压力脱钩分析. 城市问题, 2017(9): 48-54.]
|
| [19] |
|
| [20] |
[胡美娟, 孙萍, 李在军, 等. 长三角城市经济增长与资源环境压力的脱钩效应. 世界地理研究, 2022, 31(3): 538-548.]
|
| [21] |
|
| [22] |
[李倩, 苏泳娴, 温兴平, 等. 基于能值生态足迹的粤港澳大湾区环境压力与经济发展脱钩效应. 生态科学, 2023, 42(3): 190-201.]
|
| [23] |
|
| [24] |
[柏玲, 姜磊, 刘耀彬. 长江中游城市群环境压力的时空特征: 以工业SO2排放为例. 经济地理, 2017, 37(3): 174-181.]
|
| [25] |
|
| [26] |
[聂国卿, 尹向飞, 邓柏盛. 基于STIRPAT模型的环境压力影响因素及其演进分析: 以湖南省为例. 系统工程, 2012, 30(5): 112-116.]
|
| [27] |
|
| [28] |
[周笑, 王鹏飞. 中国工业发展的资源环境压力空间分异演化及影响因素. 地理研究, 2018, 37(8): 1541-1557.]
|
| [29] |
|
| [30] |
[张卓群, 张涛, 冯冬发. 中国碳排放强度的区域差异、动态演进及收敛性研究. 数量经济技术经济研究, 2022, 39(4): 67-87.]
|
| [31] |
[穆学青, 郭向阳, 明庆忠, 等. 黄河流域旅游生态安全的动态演变特征及驱动因素. 地理学报, 2022, 77(3): 714-735.]
|
| [32] |
[王少剑, 高爽, 黄永源, 等. 基于超效率SBM模型的中国城市碳排放绩效时空演变格局及预测. 地理学报, 2020, 75(6): 1316-1330.]
|
| [33] |
|
| [34] |
[张敏, 杨励雅, 胡卓玮, 等. 长江经济带城市扩张的时空分异特征及影响机制. 地理学报, 2024, 79(2): 439-461.]
|
| [35] |
[方世敏, 黄琰. 长江经济带旅游效率与规模的时空演化及耦合协调. 地理学报, 2020, 75(8): 1757-1772.]
|
/
| 〈 |
|
〉 |