
全球冰川融水无机化学研究进展
|
闫玉强(1999-), 山西大同人, 硕士生, 主要从事冰川水化学研究。E-mail: 2464145069@qq.com |
收稿日期: 2023-09-04
修回日期: 2024-05-09
网络出版日期: 2024-05-31
基金资助
国家自然科学基金项目(42171123)
国家自然科学基金项目(41671053)
冻土工程国家重点实验室开放基金项目(SKLFSE201901)
Progress on inorganic chemistry of glacial meltwater in the world
Received date: 2023-09-04
Revised date: 2024-05-09
Online published: 2024-05-31
Supported by
National Natural Science Foundation of China(42171123)
National Natural Science Foundation of China(41671053)
State Key Laboratory of Frozen Soil Engineering Open Fund Project(SKLFSE201901)
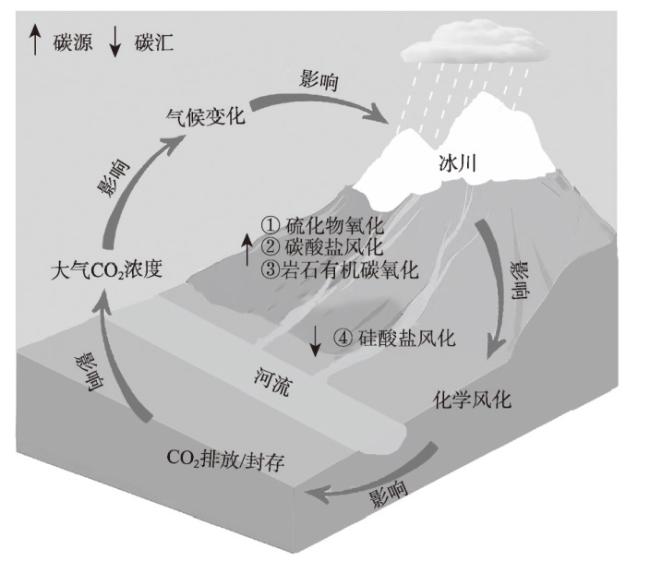
冰川融水是营养盐与生物活性元素运移的主要载体。融水化学是研究冰川排水系统及其动态变化特征,洞悉生物地球化学循环过程,探索冰川消退与气候变化关系的重要手段。随着冰川加速消融,侵蚀风化作用日益增强,融水化学特征发生了明显变化,对下游水质水环境和生态系统可能产生显著影响。回顾了全球冰川融水中无机化学成分含量及其时空变化特征、溶质来源及其比例、化学风化与碳循环关系,发现融水化学受基岩性质、排水系统、物理化学和地形地貌等多种因素影响。未来需要加强融水无机和有机化学参数与水文气象要素的同步连续监测,评估冰川源溶质的环境生态效应,探究冰川区化学风化作用耦合机制与溶质输移和大气CO2收支的关系,为未来冰冻圈与碳循环和气候演化关系研究提供参考。
闫玉强 , 李向应 , 刘莎 , 杨瑞 , 苏茜蕊 , 易童 . 全球冰川融水无机化学研究进展[J]. 地理学报, 2024 , 79(5) : 1129 -1145 . DOI: 10.11821/dlxb202405003
Glacial meltwater is a major carrier of nutrients and bioactive compounds, and meltwater chemistry is an important way to study the glacier drainage system and its dynamic characteristics to gain insights into the biogeochemical cycling process and explore the relationship between deglaciation and climate change. With accelerated melting of glaciers and increases in erosion and weathering, meltwater chemistry has undergone significant changes, which may have significant impacts on downstream water quality, the water environment, and ecosystems. In this study, the contents of inorganic chemical components and their spatial and temporal variations, solute sources and their proportions, and the relationship between chemical weathering and carbon cycling in global glacial meltwater were reviewed. The results indicated that meltwater chemistry is affected by various factors, such as the nature of the bedrock, the drainage system, the physical chemistry, and the topography and geomorphology. To provide references for future research on the relationships among the cryosphere, carbon cycle, and climate change, it is essential to strengthen simultaneous and continuous monitoring of hydrometeorological parameters and inorganic and organic chemical components in meltwater, evaluate the ecological and environmental effects of solutes sourced from glaciers, and examine the relationships among the coupled mechanisms of chemical weathering in glacial regions, solute mobilisation, and atmospheric CO2 balance.
Key words: inorganic chemistry; chemical weathering; meltwaters; glacier
表1 全球冰川融水中pH、EC、TDS和主要离子的平均浓度/平均值Tab. 1 Mean values/concentrations of pH, EC, TDS and ions in meltwater draining glaciers in the world |
| 区域 | pH | EC (μS/cm) | TDS (mg/L) | Ca2+ (mg/L) | Mg2+ (mg/L) | Na+ (mg/L) | K+ (mg/L) | HCO3- (mg/L) | SO42- (mg/L) | Cl- (mg/L) | NO3- (mg/L) | 冰川 条数 (条) | 样品 个数 (个) |
|---|---|---|---|---|---|---|---|---|---|---|---|---|---|
| 阿拉斯加 | 8.75±4.38 | 85.2±60.2 | N/A | 15.9±4.22 | 1.48±0.75 | 1.17±0.68 | 0.99±0.94 | 39.7±19.7 | 15.6±5.81 | 5.64±9.84 | 0.02±0.01 | 3 | > 160 |
| 加拿大/美国西部 | 7.50±N/A | N/A | N/A | 4.32±5.10 | 0.77±1.42 | 0.34±0.30 | 0.39±0.35 | 14.0±18.0 | 1.83±1.67 | 0.36±0.34 | 0.18±0.11 | 6 | 132 |
| 北极加拿大北部 | 6.48±N/A | 19.1±N/A | N/A | 22.8±13.7 | 1.57±0.72 | 0.91±0.30 | 0.44±0.04 | 19.4±3.42 | 57.2±36.6 | 0.60±N/A | 0.39±N/A | 2 | 49 |
| 格陵兰边缘 | 8.05±4.21 | 9.70±2.93 | 8.00±2.41 | 1.72±1.02 | 0.45±0.56 | 0.98±1.00 | 0.68±0.62 | 13.1±9.03 | 1.62±1.01 | 0.44±0.33 | 0.28±0.25 | 9 | 323 |
| 格陵兰冰盖 | 7.96±4.17 | 9.71±3.07 | 7.99±2.53 | 1.58±0.96 | 0.41±0.57 | 0.82±0.87 | 0.74±0.62 | 11.7±8.40 | 1.82±1.04 | 0.37±0.27 | 0.13±0.09 | 8 | >269 |
| 冰岛 | 8.31±4.08 | 152±N/A | 113 | 11.3±6.61 | 1.36±0.77 | 4.16±2.31 | 0.3±0.13 | 15.8±N/A | 3.39±1.56 | 0.59±N/A | N/A | 2 | 19 |
| 斯瓦尔巴 | 7.78±4.51 | N/A | N/A | 13.4±5.75 | 5.04±3.32 | 10.3±7.65 | 0.65±0.35 | 31.4±17.4 | 42.2±44.5 | 5.80±5.17 | 0.53±0.59 | 5 | 331 |
| 斯堪的纳维亚 | N/A | N/A | N/A | 1.53±1.81 | 0.26±0.16 | 1.06±0.89 | 0.43±0.30 | N/A | N/A | N/A | N/A | 2 | 2 |
| 北亚 | 8.32±N/A | N/A | N/A | 15.0±N/A | 1.83±N/A | 0.46±N/A | 0.80±N/A | 45.1±N/A | 13.7±N/A | 0.73±N/A | 0.47±N/A | 1 | 1 |
| 中亚 | 7.98±2.01 | 93.1±66.3 | 63.1±55.1 | 14.5±8.44 | 4.07±6.43 | 2.89±6.09 | 1.34±1.41 | 35.1±20.6 | 19.0±14.2 | 1.47±2.56 | 1.46±1.56 | 22 | >1686 |
| 南亚(西) | 7.26±0.68 | 76.7±35.9 | 58.2±28.4 | 9.29±5.65 | 1.82±1.15 | 0.99±0.45 | 1.80±0.63 | 25.4±13.8 | 13.1±8.40 | 0.51±0.18 | 0.79±0.62 | 12 | 941 |
| 南亚(东) | 7.04±0.76 | 82.9±27.8 | 49.9±16.3 | 8.47±3.07 | 3.01±2.17 | 2.09±1.58 | 2.18±0.93 | 35.7±29.5 | 16.7±9.96 | 2.31±2.22 | 0.80±0.80 | 14 | 1222 |
| 欧洲中部 | 7.68±4.16 | N/A | N/A | 5.99±7.16 | 2.44±2.06 | 0.31±0.14 | 0.52±0.23 | 27.4±21.4 | 6.49±5.15 | 0.22±0.16 | 0.96±0.62 | 5 | 363 |
| 低纬度 | 4.48±N/A | N/A | N/A | 16.1±6.05 | 3.65±3.23 | 1.35±0.37 | 0.52±0.08 | N/A | 68.4±31.9 | 0.07±0.05 | N/A | 2 | 32 |
| 南安第斯 | 7.47±0.94 | 107±73.0 | N/A | 12.3±8.13 | 1.89±1.45 | 1.84±1.26 | 0.37±0.23 | 41.9±33.2 | 23.5±19.7 | 0.69±0.61 | 3.13±1.82 | 2 | 3 |
| 南极/亚南极 | 8.05±0.68 | N/A | N/A | 11.1±6.45 | 2.04±1.19 | 5.96±4.36 | 1.74±1.03 | 15.8±6.46 | 9.33±8.08 | 47.8±19.5 | 0.60±0.24 | 6 | 77 |
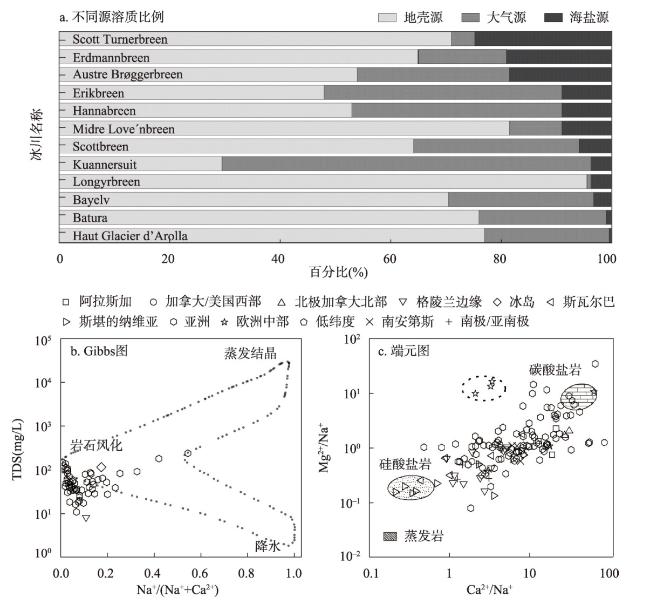
| 全球冰川a | 7.54±3.34 | 85.3±57.5 | 58.9±42.3 | 10.5±7.86 | 2.64±3.93 | 2.28±4.10 | 1.33±1.18 | 30.8±27.2 | 17.7±19.9 | 2.19±5.29 | 0.96±1.11 | 85 | > 5018 |
注:N/A指没有数据,a指冰盖以外所有冰川(不包括冰盖边缘的溢出冰川)。 |
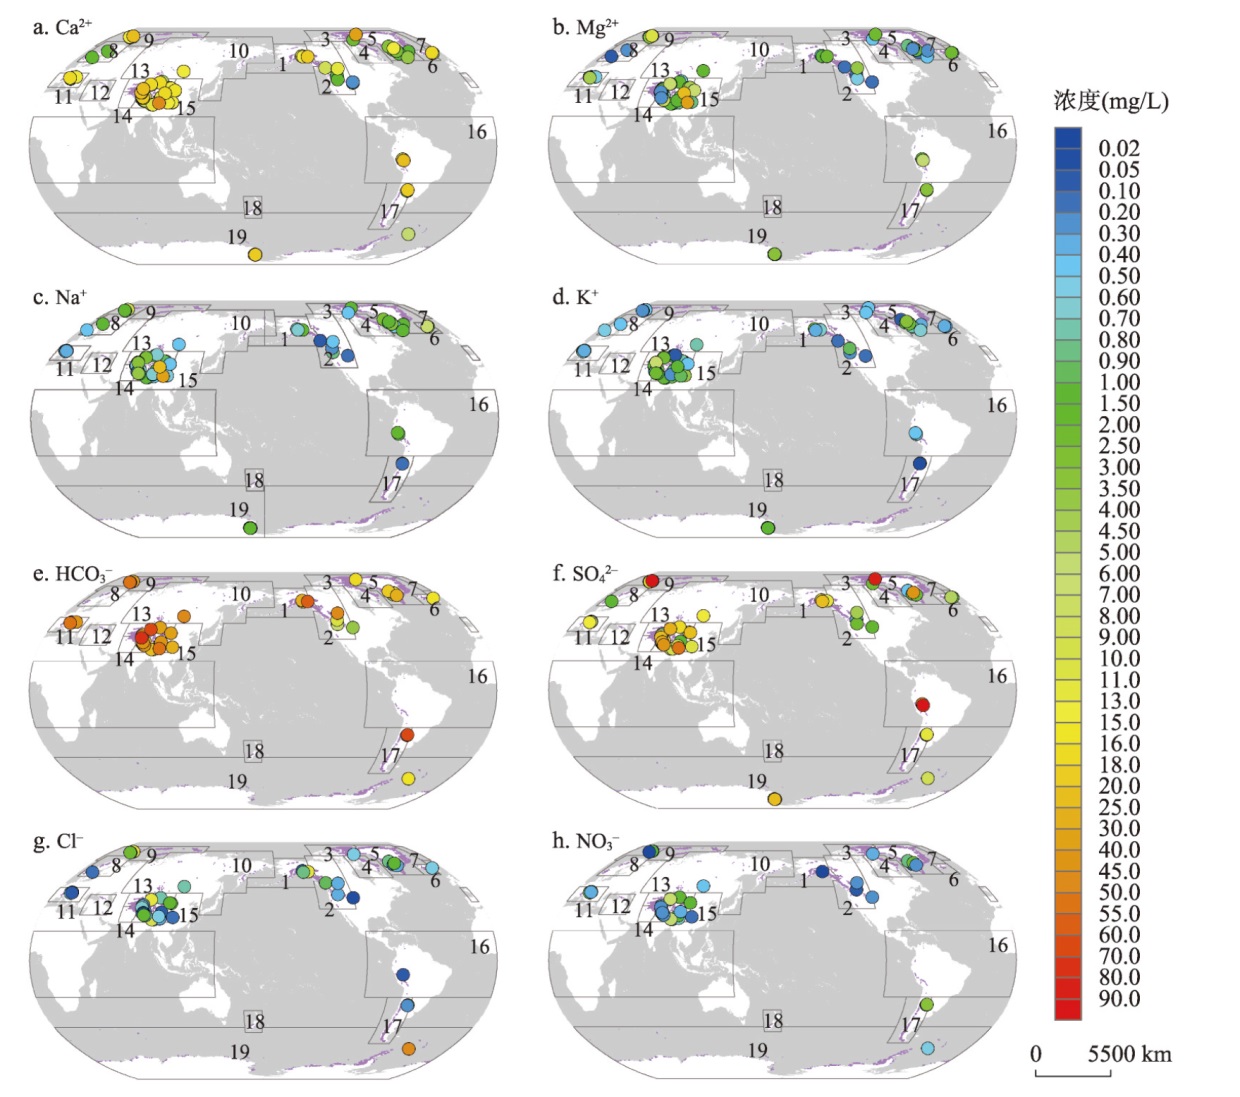
图1 全球冰川融水中主要离子平均浓度的空间变化注:资料分布在15个冰川区,包括:1阿拉斯加、2加拿大/美国西部、3北极加拿大北部、5格陵兰边缘、6冰岛、7斯瓦尔巴、8斯堪的纳维亚、10北亚、11欧洲中部、13中亚、14南亚西部、15南亚东部、16低纬度、17南安第斯和19南极/亚南极;无资料冰川区包括:4北极加拿大南部、9俄罗斯北极、12高加索和中东和18新西兰;紫色指示冰川;数据来自文献[25]。 Fig. 1 Spatial variation of mean concentrations for major ions in meltwater draining glaciers in the world |
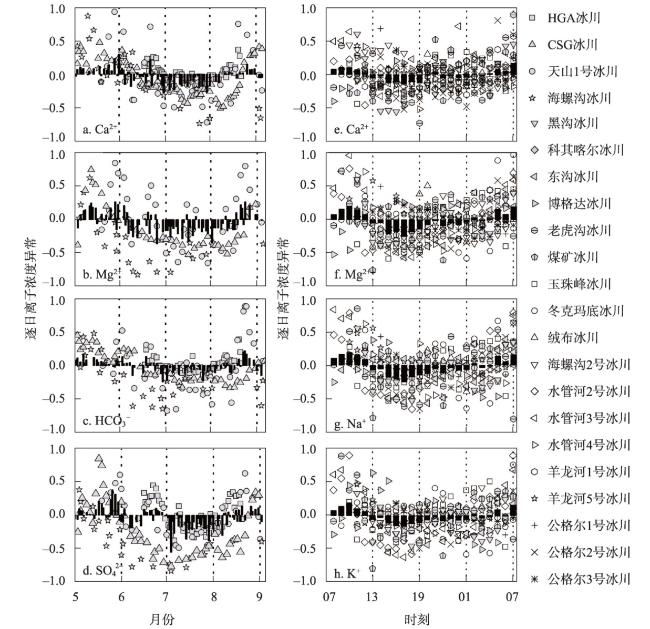
图4 典型冰川融水中主要离子浓度的季节和日变化注:黑色柱状图为所有冰川逐日(时)离子浓度平均异常,逐日(时)浓度异常指日(时)浓度与采样期所有样品平均浓度之差除以采样期中所有样品平均浓度;季节变化包括4条冰川,分别为采样于1999年瑞士Haut Glacier d'Arolla冰川(HGA)、2006年中国天山1号冰川、2008年中国海螺沟冰川和2010年印度Chhota Shigri冰川(CSG);日变化包括19条冰川,采样于2007—2008年;数据来自文献[56,76,81,87]。 Fig. 4 Seasonal and diurnal variations of major ion concentrations in typical meltwater draining glaciers |
感谢课题组苏昊海、雷田旺、彭淑鑫、邓春燕、张凯强、惠俞翔、王泓杰、刘皓月在文章修改方面提供的帮助;特别感谢编辑老师和审稿专家对本文的修改与完善所给予的宝贵建议。
| [1] |
|
| [2] |
|
| [3] |
[王宗侠, 刘苏峡. 1990—2020年天山北坡地下水储量估算及其时空演变规律. 地理学报, 2023, 78(7): 1744-1763.]
|
| [4] |
[李明月, 孙学军, 李胜楠, 等. 青藏高原及其周边地区冰川融水无机水化学特征研究进展. 冰川冻土, 2020, 42(2): 562-574.]
|
| [5] |
|
| [6] |
|
| [7] |
|
| [8] |
|
| [9] |
|
| [10] |
|
| [11] |
|
| [12] |
|
| [13] |
|
| [14] |
|
| [15] |
|
| [16] |
|
| [17] |
|
| [18] |
|
| [19] |
[王诗语, 孙从建, 陈伟, 等. 基于水化学及径流组成的中国西北内陆河流域水资源风险评估. 地理学报, 2023, 78(11): 2763-2780.]
|
| [20] |
|
| [21] |
IPCC. Special Report on the Ocean and Cryosphere in a Changing Limate. New York: Cambridge University Press, 2019.
|
| [22] |
[李耀军, 丁永建, 上官冬辉, 等. 1961—2016年全球变暖背景下冰川物质亏损加速度研究. 中国科学: 地球科学, 2021, 51(3): 453-464.]
|
| [23] |
[钟歆玥, 康世昌, 郭万钦, 等. 最近十多年来冰冻圈加速萎缩: IPCC第六次评估报告之冰冻圈变化解读. 冰川冻土, 2022, 44(3): 946-953.]
|
| [24] |
[赵贵宁, 张正勇, 刘琳, 等. 基于多源遥感数据的玛纳斯河流域冰川物质平衡变化. 地理学报, 2020, 75(1): 98-112.]
|
| [25] |
|
| [26] |
|
| [27] |
|
| [28] |
|
| [29] |
|
| [30] |
|
| [31] |
|
| [32] |
|
| [33] |
|
| [34] |
|
| [35] |
|
| [36] |
|
| [37] |
|
| [38] |
|
| [39] |
|
| [40] |
|
| [41] |
|
| [42] |
|
| [43] |
|
| [44] |
|
| [45] |
|
| [46] |
|
| [47] |
|
| [48] |
|
| [49] |
|
| [50] |
|
| [51] |
|
| [52] |
|
| [53] |
|
| [54] |
|
| [55] |
|
| [56] |
|
| [57] |
|
| [58] |
|
| [59] |
|
| [60] |
|
| [61] |
|
| [62] |
|
| [63] |
|
| [64] |
[皇翠兰, 蒲健辰. 西大滩煤矿冰川区冰川冰、雪和河水的阳离子特征. 冰川冻土, 1995, 17(3): 283-288.]
|
| [65] |
|
| [66] |
|
| [67] |
|
| [68] |
|
| [69] |
|
| [70] |
[王圣杰, 张明军, 王飞腾, 等. 雪冰中NO3-浓度记录的研究进展. 冰川冻土, 2010, 32(6): 1162-1169.]
|
| [71] |
|
| [72] |
|
| [73] |
[刘峰, 李忠勤, 郝嘉楠, 等. 天山哈密榆树沟6号冰川积雪化学特征及环境意义. 环境化学, 2020, 39(9): 2498-2506.]
|
| [74] |
|
| [75] |
|
| [76] |
|
| [77] |
|
| [78] |
[何晓波, 丁永建, 刘时银, 等. 慕士塔格卡尔塔马克冰川水文观测与特征分析. 冰川冻土, 2005, 27(2): 262-268.]
|
| [79] |
[武小波, 李全莲, 宋高举, 等. 祁连山七一冰川融水化学组成及演化特征. 环境科学, 2008, 29(3): 613-618.]
|
| [80] |
[赵华标, 姚檀栋, 徐柏青. 塔格卡尔塔马克冰川作用区的水文与水化学特征. 冰川冻土, 2006, 28(2): 269-275.]
|
| [81] |
|
| [82] |
|
| [83] |
|
| [84] |
|
| [85] |
|
| [86] |
[宋玲玲, 田青, 李宗杰, 等. 昆仑山玉珠峰冰川冰雪融水水化学特征分析. 环境化学, 2019, 38(8): 1864-1871.]
|
| [87] |
|
| [88] |
|
| [89] |
[赵爱芳, 张明军, 李忠勤, 等. 冰滩72号冰川径流水化学特征初步研究. 环境科学, 2012, 33(5): 1484-1490.]
|
| [90] |
|
| [91] |
|
| [92] |
|
| [93] |
|
| [94] |
|
| [95] |
|
| [96] |
|
| [97] |
[李向应, 王宁练, 丁永建, 等. 硅酸盐、碳酸盐和硫化物共同风化促使CO2排放. 科学通报, 2022, 67(23): 2704-2707.]
|
| [98] |
|
| [99] |
|
| [100] |
|
| [101] |
|
| [102] |
|
| [103] |
|
| [104] |
|
| [105] |
|
| [106] |
|
| [107] |
|
| [108] |
|
| [109] |
|
| [110] |
[李铮, 钟君, 李思亮, 等. 青藏高原北部典型冰川流域化学风化研究. 地理学报, 2023, 78(7): 1792-1808.]
|
| [111] |
|
| [112] |
|
| [113] |
|
/
| 〈 |
|
〉 |