
澜沧江—湄公河流域干旱趋势及其对生态系统碳固定的影响
|
陈世亮(1999-), 男, 贵州铜仁人, 硕士生, 主要从事生态系统变化与生态模拟相关工作。E-mail: Hugoliang@cug.edu.cn |
收稿日期: 2023-05-23
修回日期: 2024-02-01
网络出版日期: 2024-04-02
基金资助
中国地质大学(武汉)“地大学者”人才岗位科研启动经费(2019004)
生态环境部对外合作与交流中心澜沧江—湄公河流域项目
Drought trend and its impact on ecosystem carbon sequestration in Lancang-Mekong River Basin
Received date: 2023-05-23
Revised date: 2024-02-01
Online published: 2024-04-02
Supported by
The "CUG Scholar" Scientific Research Funds at China University of Geosciences(2019004)
Lancang-Mekong River Basin Project supported by the Foreign Environmental Cooperation Center of the Ministry of Ecology and Environment
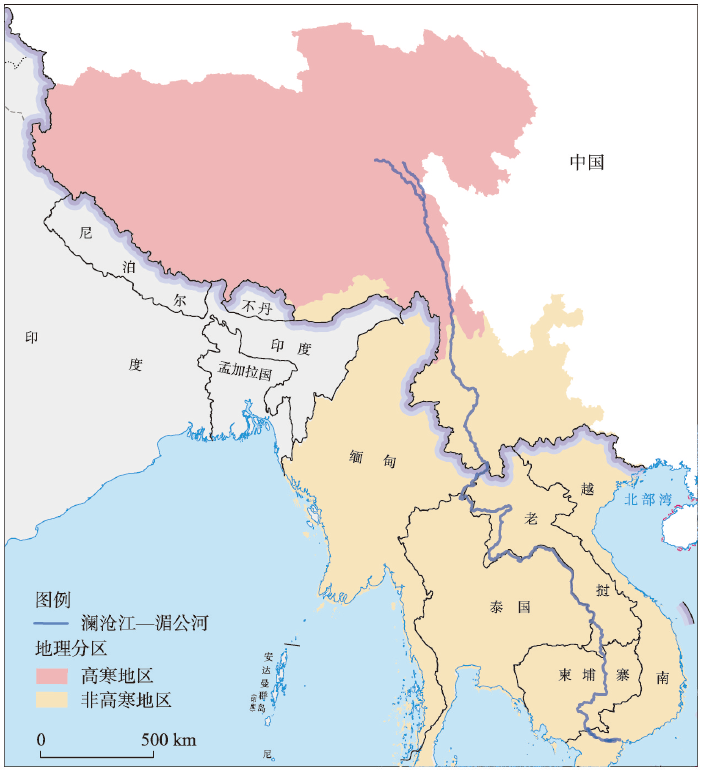
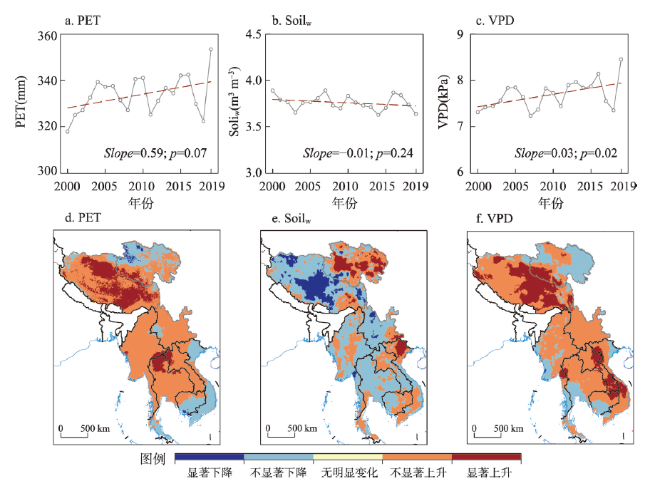
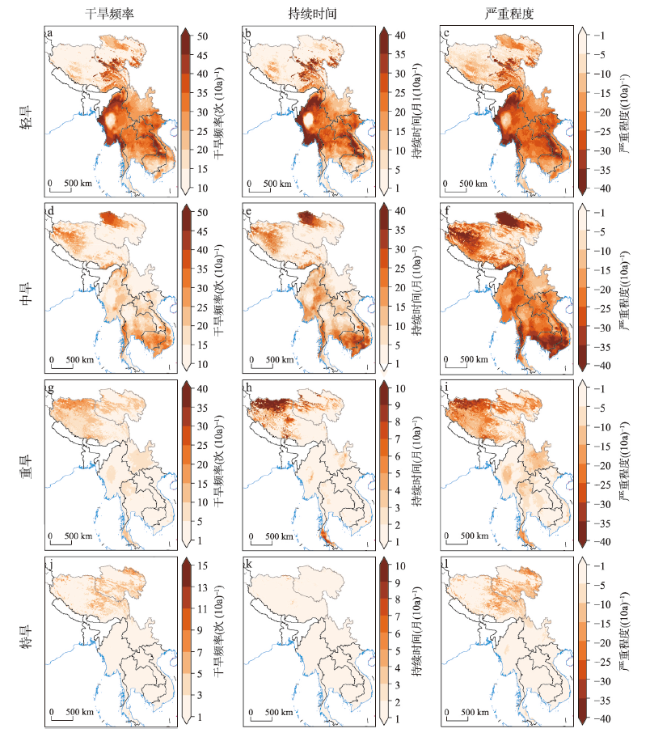
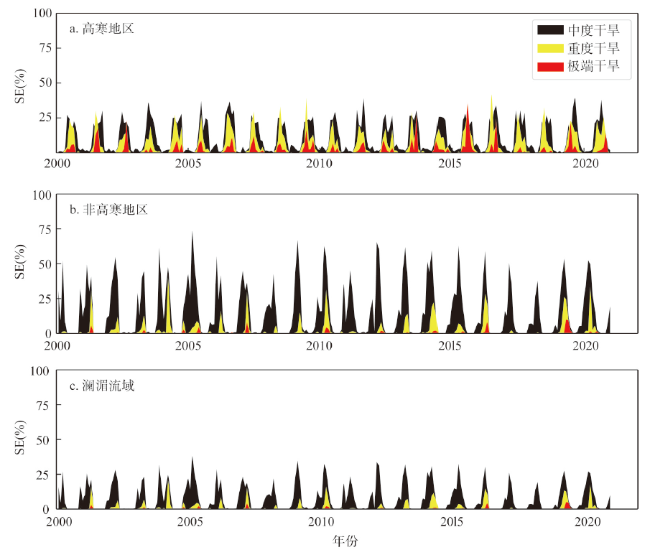
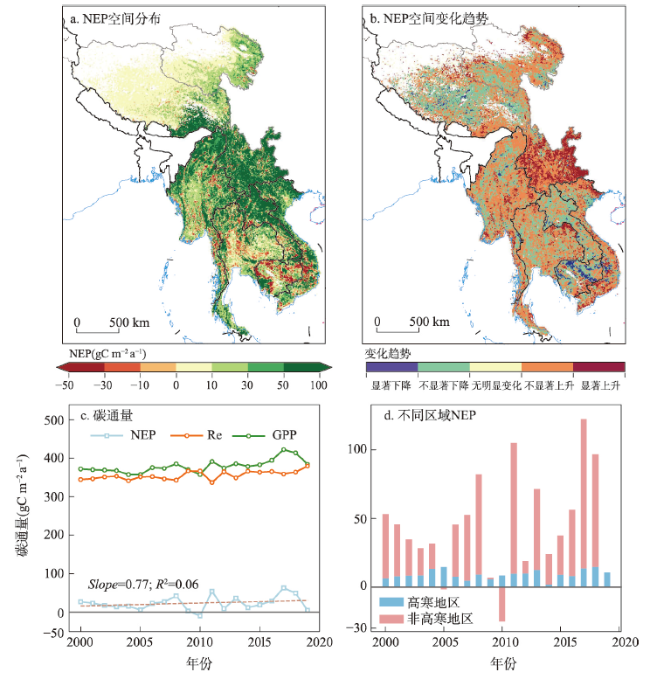
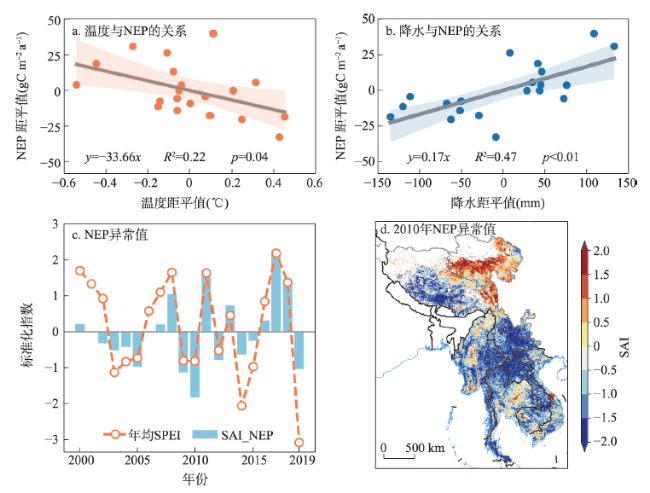
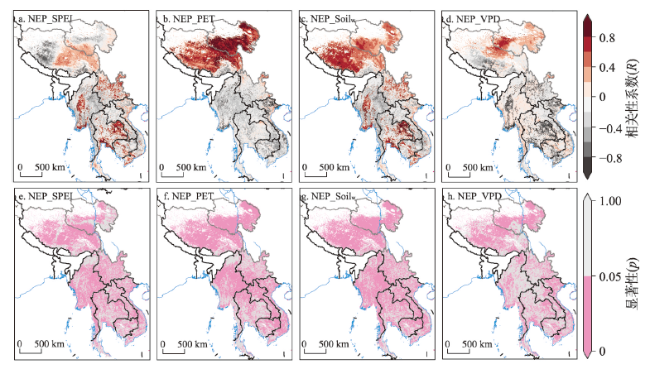
全球变暖导致干旱事件频发,强度不断增大,对陆地生态系统碳收支产生了重大影响。本文评估了2000—2019年澜沧江—湄公河(澜湄)流域的干旱趋势,并通过标准化异常指数(SAI)、标准化降水蒸散指数(SPEI)、潜在蒸散(PET)、饱和水汽压差(VPD)和土壤水分(Soilw)评价了干旱对该流域净生态系统生产力(NEP)的影响。结果表明:① 2000—2019年澜湄流域向暖干化发展,主要受降水减少的影响,近1/4的区域遭受了中度以上干旱,其中2009—2016年间干旱事件频发,干旱热点地区位于澜沧江上游和湄公河中下游地区;② 尽管澜湄流域碳汇整体上随着气候变暖而增加,但干旱年份植被光合作用降低,生态系统呼吸增加,导致2005年、2010年和2019年湄公河流域生态系统碳源汇发生转变,其中2010年干旱使得GPP减少5.68%,生态系统呼吸增加3.15%,NEP呈现重度异常;③ 干旱对流域NEP普遍具有滞后效应,整体滞后时间为1~4个月,面积占比为57.82%;④ 不同水文气候要素对NEP的影响表现出显著的空间差异,其中澜湄流域NEP与VPD整体呈负相关,云南省、缅甸西部、柬埔寨和越南南部的NEP与SPEI呈正相关,而青藏高原NEP主要受到土壤干旱的影响。干旱对澜湄流域生态系统碳固定的影响存在显著的空间异质性,量化干旱对碳固定的影响可以为气候变暖背景下澜湄流域不同地区的生态管理提供参考。
陈世亮 , 李霞 , 钱钊晖 , 王绍强 , 王苗苗 , 刘侦海 , 李卉 , 夏烨 , 赵紫祺 , 李亭谕 , 朱彤彤 , 陈璇 , 蒋赟浩 , 谷鹏 . 澜沧江—湄公河流域干旱趋势及其对生态系统碳固定的影响[J]. 地理学报, 2024 , 79(3) : 747 -764 . DOI: 10.11821/dlxb202403012
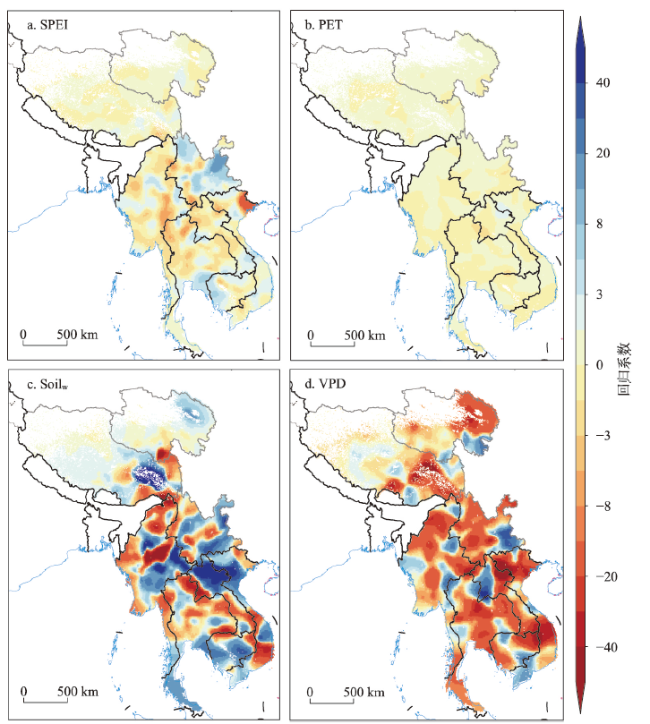
Global warming leads to increased frequency and severity of droughts, profoundly affecting the carbon budget of terrestrial ecosystems. We conducted a comprehensive assessment of drought trends within the Lancang-Mekong River Basin (LMRB) and quantified the impacts of standardized precipitation evapotranspiration index (SPEI), potential evapotranspiration (PET), vapor pressure deficit (VPD) and soil moisture (Soilw) on net ecosystem productivity (NEP) using geographically weighted regression (GWR) method. The GWR analysis demonstrated that drought indices have a significant impact on NEP. From 2000 to 2019, with the decrease of precipitation, LMRB experienced a rise in temperature and a drop in humidity, leading to moderate or extreme drought in around 25% of the LMRB, especially between 2009 and 2016. Drought hotspots were identified in the upper reaches of the Lancang River and the middle and lower reaches of the Mekong River. Drought events in 2005, 2010, and 2019 altered the carbon source/sink of the Mekong River Basin ecosystem by decreasing plant photosynthesis and increasing ecosystem respiration. In 2010, for example, drought reduced GPP by 5.68% and increased ecosystem respiration by 3.15%, resulting the anomalies of NEP. The impact of drought on NEP in the LMRB often exhibited a lag effect, with an overall lag duration of 1 to 4 months, covering approximately 57.82% of the area. Spatial differences of the influence of different hydroclimatic factors on NEP were observed. NEP was negatively correlated with VPD in the LMRB, and positively correlated with SPEI in China's Yunnan province, western Myanmar, Cambodia and southern Vietnam. The NEP in the Qinghai-Tibet Plateau was mainly affected by soil drought. This study highlights the significant spatial heterogeneity in the impact of drought on ecosystem carbon sequestration within the LMRB, providing essential insights for ecological management in drought-affected areas.
表1 基于SPEI的干旱等级划分Tab. 1 Drought severity classification based on SPEI |
| 干旱等级 | 干旱类型 | SPEI数值 |
|---|---|---|
| 1 | 正常 | SPEI > -0.5 |
| 2 | 轻旱 | -1.0 < SPEI ≤ -0.5 |
| 3 | 中旱 | -1.5 < SPEI ≤ -1.0 |
| 4 | 重旱 | -2.0 < SPEI ≤ -1.5 |
| 5 | 特旱 | SPEI ≤ -2.0 |
表2 澜湄流域及其次级区域干旱敏感性分析Tab. 2 Analysis of drought sensitivity in Lancang-Mekong River Basin and subregions |
| 区域 | 温度 | 降水 | R2 | p |
|---|---|---|---|---|
| 高寒地区 | -1.09 | 0.50 | 0.45 | < 0.001 |
| 非高寒地区 | -0.19 | 1.11 | 0.96 | < 0.001 |
| 全流域 | -0.59 | 1.35 | 0.72 | < 0.001 |
表3 OLS和GWR模型诊断结果Tab. 3 The results of the diagnosis analyses in OLS and GWR models |
| 诊断信息 | OLS | GWR |
|---|---|---|
| 残差绝对值总和 | 79527.19 | 52906.74 |
| AICc | 33270.59 | 329.70 |
| R2 | 0.21 | 0.90 |
| 调整后R2 | 0.21 | 0.88 |
注:AICc为校正后的赤池信息标准,作为衡量模型拟合优度的标准,AICc越小表示模型越好。 |
| [1] |
|
| [2] |
|
| [3] |
|
| [4] |
|
| [5] |
|
| [6] |
|
| [7] |
|
| [8] |
|
| [9] |
|
| [10] |
|
| [11] |
|
| [12] |
|
| [13] |
|
| [14] |
|
| [15] |
|
| [16] |
|
| [17] |
|
| [18] |
|
| [19] |
|
| [20] |
[ 韩松俊, 张宝忠. 基于Penman方法和互补原理的蒸散发研究历程与展望. 水利学报, 2018, 49(9): 1158-1168.]
|
| [21] |
|
| [22] |
|
| [23] |
|
| [24] |
|
| [25] |
|
| [26] |
|
| [27] |
|
| [28] |
[ 沈国强, 郑海峰, 雷振锋. SPEI指数在中国东北地区干旱研究中的适用性分析. 生态学报, 2017, 37(11): 3787-3795.]
|
| [29] |
|
| [30] |
|
| [31] |
|
| [32] |
[ 张天鹏, 保万魁, 雷秋良, 等. 1951—2010年中国土壤温度时空变化特征及其影响因素. 地理学报, 2022, 77(3): 589-602.]
|
| [33] |
|
| [34] |
|
| [35] |
[ 李卉, 朱彤彤, 刘侦海, 等. 东南亚沿海与内陆植被对洪水事件响应的稳定性差异. 生态学报, 2022, 42(16): 6745-6757.]
|
| [36] |
|
| [37] |
|
| [38] |
|
| [39] |
|
| [40] |
|
| [41] |
[ 范科科, 张强, 孙鹏, 等. 青藏高原地表土壤水变化、影响因子及未来预估. 地理学报, 2019, 74(3): 520-533.]
|
| [42] |
|
| [43] |
|
| [44] |
|
| [45] |
|
| [46] |
|
| [47] |
|
| [48] |
[ 朱彤彤, 王绍强, 李卉, 等. 中南半岛植被物候与极端降水的变化特征及关联. 热带地理, 2023, 43(3): 532-544.]
|
| [49] |
[ 汤秋鸿, 兰措, 苏凤阁, 等. 青藏高原河川径流变化及其影响研究进展. 科学通报, 2019, 64(27): 2807-2821.]
|
| [50] |
|
| [51] |
|
| [52] |
[ 刘媛媛, 李霞, 王小博, 等. 2001—2018年中国—老挝交通走廊核心区植被稳定性对极端干旱的响应. 生态学报, 2021, 41(7): 2537-2547.]
|
| [53] |
[ 董蕾, 李吉跃. 植物干旱胁迫下水分代谢、碳饥饿与死亡机理. 生态学报, 2013, 33(18): 5477-5483.]
|
| [54] |
|
| [55] |
|
| [56] |
|
| [57] |
|
| [58] |
|
| [59] |
|
| [60] |
|
| [61] |
|
| [62] |
|
| [63] |
|
/
| 〈 |
|
〉 |

