
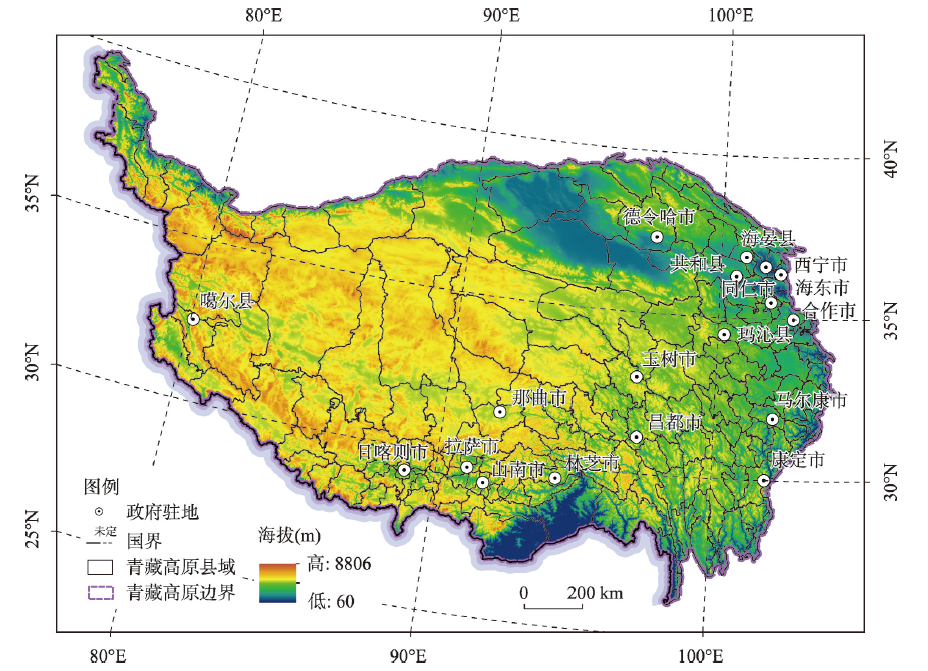
青藏高原县域尺度PM2.5浓度时空动态演进特征
|
刘庆芳(1994-), 女, 安徽天长人, 博士生, 主要从事城市与区域可持续发展研究。E-mail: m13155029850@163.com |
收稿日期: 2023-10-16
修回日期: 2024-03-08
网络出版日期: 2024-04-02
基金资助
第二次青藏高原综合科学考察研究(2019QZKK0406)
Spatio-temporal dynamic evolution of PM2.5 concentrations in the Qinghai-Tibet Plateau based on county scale
Received date: 2023-10-16
Revised date: 2024-03-08
Online published: 2024-04-02
Supported by
The Second Tibetan Plateau Scientific Expedition and Research(2019QZKK0406)
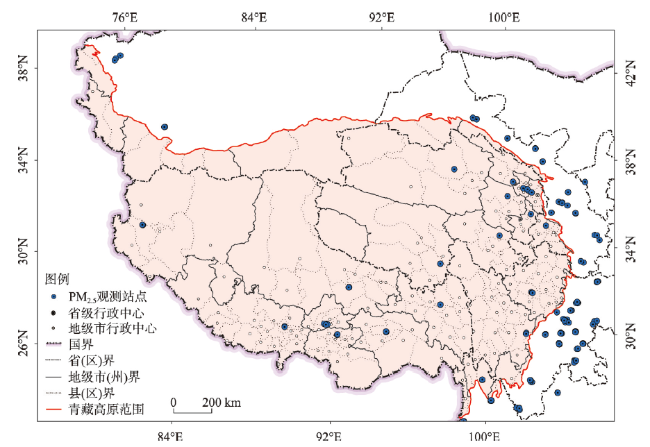
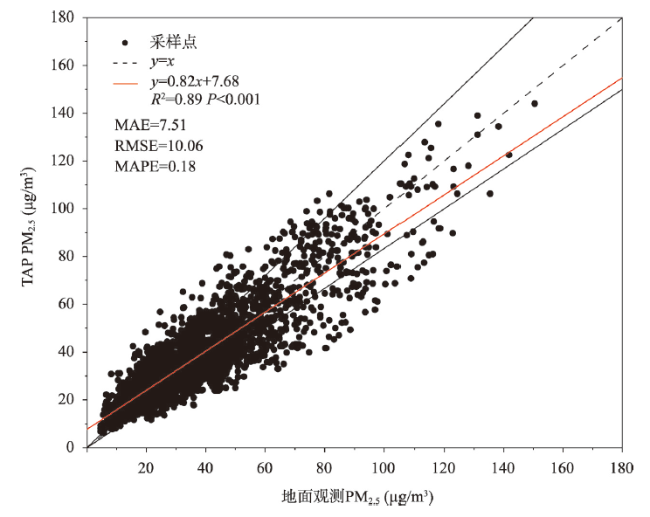
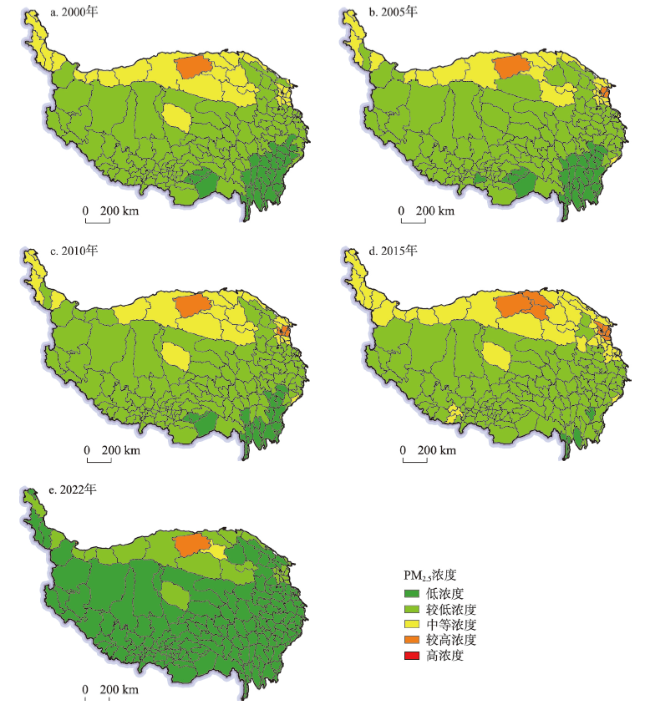
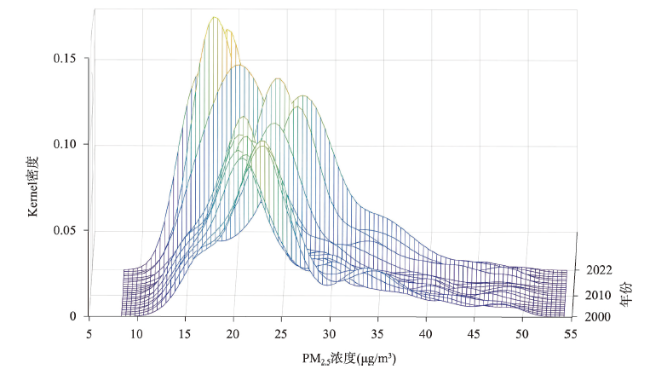
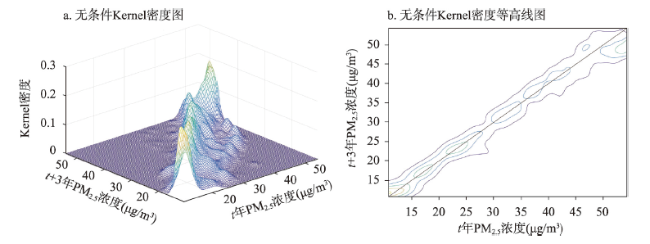
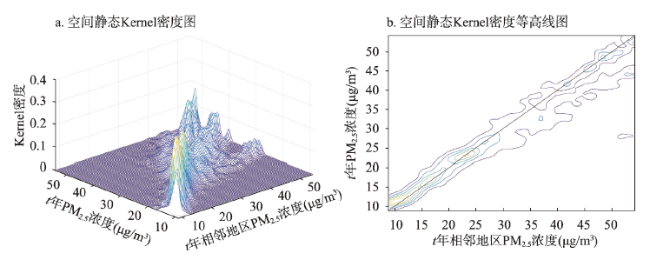
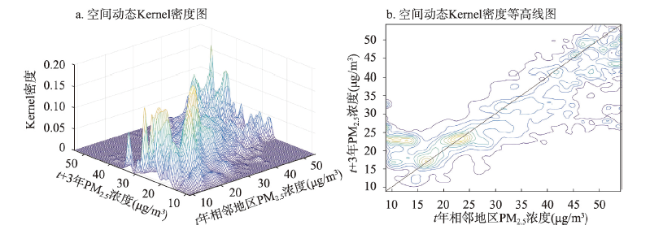
青藏高原地区的大气污染防治不仅是打赢蓝天保卫战的有力举措,也是维护青藏高原生态安全屏障、实现高原经济高质量发展和可持续发展的必然要求。基于长时间序列和高空间分辨率的PM2.5数据,采用空间自相关模型分析青藏高原县域尺度PM2.5浓度的静态空间关联特征,结合传统和空间Kernel密度估计探究PM2.5浓度的分布动态演进和长期转移趋势,最后运用空间马尔可夫链刻画青藏高原县域尺度PM2.5浓度的空间转移特征。结果表明:① 青藏高原县域尺度PM2.5浓度起步较高且空间锁定特征显著,新疆南部、青海省的柴达木盆地、西宁市和海东市内区县始终是PM2.5高排放地区;② 青藏高原县域尺度PM2.5浓度呈现显著的空间关联特征,局部空间关联主要以H-H和L-L两种同质性空间关联类型为主;③ 青藏高原县域尺度PM2.5浓度呈现整体下降的分布动态演进特征,局部差异仍显较大,考虑相邻地区的空间影响时,表现出空间收敛模式和显著的空间正相关性;3期时间滞后条件下,PM2.5浓度高值区的虹吸效应增强,地区之间的相互作用影响着青藏高原PM2.5浓度的未来空间分布。④ 青藏高原县域尺度PM2.5浓度的空间转移趋势稳定,难以实现县域尺度单元上的跳跃式转移。本文可为识别青藏高原县域尺度PM2.5浓度空间动态演进特征,实施精准化的大气污染防治政策,进而促进高原地区大气污染防控和生态文明建设提供理论参考。
关键词: PM2.5; 空间关联; 动态演进; 空间动态Kernel密度估计; 青藏高原
刘庆芳 , 谢佳亮 , 张先甜 , 徐勇 , 宋金平 . 青藏高原县域尺度PM2.5浓度时空动态演进特征[J]. 地理学报, 2024 , 79(3) : 654 -671 . DOI: 10.11821/dlxb202403007
The prevention and control of air pollution in the Qinghai-Tibet Plateau (QTP) is imperative to meet the goals of the Blue-Sky Protection Campaign, to protect the ecological security barrier, and to achieve high-quality and sustainable economic development. Based on the long time-series fine particulate matter (PM2.5) data with a high spatial resolution, the spatial autocorrelation model was adopted to analyze the static spatial correlation characteristics of county-scale PM2.5 concentrations in the QTP. Furthermore, the dynamic evolution and long-term transfer trend of PM2.5 distribution were explored by combining traditional and spatial kernel density estimation. Finally, the spatial Markov chain model was used to characterize the spatial transfer characteristics of county-scale PM2.5 concentrations in the study area. The results showed that: (1) On the county scale, the PM2.5 concentrations started with a higher value, and the spatial lock-in characteristics were significant. PM2.5 emissions were high in the following areas: southern Xinjiang, and Qaidam Basin, Xining city, and Haidong city of Qinghai province. (2) The county-scale PM2.5 concentrations presented significant spatial correlation characteristics, and the local spatial correlation was mainly dominated by two homogeneous spatial correlations: H-H and L-L. (3) The PM2.5 concentrations in counties of the QTP showed an overall decline in the distribution and dynamic evolution, and the local differences were still large. Furthermore, there was a "club convergence" phenomenon when spatial conditions were not considered. When the spatial influence of adjacent regions was considered, the spatial convergence pattern and significant spatial positive correlation were presented. Under the condition of a three-period time lag, the “siphon effect” in the area with high PM2.5 concentrations was enhanced. Additionally, the results revealed that the combined effect of PM2.5 emissions from different regions would affect the future spatial distribution of PM2.5 in the QTP. (4) The spatial transfer trend of PM2.5 concentrations was stable at the county level, and it is difficult to realize the jump transfer in the level of county units. This study provides a theoretical reference for identifying the spatial dynamic evolution characteristics of PM2.5 concentrations in the QTP on the county scale and implementing targeted air pollution prevention and control measures to construct ecological civilization in the plateau region.
表1 2000—2022年青藏高原县域尺度PM2.5 浓度的Moran's ITab. 1 Moran's I of PM2.5 concentrations in Qinghai-Tibet Plateau on county scale |
| 年份 | Moran's I | Z值 | 年份 | Moran's I | Z值 |
|---|---|---|---|---|---|
| 2000 | 0.822 | 18.696*** | 2012 | 0.822 | 19.092*** |
| 2001 | 0.822 | 18.891*** | 2013 | 0.815 | 18.711*** |
| 2002 | 0.813 | 18.952*** | 2014 | 0.837 | 19.022*** |
| 2003 | 0.801 | 18.768*** | 2015 | 0.821 | 18.998*** |
| 2004 | 0.798 | 18.681*** | 2016 | 0.819 | 19.096*** |
| 2005 | 0.801 | 18.848*** | 2017 | 0.800 | 18.317*** |
| 2006 | 0.796 | 18.621*** | 2018 | 0.809 | 18.417*** |
| 2007 | 0.798 | 18.595*** | 2019 | 0.781 | 17.835*** |
| 2008 | 0.814 | 18.996*** | 2020 | 0.829 | 19.032*** |
| 2009 | 0.796 | 18.569*** | 2021 | 0.740 | 17.211*** |
| 2010 | 0.810 | 18.898*** | 2022 | 0.677 | 15.903*** |
| 2011 | 0.827 | 189.170*** | |||
注:***表示在1%的水平下显著。 |
表2 传统马尔可夫转移概率矩阵Tab. 2 The transition probability matrix of traditional Markov |
| 类型 | 数据个数(个) | Ⅰ | Ⅱ | Ⅲ | Ⅳ |
|---|---|---|---|---|---|
| Ⅰ | 1054 | 0.8928 | 0.0930 | 0.0133 | 0.0009 |
| Ⅱ | 1175 | 0.1813 | 0.6017 | 0.2051 | 0.0119 |
| Ⅲ | 1193 | 0.0184 | 0.2598 | 0.6287 | 0.0930 |
| Ⅳ | 1198 | 0.0008 | 0.0125 | 0.1277 | 0.8589 |
表3 空间马尔可夫转移概率矩阵Tab. 3 The transition probability matrix of spatial Markov |
| 邻域 | 类型 | 数据个数(个) | Ⅰ | Ⅱ | Ⅲ | Ⅳ |
|---|---|---|---|---|---|---|
| Ⅰ | Ⅰ | 927 | 0.9029 | 0.0852 | 0.0108 | 0.0011 |
| Ⅱ | 64 | 0.4063 | 0.4063 | 0.1563 | 0.0313 | |
| Ⅲ | 2 | 0 | 0 | 1.0000 | 0 | |
| Ⅳ | 2 | 0 | 0.0000 | 0 | 1.0000 | |
| Ⅱ | Ⅰ | 126 | 0.8254 | 0.1429 | 0.0317 | 0 |
| Ⅱ | 884 | 0.1889 | 0.6109 | 0.1923 | 0.0079 | |
| Ⅲ | 199 | 0.0553 | 0.3116 | 0.5829 | 0.0503 | |
| Ⅳ | 5 | 0.2000 | 0.2000 | 0.6000 | 0 | |
| Ⅲ | Ⅰ | 1 | 0 | 1.0000 | 0 | 0 |
| Ⅱ | 225 | 0.0844 | 0.6267 | 0.2667 | 0.0222 | |
| Ⅲ | 883 | 0.0113 | 0.2593 | 0.6433 | 0.0861 | |
| Ⅳ | 121 | 0 | 0.0826 | 0.4050 | 0.5124 | |
| Ⅳ | Ⅰ | 0 | 0 | 0 | 0 | 0 |
| Ⅱ | 2 | 0.5000 | 0 | 0.5000 | 0 | |
| Ⅲ | 109 | 0.0092 | 0.1743 | 0.6055 | 0.2110 | |
| Ⅳ | 1070 | 0 | 0.0037 | 0.0944 | 0.9019 |
| [1] |
|
| [2] |
|
| [3] |
[ 王丽丽, 刘笑杰, 李丁, 等. 黄河流域PM2.5时空特征及驱动因素. 兰州大学学报(自然科学版), 2022, 58(4): 427-435, 442.]
|
| [4] |
[ 刘媛, 张蕾, 陈娱, 等. 2003—2016年中国PM2.5质量浓度时空格局演变及影响因素解析. 地理科学, 2023, 43(1): 152-162.]
|
| [5] |
|
| [6] |
|
| [7] |
[ 耿佳辰, 沈石, 程昌秀. “十三五”时期黄河流域PM2.5时空分布规律及多尺度社会经济影响机制分析. 地球信息科学学报, 2022, 24(6): 1163-1175.]
|
| [8] |
[ 张丽萍, 王旭峰, 何映月, 等. 基于多源数据的陕西省PM2.5时空分布特征及成因分析. 环境科学学报, 2023, 43(6): 94-109.]
|
| [9] |
[ 王昭, 严小兵. 长江三角洲城市群PM2.5时空演变及影响因. 长江流域资源与环境, 2020, 29(7): 1497-1506.]
|
| [10] |
|
| [11] |
|
| [12] |
[ 臧振峰, 张凤英, 李永华, 等. 我国主要粮产区PM2.5、PM10时空分布特征及影响因素: 以河南省为例. 自然资源学报, 2021, 36(5): 1163-1175.]
|
| [13] |
[ 杨宇, 何唯, 李鹏, 等. 中国城市化与PM2.5浓度时空动态及作用机理: 基于胡焕庸线变迁的视角. 资源科学, 2022, 44(10): 2100-2113.]
|
| [14] |
[ 王振波, 梁龙武, 王旭静. 中国城市群地区PM2.5时空演变格局及其影响因素. 地理学报, 2019, 74(12): 2614-2630.]
|
| [15] |
[ 依再提古丽·外力, 王明力, 杨建军, 等. 2015—2018年乌鲁木齐市PM2.5及PM10时空分布特征. 环境科学研究, 2020, 33(8): 1749-1757.]
|
| [16] |
[ 冯子钰, 施润和. 中国近地面PM2.5浓度与排放的时空分布及其关联分析. 地球信息科学学报, 2021, 23(7): 1221-1230.]
|
| [17] |
[ 李涛, 薛领, 赵威. 产业结构调整对城市PM2.5的影响机理. 经济地理, 2023, 43(5): 180-192.]
|
| [18] |
|
| [19] |
[ 夏晓圣, 汪军红, 宋伟东, 等. 2000—2019年中国PM2.5时空演化特征. 环境科学, 2020, 41(11): 4832-4843.]
|
| [20] |
[ 刁贝娣, 丁镭, 苏攀达, 等. 中国省域PM2.5浓度行业驱动因素的时空异质性研究. 中国人口·资源与环境, 2018, 28(9): 52-62.]
|
| [21] |
[ 向堃, 宋德勇. 中国省域PM2.5污染的空间实证研究. 中国人口·资源与环境, 2015, 25(9): 153-159.]
|
| [22] |
[ 刘倩倩, 党云晓, 张文忠, 等. 中国城市PM2.5污染对居民主观幸福感的影响及支付意愿研究. 地理科学, 2021, 41(12): 2096-2106.]
|
| [23] |
[ 姜磊, 周海峰, 赖志柱, 等. 中国城市PM2.5时空动态变化特征分析: 2015—2017年. 环境科学学报, 2018, 38(10): 3816-3825.]
|
| [24] |
[ 鲍艳磊, 吴朝阳, 郑东博. 大气污染对京津冀地区夏季植被生长峰值的影响. 地理科学进展, 2023, 42(6): 1124-1138.]
|
| [25] |
[ 徐勇, 郭振东, 郑志威, 等. 运用地理探测器研究京津冀城市群PM2.5浓度变化及影响因素. 环境科学研究, 2023, 36(4): 649-659.]
|
| [26] |
[ 王建, 许君利. 长三角城市群PM2.5时空演化及其来源研究. 长江流域资源与环境, 2023, 32(8): 1677-1685.]
|
| [27] |
[ 张懿华. 长三角地区PM2.5区域性污染时空变化特征. 环境科学研究, 2022, 35(1): 1-10.]
|
| [28] |
[ 王丽丽, 刘笑杰, 李丁, 等. 长江经济带PM2.5空间异质性和驱动因素的地理探测. 环境科学, 2022, 43(3): 1190-1200.]
|
| [29] |
[ 周侗, 张帅倩, 闫金伟, 等. 长江经济带三大城市群PM2.5时空分布特征及影响因素. 长江流域资源与环境, 2022, 31(4): 878-889.]
|
| [30] |
[ 徐雯丽, 陈强强. 黄河流域城市PM2.5时空分异特征及污染物解析. 环境科学研究, 2023, 36(4): 637-648.]
|
| [31] |
[ 原伟鹏, 孙慧, 王晶, 等. 中国城市减污降碳协同的时空演化及驱动力探析. 经济地理, 2022, 42(10): 72-82.]
|
| [32] |
[ 刘笑杰, 王丽丽, 何博汶, 等. 长江经济带PM2.5时空演变及影响因素分. 长江流域资源与环境, 2022, 31(3): 647-658.]
|
| [33] |
[ 贺祥, 林振山. 基于GAM模型分析影响因素交互作用对PM2.5浓度变化的影响. 环境科学, 2017, 38(1): 22-32.]
|
| [34] |
[ 金莲姬, 刘峥, 朱彬, 等. PM2.5空中输送对北京地面污染影响的地形强迫机制模拟研究. 环境科学学报, 2021, 41(8): 2976-2986.]
|
| [35] |
[ 李宝林, 袁烨城, 高锡章, 等. 国家重点生态功能区生态环境保护面临的主要问题与对策. 环境保护, 2014, 42(12): 15-18.]
|
| [36] |
[ 黄耀欢, 赵传朋, 杨海军, 等. 国家重点生态功能区人类活动空间变化及其聚集分析. 资源科学, 2016, 38(8): 1423-1433.]
|
| [37] |
|
| [38] |
[ 方创琳, 李广东. 西藏新型城镇化发展的特殊性与渐进模式及对策建议. 中国科学院院刊, 2015, 30(3): 294-305.]
|
| [39] |
[ 徐增让, 张镱锂, 成升魁, 等. 青藏高原区域可持续发展战略思考. 科技导报, 2017, 35(6): 108-114.]
|
| [40] |
[ 易嘉伟, 杜云艳, 涂文娜. 基于位置大数据的国庆假期青藏高原人群分布时空变化模式挖掘. 地球信息科学学报, 2019, 21(9): 1367-1381.]
|
| [41] |
[ 陈明华, 王哲, 谢琳霄, 等. 中国中部地区高质量发展的时空演变及形成机理. 地理学报, 2023, 78(4): 859-876.]
|
| [42] |
[ 张国兴, 张婧钰, 周桂芳. 黄河流域资源型城市生态安全等级边界及演化趋势. 资源科学, 2023, 45(4): 762-775.]
|
| [43] |
[ 刘帅, 李琪, 徐晓瑜, 等. 中国创新要素集聚能力的时空格局与动态演化. 科技进步与对策, 2021, 38(16): 11-20.]
|
| [44] |
|
| [45] |
|
| [46] |
Information Office of the State Council of the People's Republic of China. White Paper on Ecological Progress on the Qinghai-Tibet Plateau. (2018-07-18) [2023-12-23]. http://www.scio.gov.cn/.
[ 中华人民共和国国务院新闻办公室. 青藏高原生态文明建设状况白皮书. (2018-07-18) [2023-12-23]. http://www.scio.gov.cn/.]
|
| [47] |
[ 王相男, 张喆, 刘方青. 天山北坡城市群PM2.5浓度时空分布特征及影响因素分析. 环境科学. DOI: 10.13227/j.hjkx.202303017.]
|
| [48] |
|
| [49] |
[ 周亮, 周成虎, 杨帆, 等. 2000—2011年中国PM2.5时空演化特征及驱动因素解析. 地理学报, 2017, 72(11): 2079-2092.]
|
| [50] |
[ 刘海猛, 方创琳, 黄解军, 等. 京津冀城市群大气污染的时空特征与影响因素解析. 地理学报, 2018, 73(1): 177-191.]
|
/
| 〈 |
|
〉 |

