
中国国际重要滨海湿地生态系统文化服务空间分异归因研究
|
钟敬秋(1987- ), 男, 黑龙江肇东人, 博士, 副教授, 硕士生导师, 主要从事海岸带资源开发与保护、滨海旅游相关研究。E-mail: zjq@lnnu.edu.cn |
收稿日期: 2023-07-10
修回日期: 2023-12-27
网络出版日期: 2024-01-29
基金资助
中国科学院战略性先导科技专项(XDA23100403)
国家自然科学基金项目(42101113)
教育部人文社会科学研究项目(21YJCZH193)
教育部人文社会科学重点研究基地重大项目(22JJD790031)
辽宁省哲学社会科学青年人才培养对象委托课题(2022lslwtkt-044)
大连市青年科技之星项目(2021RQ080)
Spatial variation of the cultural ecosystem services pattern and influencing factors in the coastal areas: Evidence from Ramsar Sites in China
Received date: 2023-07-10
Revised date: 2023-12-27
Online published: 2024-01-29
Supported by
Strategic Priority Research Program of the Chinese Academy of Sciences(XDA23100403)
National Natural Science Foundation of China(42101113)
Ministry of Education Humanities and Social Sciences Research Youth Fund Project(21YJCZH193)
Ministry of Education Key Research Base of Humanities and Social Sciences Major Projects(22JJD790031)
Philosophy And Social Sciences Federation 2021 Excellent Youth Training of Liaoning Province(2022lslwtkt-044)
The Youth Science and Technology Star Project of Dalian(2021RQ080)
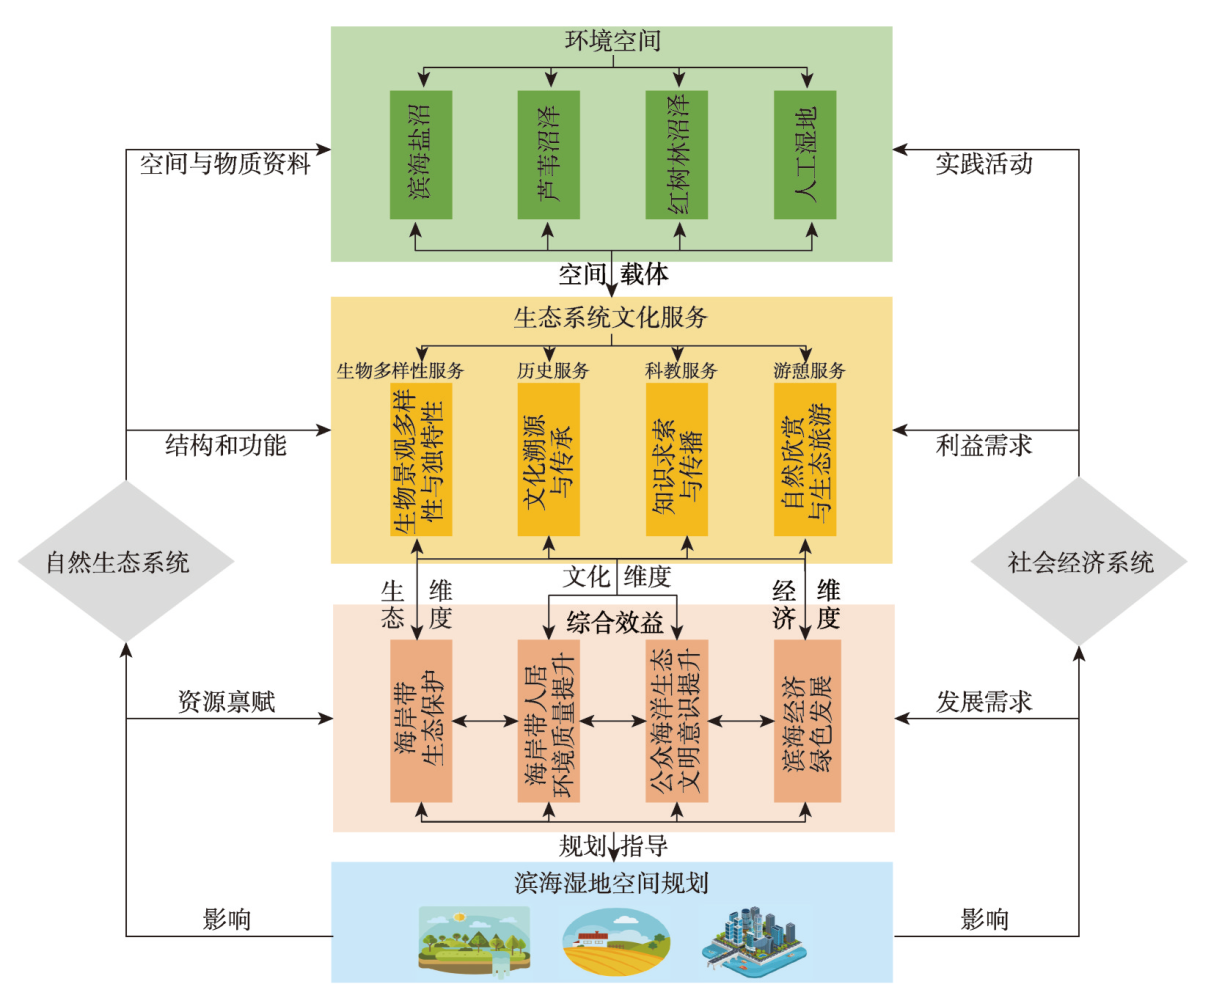
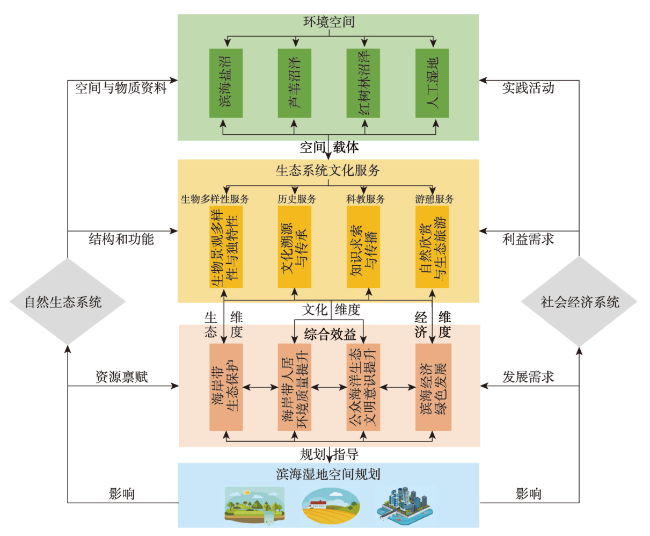
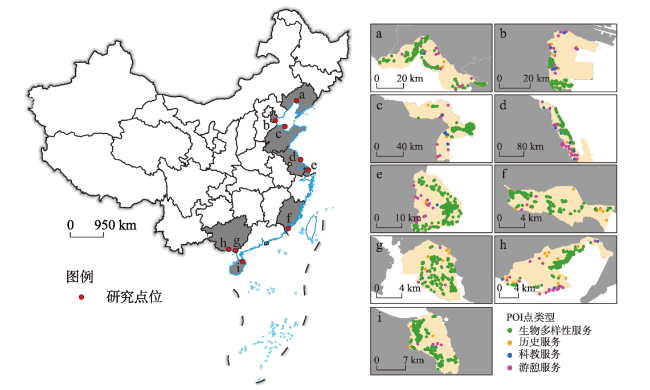
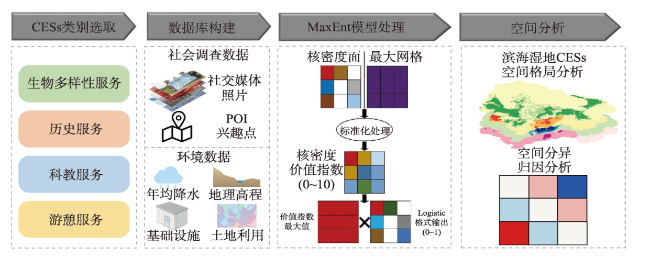
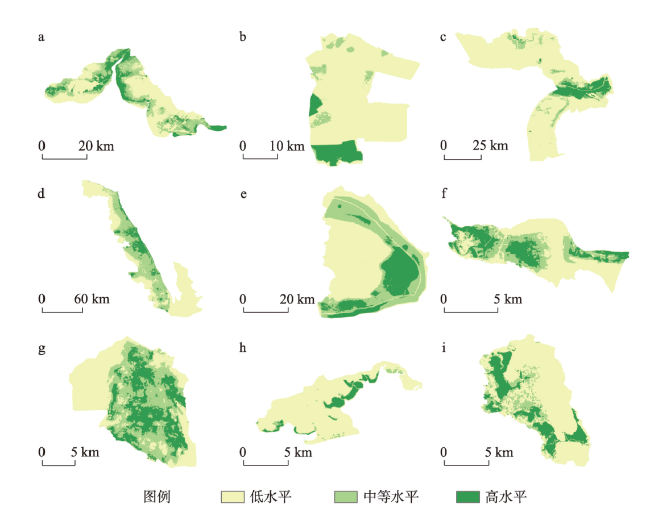
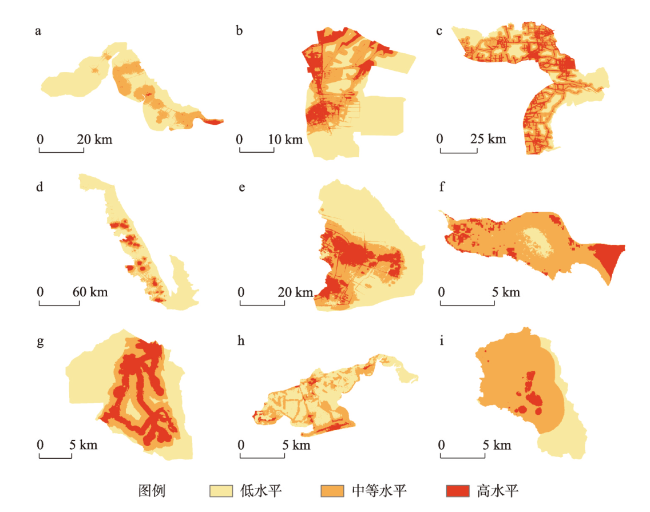
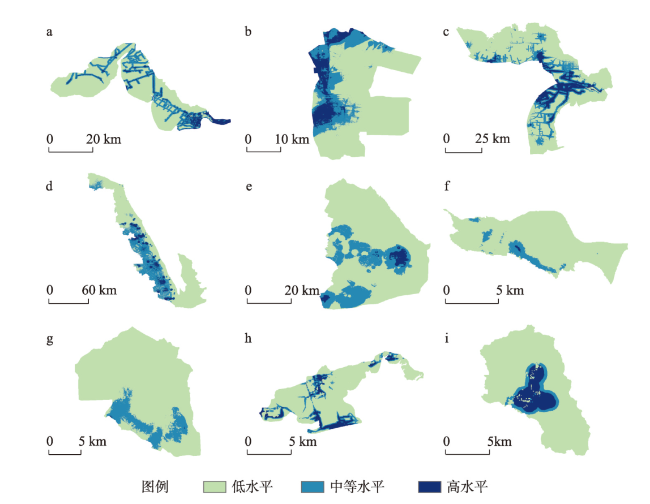
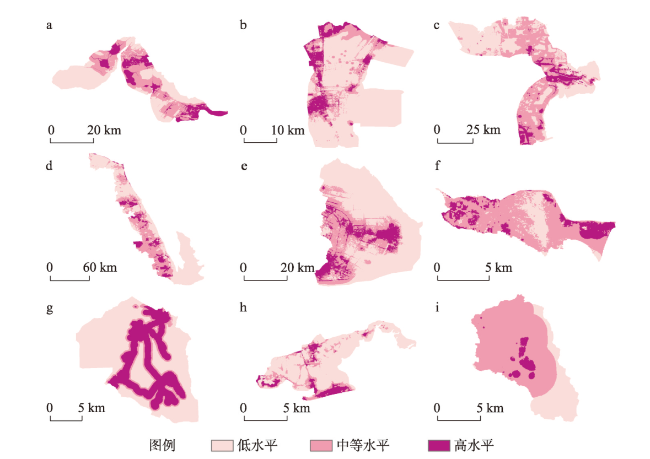
滨海湿地作为海陆交互作用关键区域,具有高度生态敏感性,日益加剧的气候变化与频繁的人类活动对其资源可持续利用带来了巨大挑战。生态系统文化服务(CESs)作为桥接自然环境与人类社会的无形纽带,在海洋与海岸带综合管理中发挥重要作用。为此,本文在建立CESs参与滨海湿地资源可持续管理理论框架基础上,将多源社交媒体照片与MaxEnt模型相结合,以9处中国国际重要滨海湿地为例开展实证研究。研究结果表明:① 从各CESs均值水平来看,生物多样性服务能力最强的滨海湿地为广西山口红树林湿地(0.222),其高水平面积为61.218 km2,占比27%;历史服务能力最强的是福建漳江口红树林湿地(0.336),其高水平面积为9.037 km2,占比17%;科教服务能力最强的是天津北大港湿地(0.092),其高水平面积为70.981 km2,占比11%;游憩服务能力最强的是福建漳江口红树林湿地(0.350),高水平区面积为9.037 km2,占比17%。② 从各CESs空间分异格局来看,生物多样性服务高水平较显著区位于广西山口红树林湿地东部和中部地区;历史服务高水平较显著区位于福建漳江口红树林湿地西部和东部地区;科教服务高水平较显著区位于天津北大港湿地西部地区;游憩服务高水平较显著区位于福建漳江口红树林湿地河口地区。③ 从环境变量对CESs贡献率来看,距自然保护区距离、土地利用类型和距鸟类栖息地距离是影响生物多样性服务格局分异的主要因素;而距基础设施距离、距道路距离和距鸟类栖息地距离均对9处滨海湿地历史服务、科教服务和游憩服务产生显著影响。④ 根据区域和国家战略、CESs均值高低及CESs类型权衡,本文将9处滨海湿地划分为生态修复导向型、生态文化振兴型和生态产业融合型3类发展模式,以期为海洋与海岸带综合治理研究及实践提供新思路。
钟敬秋 , 高梦凡 , 赵玉青 , 彭帅 , 王梦婷 . 中国国际重要滨海湿地生态系统文化服务空间分异归因研究[J]. 地理学报, 2024 , 79(1) : 76 -96 . DOI: 10.11821/dlxb202401006
Coastal wetlands, a pivotal realm of sea-land interactions, exhibit profound ecological sensitivity. Increasingly shifting climatic patterns and intensifying anthropogenic interventions pose formidable challenges to the sustainable utilization of these invaluable assets. Cultural ecosystem services (CESs) represent a subtle, yet crucial conduit connecting the natural environment and human society, thereby playing a pivotal role in the holistic management of coastal and oceanic domains. This study employed the theoretical framework of CESs involvement in the sustainable management of coastal wetland resources, and integrated multi-sourced social media data with the MaxEnt model to conduct an empirical investigation focused on nine Chinese coastal wetlands which are listed in Ramsar Convention. The results reveal the following: (1) From the mean level of each CES, the coastal wetlands with the strongest capacity for biodiversity, historical, educational, and recreational service respectively was the Guangxi Shankou Mangrove Wetland (0.222), with a high level area of 61.218 km2, accounting for 27%; Fujian Zhangjiangkou Mangrove Wetland (0.336), with a high level of 9.037 km2, accounting for 17%; Tianjin Beidagang Wetland (0.092), with a high level of 70.981 km2, accounting for 11%; and Fujian Zhangjiangkou Mangrove Wetland (0.350), with a high level of 9.037 km2, accounting for 17%. (2) Delineating the spatial differentiation pattern of each CES, the high-level zone for biodiversity service in Shankou Mangrove Wetland is predominantly clustered within the eastern and central regions. A high level of historical service was more significant in the western and eastern Fujian Zhangjiangkou Mangrove Wetland. Regarding educational service in the Tianjin Beidagang Wetland, high-level areas were clustered in the western sector. The high-level recreational service areas of the Zhangjiangkou Mangrove Wetland were mainly clustered in estuarine area. (3) Assessing the contributions of environmental variables to CESs, it became evident that distance to nature reserves, land-use type, and distance to bird habitats emerged as the principal factors steering the divergences in biodiversity service patterns. Simultaneously, distance to infrastructure, roads, and bird habitat proximity significantly influenced the historical, educational, and recreational services within the nine coastal wetlands, albeit to varying extents. (4) In line with both regional and national strategies, this study categorised sustainable resource management approaches for the nine coastal wetlands into three distinct modes: ecological restoration, ecological and cultural rejuvenation, and ecological and industrial integration, thereby presenting innovative paradigms for the research and implementation of comprehensive governance within China's coastal and oceanic domains.
表1 CESs类别选择及具体描述Tab. 1 CESs category selection and specific descriptions |
| 服务类别 | 描述 |
|---|---|
| 生物多样性服务 | 该区域拥有野生动植物以及其他生物,并具备让人产生积极环境价值观的能力 |
| 历史服务 | 该区域保留较为完整的传统建筑、生产方式等,具备为人们提供了解过去的能力 |
| 科教服务 | 该区域具备为人类意识形态形成和认知提高提供学习资源和场所的能力 |
| 游憩服务 | 该区域具备为人们提供自然欣赏、健身、社交等户外休闲场所和资源的能力 |
表2 POI类别Tab. 2 The classification of POI |
| 一级分类 | 二级分类 | 三级分类 |
|---|---|---|
| 体育休闲中心 | 运动场馆 | 户外健身场所 海滨浴场 |
| 高尔夫相关场所 | 高尔夫球场 | |
| 度假疗养场所 | 度假村 疗养院 | |
| 休闲场所 | 垂钓园 采摘园 露营地 水上活动中心 | |
| 风景名胜区 | 公园广场 | 公园 动物园 植物园 水族馆 城市广场 |
| 旅游景点 | 各级旅游景点 海滩 寺庙道观 教堂 回教寺 | |
| 科教文化场所 | 博物馆 | 博物馆 |
| 展览馆 | 展览馆 | |
| 美术馆 | 美术馆 | |
| 科研机构 | 科研机构 | |
| 公司企业 | 农林牧渔基地 | 渔场 农场 林场 牧场 |
表3 各研究区POI及相关照片数量Tab. 3 The number of POI and the related photographs |
| 研究区 | POI数量(个) | 照片数量(张) |
|---|---|---|
| 辽宁双台河口湿地 | 55 | 3245 |
| 天津北大港湿地 | 31 | 2987 |
| 山东黄河口湿地 | 39 | 6405 |
| 江苏盐城黄海湿地 | 68 | 8519 |
| 上海崇明东滩湿地 | 53 | 2766 |
| 福建漳江口红树林湿地 | 22 | 602 |
| 广西山口红树林湿地 | 18 | 568 |
| 广西北仑河口湿地 | 43 | 3163 |
| 海南东寨港红树林湿地 | 19 | 1978 |
| 总计 | 348 | 30233 |
表4 照片类别及数量Tab. 4 Categories and number of photographs |
| 类别 | 子类别 | 照片数量(张) | 占比(%) |
|---|---|---|---|
| 人文类 | 民俗节庆活动 民族文化 饮食文化 艺术作品 | 1996 | 6.6 |
| 人物类 | 娱乐活动 生产活动 日常生活 宣传与教育 会议交流 志愿服务 动植物保护 科学研究 | 9688 | 32.0 |
| 人造建筑类 | 建筑物 基础设施 | 6719 | 22.2 |
| 半自然类 | 耕地 水产养殖场 盐田 | 483 | 1.6 |
| 自然类 | 地貌景观 水体景观 气象景观 生物景观 | 14174 | 46.9 |
表5 基于社交媒体照片内容的CESs类别判断标准Tab. 5 CESs category judgment criteria based on social media photographs content |
| 服务类别 | 表征内容 |
|---|---|
| 生物多样性服务 | 花丛、草地、灌木丛、森林,以及麋鹿、儒艮、斑海豹、丹顶鹤等珍稀物种 |
| 历史服务 | 民族服饰、祭祀活动、手工艺品、地方特色饮食等 |
| 科教服务 | 研学活动、观鸟、野外考察、环境保护等活动 |
| 游憩服务 | 采摘、团建、露营、亲子活动、动植物观赏、相关游憩设施等 |
表6 环境数据及来源Tab. 6 Environmental variables and data sources |
| 环境数据 | 来源及处理 |
|---|---|
| 年均降水、年均温 | 中国气象资料网(http://data.cma.cn/) |
| 高程 | 美国航空航天局官网(NASA) (http://reverb.echo.nasa.gov/) |
| 距鸟类栖息地距离 | 物种多样性平台(ESPECIES) (http://www.especies.cn/) |
| 距自然保护区距离 | 国家标本资源共享平台(http://www.papc.cn/) |
| 距自然海岸线距离 | 基于遥感影像运用GIS识别并提取 |
| 土地利用类型 | 运用ENVI和GIS对遥感影像进行目视解译 |
| 人口密度 | The WorldPop 全球人口数据 (https://www.worldpop.org/) |
| 距道路距离 | OpenStreetMap (https://www.openstreetmap.org/) |
| 距基础设施距离 | GAODE map (https://www.amap.com/) Google map (https://www/map/google.com) |
| 距居民区距离 | |
| 距人工海岸线距离 | 基于遥感影像运用GIS识别并提取 |
表7 各研究区CESs 类别AUC值Tab.7 AUC values of CESs in each study area |
| 研究区 | 生物多样性服务 | 历史服务 | 科教服务 | 游憩服务 | |||||||
|---|---|---|---|---|---|---|---|---|---|---|---|
| 训练集 | 测试集 | 训练集 | 测试集 | 训练集 | 测试集 | 训练集 | 测试集 | ||||
| 辽宁双台河口湿地 | 0.922 | 0.893 | 0.967 | 0.898 | 0.967 | 0.861 | 0.913 | 0.869 | |||
| 天津北大港湿地 | 0.976 | 0.964 | 0.933 | 0.830 | 0.962 | 0.873 | 0.947 | 0.882 | |||
| 山东黄河三角洲湿地 | 0.966 | 0.939 | 0.804 | 0.727 | 0.973 | 0.910 | 0.915 | 0.759 | |||
| 江苏盐城黄海湿地 | 0.935 | 0.910 | 0.975 | 0.935 | 0.973 | 0.919 | 0.948 | 0.906 | |||
| 上海崇明东滩湿地 | 0.880 | 0.844 | 0.935 | 0.830 | 0.984 | 0.965 | 0.940 | 0.879 | |||
| 福建漳江口红树林湿地 | 0.896 | 0.825 | 0.831 | 0.663 | 0.999 | 0.989 | 0.810 | 0.676 | |||
| 广西山口红树林湿地 | 0.863 | 0.787 | 0.863 | 0.811 | 0.998 | 0.847 | 0.899 | 0.822 | |||
| 广西北仑河口湿地 | 0.952 | 0.933 | 0.891 | 0.751 | 0.961 | 0.939 | 0.949 | 0.861 | |||
| 海南东寨港红树林湿地 | 0.922 | 0.895 | 0.844 | 0.630 | 0.974 | 0.955 | 0.897 | 0.794 | |||
| 平均值 | 0.924 | 0.888 | 0.894 | 0.786 | 0.977 | 0.918 | 0.913 | 0.828 | |||
表8 各研究区生物多样性服务分级标准和不同等级面积Tab. 8 Classification standards and different grade areas of biodiversity service in each study area |
| 研究区 | TSS阈值 | TPT 平衡阈值 | 平均值 | 最大值 | 低水平区 | 中等水平区 | 高水平区 | |||||
|---|---|---|---|---|---|---|---|---|---|---|---|---|
| 面积(km²) | 占比(%) | 面积(km²) | 占比(%) | 面积(km²) | 占比(%) | |||||||
| 辽宁双台河口湿地 | 0.166 | 0.044 | 0.103 | 0.970 | 394.297 | 50 | 244.464 | 31 | 149.833 | 19 | ||
| 天津北大港湿地 | 0.248 | 0.029 | 0.048 | 0.990 | 542.035 | 84 | 38.717 | 6 | 64.528 | 10 | ||
| 山东黄河三角洲湿地 | 0.145 | 0.041 | 0.045 | 0.968 | 2183.664 | 83 | 210.474 | 8 | 236.783 | 9 | ||
| 江苏盐城黄海湿地 | 0.269 | 0.036 | 0.097 | 0.986 | 3703.803 | 53 | 2515.791 | 36 | 768.714 | 11 | ||
| 上海崇明东滩湿地 | 0.303 | 0.115 | 0.165 | 0.972 | 141.327 | 50 | 84.796 | 30 | 56.531 | 20 | ||
| 福建漳江口红树林湿地 | 0.258 | 0.088 | 0.162 | 0.963 | 27.112 | 51 | 13.290 | 25 | 12.759 | 24 | ||
| 广西山口红树林湿地 | 0.356 | 0.119 | 0.222 | 0.935 | 88.425 | 39 | 77.089 | 34 | 61.218 | 27 | ||
| 广西北仑河口湿地 | 0.142 | 0.032 | 0.051 | 0.761 | 86.870 | 85 | 5.110 | 5 | 10.220 | 10 | ||
| 海南东寨港红树林湿地 | 0.167 | 0.059 | 0.114 | 0.849 | 70.152 | 73 | 7.688 | 8 | 18.259 | 19 | ||
表9 各研究区历史服务分级标准和不同等级面积Tab. 9 Classification standards and different grade areas of historical service in each study area |
| 研究区 | TSS 阈值 | TPT 平衡阈值 | 平均值 | 最大值 | 低水平区 | 中等水平区 | 高水平区 | |||||
|---|---|---|---|---|---|---|---|---|---|---|---|---|
| 面积(km²) | 占比(%) | 面积(km²) | 占比(%) | 面积(km²) | 占比(%) | |||||||
| 辽宁双台河口湿地 | 0.302 | 0.025 | 0.031 | 0.960 | 552.016 | 70 | 228.692 | 29 | 7.886 | 1 | ||
| 天津北大港湿地 | 0.299 | 0.102 | 0.152 | 0.933 | 329.093 | 51 | 206.490 | 32 | 109.698 | 17 | ||
| 山东黄河三角洲湿地 | 0.504 | 0.214 | 0.334 | 0.890 | 789.276 | 30 | 1183.914 | 45 | 657.730 | 25 | ||
| 江苏盐城黄海湿地 | 0.107 | 0.028 | 0.033 | 0.979 | 5311.114 | 76 | 1118.129 | 16 | 559.065 | 8 | ||
| 上海崇明东滩湿地 | 0.316 | 0.103 | 0.146 | 0.995 | 163.940 | 58 | 70.664 | 25 | 48.051 | 17 | ||
| 福建漳江口红树林湿地 | 0.459 | 0.209 | 0.336 | 0.852 | 3.721 | 7 | 40.402 | 76 | 9.037 | 17 | ||
| 广西山口红树林湿地 | 0.454 | 0.165 | 0.246 | 0.815 | 106.564 | 47 | 58.950 | 26 | 61.218 | 27 | ||
| 广西北仑河口湿地 | 0.489 | 0.096 | 0.143 | 0.970 | 57.232 | 56 | 38.836 | 38 | 6.132 | 6 | ||
| 海南东寨港红树林湿地 | 0.507 | 0.202 | 0.121 | 0.870 | 74.957 | 78 | 14.415 | 15 | 6.727 | 7 | ||
表10 各研究区科教服务分级标准和不同等级面积Tab. 10 Classification standards and different grade areas of educational service in each study area |
| 研究区 | TSS 阈值 | TPT 平衡阈值 | 平均值 | 最大值 | 低水平区 | 中等水平区 | 高水平区 | |||||
|---|---|---|---|---|---|---|---|---|---|---|---|---|
| 面积(km²) | 占比(%) | 面积(km²) | 占比(%) | 面积(km²) | 占比(%) | |||||||
| 辽宁双台河口湿地 | 0.273 | 0.054 | 0.069 | 0.895 | 544.130 | 69 | 197.148 | 25 | 47.316 | 6 | ||
| 天津北大港湿地 | 0.262 | 0.070 | 0.092 | 0.920 | 445.243 | 69 | 129.056 | 20 | 70.981 | 11 | ||
| 山东黄河三角洲湿地 | 0.238 | 0.058 | 0.076 | 0.996 | 1841.645 | 70 | 526.184 | 20 | 263.092 | 10 | ||
| 江苏盐城黄海湿地 | 0.111 | 0.031 | 0.038 | 0.994 | 4472.517 | 64 | 2096.493 | 30 | 419.299 | 6 | ||
| 上海崇明东滩湿地 | 0.375 | 0.032 | 0.036 | 0.891 | 211.991 | 75 | 65.011 | 23 | 5.653 | 2 | ||
| 福建漳江口红树林湿地 | 0.437 | 0.004 | 0.005 | 0.814 | 47.313 | 89 | 3.721 | 7 | 2.126 | 4 | ||
| 广西山口红树林湿地 | 0.611 | 0.011 | 0.013 | 0.787 | 194.989 | 86 | 29.475 | 13 | 2.267 | 1 | ||
| 广西北仑河口湿地 | 0.244 | 0.062 | 0.066 | 0.878 | 79.716 | 78 | 12.264 | 12 | 10.220 | 10 | ||
| 海南东寨港红树林湿地 | 0.120 | 0.041 | 0.049 | 0.852 | 78.801 | 82 | 5.766 | 6 | 11.532 | 12 | ||
表11 各研究区游憩服务分级标准和不同等级面积Tab. 11 Classification standards and different grade areas of recreational service in each study area |
| 研究区 | TSS 阈值 | TPT 平衡阈值 | 平均值 | 最大值 | 低水平区 | 中等水平区 | 高水平区 | |||||
|---|---|---|---|---|---|---|---|---|---|---|---|---|
| 面积(km²) | 占比(%) | 面积(km²) | 占比(%) | 面积(km²) | 占比(%) | |||||||
| 辽宁双台河口湿地 | 0.223 | 0.048 | 0.119 | 0.978 | 362.753 | 46 | 283.894 | 36 | 141.947 | 18 | ||
| 天津北大港湿地 | 0.303 | 0.077 | 0.101 | 0.957 | 464.602 | 72 | 109.698 | 17 | 70.981 | 11 | ||
| 山东黄河三角洲湿地 | 0.317 | 0.089 | 0.133 | 0.998 | 1210.224 | 46 | 1157.605 | 44 | 263.092 | 10 | ||
| 江苏盐城黄海湿地 | 0.209 | 0.050 | 0.082 | 0.992 | 3983.336 | 57 | 2236.259 | 32 | 768.714 | 11 | ||
| 上海崇明东滩湿地 | 0.266 | 0.077 | 0.108 | 0.994 | 172.419 | 61 | 73.490 | 26 | 36.745 | 13 | ||
| 福建漳江口红树林湿地 | 0.482 | 0.211 | 0.350 | 0.842 | 8.506 | 16 | 35.618 | 67 | 9.037 | 17 | ||
| 广西山口红树林湿地 | 0.285 | 0.123 | 0.172 | 0.714 | 142.841 | 63 | 13.604 | 6 | 70.287 | 31 | ||
| 广西北仑河口湿地 | 0.212 | 0.053 | 0.070 | 0.974 | 73.584 | 72 | 17.374 | 17 | 11.242 | 11 | ||
| 海南东寨港红树林湿地 | 0.586 | 0.020 | 0.198 | 0.811 | 24.025 | 25 | 67.269 | 70 | 4.805 | 5 | ||
表12 环境变量对生物多样性服务空间分布的贡献率(%)Tab. 12 Contribution rate of environmental variables to the distribution of biodiversity service (%) |
| 环境变量 | 辽宁双台河口湿地 | 天津北大港湿地 | 山东黄河 三角洲湿地 | 江苏 盐城 黄海湿地 | 上海崇明 东滩湿地 | 福建漳江口红树林湿地 | 广西山口 红树林湿地 | 广西北仑河口湿地 | 海南东寨港红树林湿地 | 平均 值 |
|---|---|---|---|---|---|---|---|---|---|---|
| 年均降水 | 4.9 | 0.8 | 11.2 | 6.0 | 2.4 | 2.6 | 0 | 5.3 | 0.9 | 3.8 |
| 年均温 | 0.9 | 28.5 | 0.0 | 2.9 | 1.6 | 0.0 | 1.5 | 2.1 | 5.0 | 4.7 |
| 地理高程 | 8.1 | 0.4 | 0.5 | 0.6 | 0.3 | 3.4 | 13.5 | 0.7 | 5.2 | 3.6 |
| 距鸟类栖息地距离 | 3.6 | 0.2 | 25.0 | 28.4 | 23.4 | 32.1 | 12.1 | 0.1 | 0.3 | 13.9 |
| 距自然保护区距离 | 0.3 | 49.4 | 31.9 | 8.6 | 45.8 | 3.9 | 30.8 | 62.2 | 75.8 | 34.3 |
| 距自然海岸线距离 | 36.7 | 3.5 | 5.1 | 3.7 | 1.6 | 5.9 | 2.8 | 0.4 | 1.4 | 6.8 |
| 土地利用类型 | 28.6 | 0.2 | 11.3 | 36.1 | 1.9 | 14.9 | 26.4 | 24.2 | 6.7 | 16.7 |
| 人口密度 | 0.2 | 0.4 | 0.8 | 0.1 | 0.2 | 1.8 | 6.4 | 0.1 | 0.4 | 1.2 |
| 距道路距离 | 1.6 | 0.4 | 4.3 | 1.4 | 1.0 | 2.4 | 0.7 | 2.8 | 1.8 | 1.8 |
| 距基础设施距离 | 7.2 | 14.3 | 4.3 | 4.7 | 18.8 | 17.2 | 1.8 | 1.3 | 0.5 | 7.8 |
| 距居民住宅区距离 | 3.8 | 0.2 | 7.7 | 1.1 | 2.0 | 5.2 | 0.8 | 0.1 | 1.3 | 2.5 |
| 距人工海岸线距离 | 4.2 | 1.8 | 0.5 | 6.5 | 1.1 | 10.5 | 3.3 | 0.9 | 0.8 | 3.3 |
表13 环境变量对历史服务空间分布的贡献率(%)Tab. 13 Contribution rate of environmental variables to the distribution of historical service (%) |
| 环境变量 | 辽宁双台河口湿地 | 天津北大港湿地 | 山东黄河 三角洲湿地 | 江苏盐城 黄海湿地 | 上海崇明东滩湿地 | 福建漳江口红树林湿地 | 广西山口 红树林湿地 | 广西北仑河口湿地 | 海南东寨港红树林湿地 | 平均值 |
|---|---|---|---|---|---|---|---|---|---|---|
| 年均降水 | 3.6 | 5.1 | 0.0 | 0.0 | 2.1 | 0.0 | 0.0 | 5.6 | 0.4 | 1.9 |
| 年均温 | 1.2 | 0.0 | 0.0 | 0.3 | 0.1 | 0.0 | 0.0 | 5.0 | 0.0 | 0.7 |
| 地理高程 | 0.5 | 0.1 | 3.8 | 5.7 | 18.6 | 0.3 | 0.0 | 4.0 | 0.0 | 3.7 |
| 距鸟类栖息地距离 | 54.9 | 0.6 | 0.0 | 42.7 | 8.6 | 23.9 | 0.9 | 1.3 | 15.0 | 16.4 |
| 距自然保护区距离 | 0.6 | 9.8 | 0.0 | 0.0 | 10.9 | 1.1 | 54.5 | 0.5 | 0.0 | 8.6 |
| 距自然海岸线距离 | 1.3 | 2.4 | 1.8 | 4.0 | 0.2 | 0.0 | 0.0 | 0.5 | 0.0 | 1.1 |
| 土地利用类型 | 0.1 | 0.1 | 0.2 | 2.7 | 0.4 | 1.1 | 3.4 | 4.8 | 0.9 | 1.5 |
| 人口密度 | 6.9 | 29.1 | 15.2 | 0 | 2.6 | 67.8 | 0.0 | 0.4 | 1.1 | 13.7 |
| 距道路距离 | 11.6 | 16.9 | 78.9 | 3.0 | 5.3 | 3.6 | 41.2 | 30.5 | 24.2 | 23.9 |
| 距基础设施距离 | 16.9 | 35.8 | 0.0 | 38.1 | 48.9 | 1.4 | 0.0 | 37.4 | 11.3 | 21.1 |
| 距居民住宅区距离 | 2.3 | 0.2 | 0.0 | 2.8 | 1.8 | 0.6 | 0.0 | 8.4 | 46.0 | 6.9 |
| 距人工海岸线距离 | 0.0 | 0.1 | 0.0 | 0.6 | 0.6 | 0.0 | 0.0 | 1.5 | 1.0 | 0.4 |
表14 环境变量对科教服务空间分布的贡献率(%)Tab. 14 Contribution rate of environmental variables to the distribution of educational service (%) |
| 环境变量 | 辽宁双台河口湿地 | 天津北大港湿地 | 山东黄河 三角洲湿地 | 江苏盐城 黄海湿地 | 上海崇明 东滩湿地 | 福建漳江口红树林湿地 | 广西山口 红树林湿地 | 广西北仑河口湿地 | 海南东寨港红树林湿地 | 平均 值 |
|---|---|---|---|---|---|---|---|---|---|---|
| 年均降水 | 0.6 | 2.7 | 16.5 | 0.0 | 2.1 | 0.6 | 0.0 | 0.6 | 0.0 | 2.6 |
| 年均温 | 0.1 | 0.2 | 0.0 | 0.8 | 0.0 | 0.0 | 0.0 | 0.0 | 0.0 | 0.1 |
| 地理高程 | 0.0 | 1.7 | 0.1 | 9.7 | 9.4 | 1.7 | 7.0 | 0.7 | 0.0 | 3.4 |
| 距鸟类栖息地距离 | 33.2 | 1.3 | 7.8 | 62.1 | 52.2 | 0.0 | 0.4 | 5.8 | 55.8 | 24.3 |
| 距自然保护区距离 | 0.1 | 2.8 | 8.4 | 0.2 | 10.0 | 15.3 | 10.6 | 0.4 | 0.6 | 5.4 |
| 距自然海岸线距离 | 0.2 | 0.0 | 3.4 | 3.4 | 0.7 | 6.8 | 0.1 | 0.1 | 0.0 | 1.6 |
| 土地利用类型 | 3.6 | 1.5 | 0.9 | 0.1 | 0.7 | 0.8 | 8.5 | 0.0 | 0.0 | 1.8 |
| 人口密度 | 3.3 | 39.8 | 1.4 | 0.7 | 0.1 | 1.4 | 0.0 | 2.4 | 3.3 | 5.8 |
| 距道路距离 | 47.0 | 3.5 | 27.2 | 6.0 | 0.1 | 31.9 | 35.1 | 41.3 | 0.8 | 21.4 |
| 距基础设施距离 | 10.5 | 41.6 | 16.0 | 10.2 | 5.8 | 20.7 | 4.6 | 48.6 | 37.6 | 21.7 |
| 距居民住宅区距离 | 0.5 | 3.2 | 9.9 | 6.2 | 15.3 | 17.7 | 0.0 | 0.0 | 1.4 | 6.0 |
| 距人工海岸线距离 | 1.0 | 1.7 | 8.4 | 0.5 | 3.5 | 3.2 | 33.7 | 0.0 | 0.5 | 5.8 |
表15 环境变量对游憩服务空间分布的贡献率(%)Tab. 15 Contribution rate of environmental variables to the distribution of recreational service (%) |
| 环境变量 | 辽宁双台河口湿地 | 天津北大港湿地 | 山东黄河 三角洲湿地 | 江苏盐城 黄海湿地 | 上海崇明 东滩湿地 | 福建漳江口红树林湿地 | 广西山口 红树林湿地 | 广西北仑河口湿地 | 海南东寨港红树林湿地 | 平均 值 |
|---|---|---|---|---|---|---|---|---|---|---|
| 年均降水 | 1.1 | 6.6 | 8.9 | 0.0 | 0.1 | 0.0 | 0.0 | 2.7 | 0.5 | 2.2 |
| 年均温 | 1.5 | 0.2 | 0.0 | 0.3 | 2.6 | 0.0 | 0.0 | 7.5 | 0.0 | 1.3 |
| 地理高程 | 0.3 | 4.5 | 0.9 | 0.4 | 13.4 | 7.0 | 0.3 | 1.9 | 0.1 | 3.2 |
| 距鸟类栖息地距离 | 17.1 | 4.4 | 41.1 | 16.1 | 21.1 | 7.3 | 0.0 | 4.4 | 46.4 | 17.5 |
| 距自然保护区距离 | 1.3 | 4.5 | 13.0 | 0.2 | 0.6 | 0.5 | 31.1 | 0.9 | 0.3 | 5.8 |
| 距自然海岸线距离 | 0.6 | 3.2 | 0.4 | 0.3 | 1.5 | 1.3 | 0.0 | 2.6 | 0.0 | 1.1 |
| 土地利用类型 | 2.5 | 1.5 | 8.7 | 13.7 | 1.1 | 3.2 | 0.0 | 5.8 | 0.3 | 4.1 |
| 人口密度 | 1.2 | 46.7 | 2.3 | 1.1 | 2.0 | 47.8 | 0.4 | 0.1 | 0.8 | 11.4 |
| 距道路距离 | 30.6 | 4.6 | 14.3 | 10.6 | 10.0 | 10.5 | 66.1 | 14.5 | 1.8 | 18.1 |
| 距基础设施距离 | 38.5 | 22.2 | 5.2 | 49.3 | 41.7 | 20.3 | 0.3 | 51.3 | 10.5 | 26.6 |
| 距居民住宅区距离 | 4.6 | 0.9 | 2.7 | 0.5 | 1.1 | 2.0 | 0.3 | 3.4 | 38.6 | 6.0 |
| 距人工海岸线距离 | 0.7 | 0.5 | 2.5 | 7.5 | 4.7 | 0.0 | 1.4 | 4.8 | 0.7 | 2.5 |
表16 生态—文化—经济属性下CESs发展模式Tab. 16 Development model of CESs under the ecological-cultural-economic dimension |
| 发展模式 | 研究区 | 生态属性 | 文化属性 | 经济属性 | 发展水平 |
|---|---|---|---|---|---|
| 生态修复导向型 | 天津北大港湿地 | 0.048 | 0.122 | 0.092 | 低—中—高 |
| 山东黄河三角洲湿地 | 0.045 | 0.205 | 0.076 | 低—高—高 | |
| 广西北仑河口湿地 | 0.051 | 0.105 | 0.066 | 低—中—中 | |
| 生态文化振兴型 | 辽宁双台河口湿地 | 0.103 | 0.050 | 0.069 | 中—低—高 |
| 江苏盐城黄海湿地 | 0.097 | 0.036 | 0.038 | 中—低—中 | |
| 海南东寨港红树林湿地 | 0.114 | 0.085 | 0.049 | 中—低—中 | |
| 生态产业融合型 | 上海崇明东滩湿地 | 0.165 | 0.091 | 0.036 | 高—中—低 |
| 福建漳江口红树林湿地 | 0.162 | 0.171 | 0.005 | 高—高—低 | |
| 广西山口红树林湿地 | 0.222 | 0.130 | 0.013 | 高—高—低 |
| [1] |
Millennium Ecosystem Assessment. Ecosystem and Human Well-Being. Washington DC: Island Press, 2005.
|
| [2] |
|
| [3] |
|
| [4] |
|
| [5] |
|
| [6] |
[杨林生, 邓浩宇, 廖晓勇, 等. 科技支撑美丽中国建设的进展和展望. 中国环境管理, 2022, 14(6): 17-24.]
|
| [7] |
|
| [8] |
|
| [9] |
|
| [10] |
|
| [11] |
|
| [12] |
|
| [13] |
|
| [14] |
|
| [15] |
|
| [16] |
|
| [17] |
|
| [18] |
|
| [19] |
[裴韬, 刘亚溪, 郭思慧, 等. 地理大数据挖掘的本质. 地理学报, 2019, 74(3): 586-598.]
|
| [20] |
[杨俊, 由浩琳, 张育庆, 等. 从传统数据到大数据+的人居环境研究进展. 地理科学进展, 2020, 39(1): 166-176.]
|
| [21] |
|
| [22] |
|
| [23] |
|
| [24] |
|
| [25] |
|
| [26] |
|
| [27] |
[张德跃, 苏芳莉, 王铁良, 等. 1985年以来7个时期双台河口湿地土地利用格局及其变化. 湿地科学, 2019, 17(6): 658-662.]
|
| [28] |
[杜志博, 李洪远, 孟伟庆. 天津滨海新区湿地景观连接度距离阈值研究. 生态学报, 2019, 39(17): 6534-6544.]
|
| [29] |
[王大伟, 白军红, 赵庆庆, 等. 黄河三角洲不同类型湿地土壤盐分的剖面分异特征. 自然资源学报, 2020, 35(2): 438-448.]
|
| [30] |
[李建国, 濮励杰, 徐彩瑶, 等. 1977—2014年江苏中部滨海湿地演化与围垦空间演变趋势. 地理学报, 2015, 70(1): 17-28.]
|
| [31] |
[林世伟, 马煜曦, 薛力铭, 等. 滨海湿地消浪服务空间分布特征: 以上海市崇明岛为例. 生态学报, 2021, 41(6): 2190-2200.]
|
| [32] |
[梁高都, 田义超, 吴彬, 等. 广西北部湾典型海岛红树林的结构特征/空间格局及种间种内关联性. 生态学报, 2022, 42(17): 7244-7255.]
|
| [33] |
|
| [34] |
|
| [35] |
|
| [36] |
[李雪铭, 徐梁, 田深圳, 等. 基于地理尺度的中国人居环境研究进展. 地理科学, 2022, 42(6): 951-962.]
|
| [37] |
[李永钧, 张单阳, 王珂, 等. 乡村生态系统文化服务供需关系研究: 以浙江省湖州市为例. 生态学报, 2022, 42(17): 6888-6899.]
|
| [38] |
|
| [39] |
|
| [40] |
|
| [41] |
|
| [42] |
|
| [43] |
[张立娟, 李艳红, 任涵, 等. 气候变化背景下青冈分布变化及其对中国亚热带北界的指示意义. 地理研究, 2020, 39(4): 990-1001.]
|
| [44] |
[杨楠, 马东源, 钟雪, 等. 基于MaxEnt模型的四川王朗国家级自然保护区蓝马鸡栖息地适宜性评价. 生态学报, 2020, 40(19): 7064-7072.]
|
| [45] |
[白晓娟, 陈海, 刘迪, 等. 基于MaxEnt模型的生态系统服务需求及其簇的空间分异: 以陕西省米脂县为例. 生态学报, 2023, 43(7): 2745-2755.]
|
| [46] |
|
| [47] |
[范梦余, 陈怡宁, 张辉. 湖南旅游客源市场结构与目的地形象感知: 基于地理标记照片的实证分析. 经济地理, 2021, 41(12): 223-232.]
|
| [48] |
[孙佼佼, 郭英之. 自然保护地数字文化生态系统服务质量测度与出游意愿效应: 以中国五地国家公园网络空间为例. 自然资源学报, 2023, 38(4): 983-994.]
|
| [49] |
|
| [50] |
|
| [51] |
|
| [52] |
|
| [53] |
[孔翔, 卓方勇. 文化景观对建构地方集体记忆的影响: 以徽州呈坎古村为例. 地理科学, 2017, 37(1): 110-117.]
|
| [54] |
|
| [55] |
|
| [56] |
|
/
| 〈 |
|
〉 |