
海岸带景观破碎化对固碳服务流的影响
|
闫晓露(1987-), 女, 黑龙江齐齐哈尔人, 博士, 副教授, 博士生导师, 主要从事海岸带景观与可持续研究。E-mail: xlyan@lnnu.edu.cn |
收稿日期: 2023-07-10
修回日期: 2023-12-21
网络出版日期: 2024-01-29
基金资助
中国科学院战略性先导科技专项(XDA23100403)
国家自然科学基金项目(42101113)
教育部人文社会科学研究项目(21YJCZH193)
教育部学位与研究生教育发展中心主题案例项目(ZT-221016504)
辽宁省社科联2023年度辽宁省经济社会发展研究课题(2023lslybkt-081)
Impacts of landscape fragmentation of coastal zone on carbon sequestration service flow
Received date: 2023-07-10
Revised date: 2023-12-21
Online published: 2024-01-29
Supported by
Strategic Priority Research Program of the Chinese Academy of Sciences(XDA23100403)
Natural Science Foundation of China(42101113)
Humanities and Social Sciences research project of Ministry of Education(21YJCZH193)
Ministry of Education Thematic Case Project of the Center for the Development of Degree and Graduate Education(ZT-221016504)
Liaoning Provincial Federation of Social Sciences 2023 Research Topics on Economic and Social Development in Liaoning Province(2023lslybkt-081)
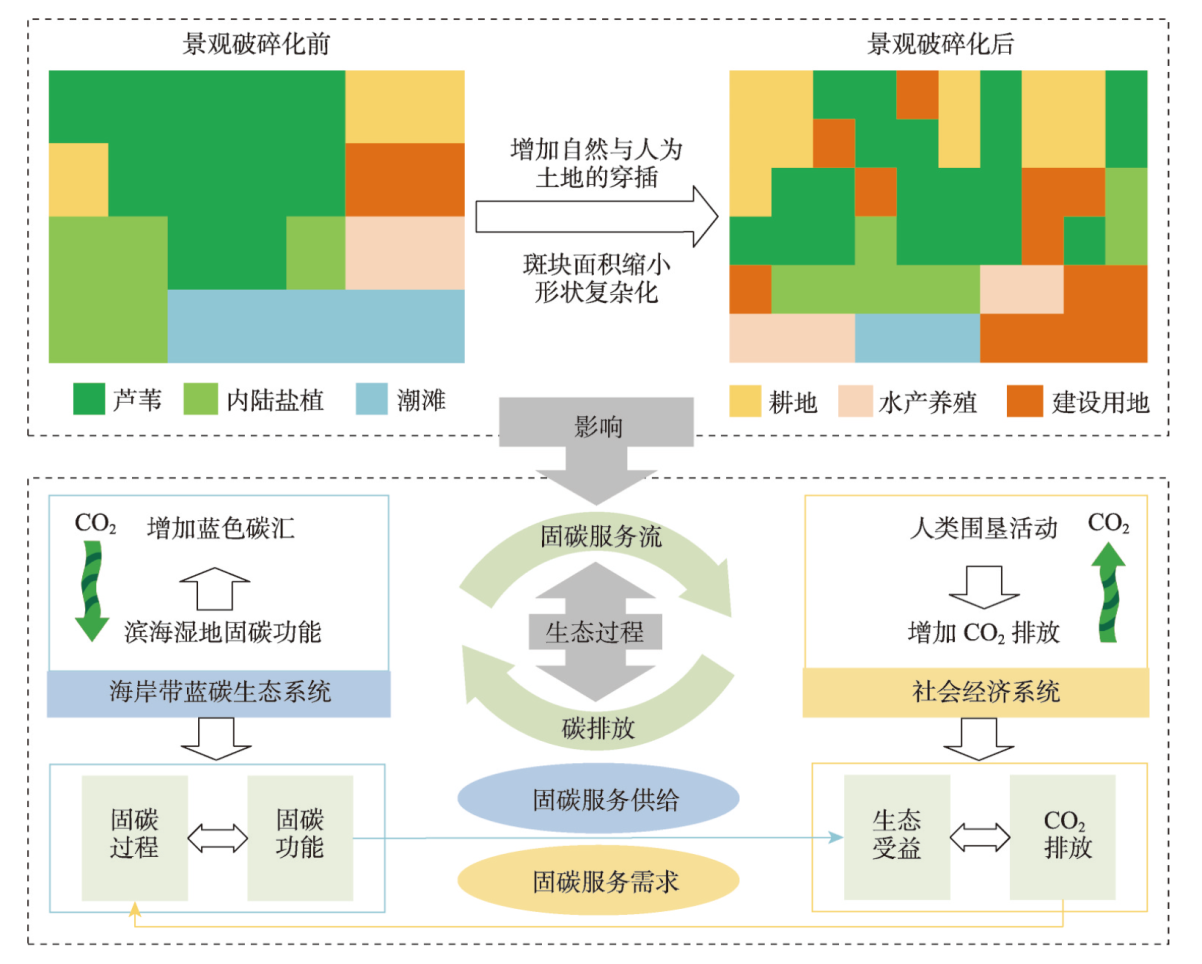
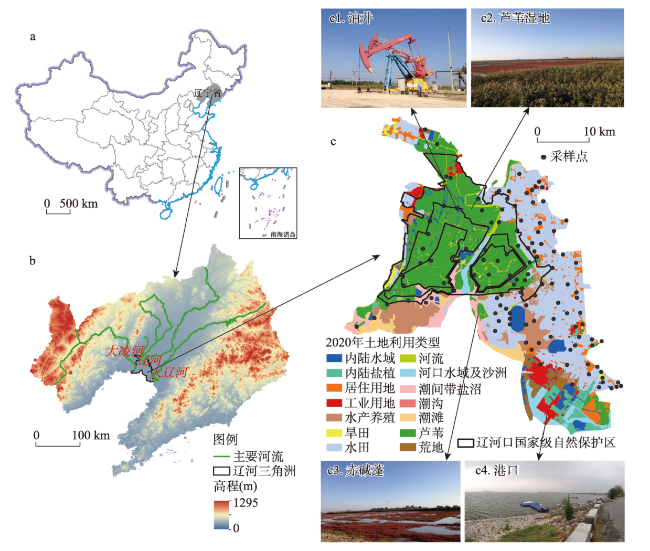
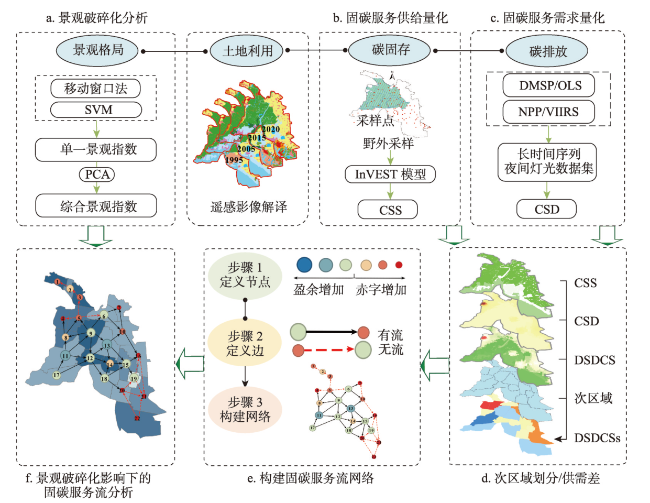
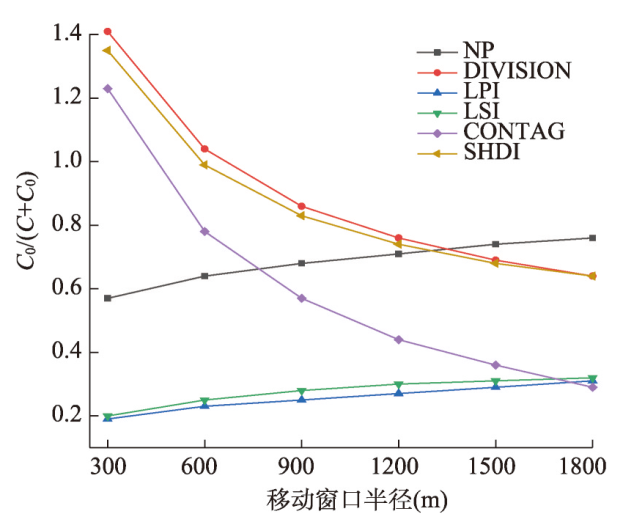
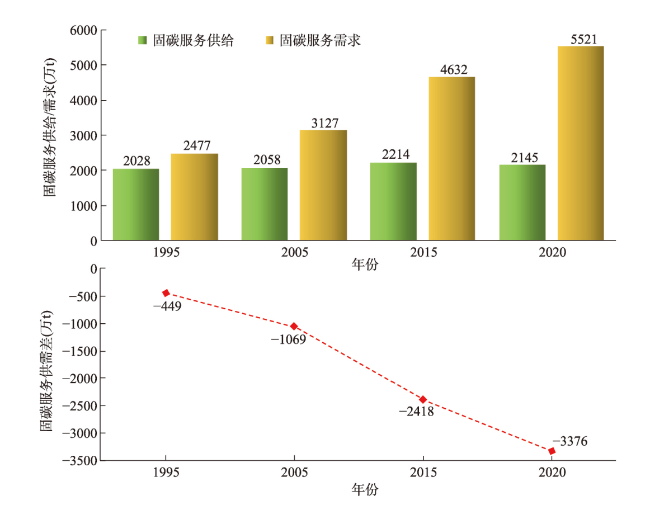
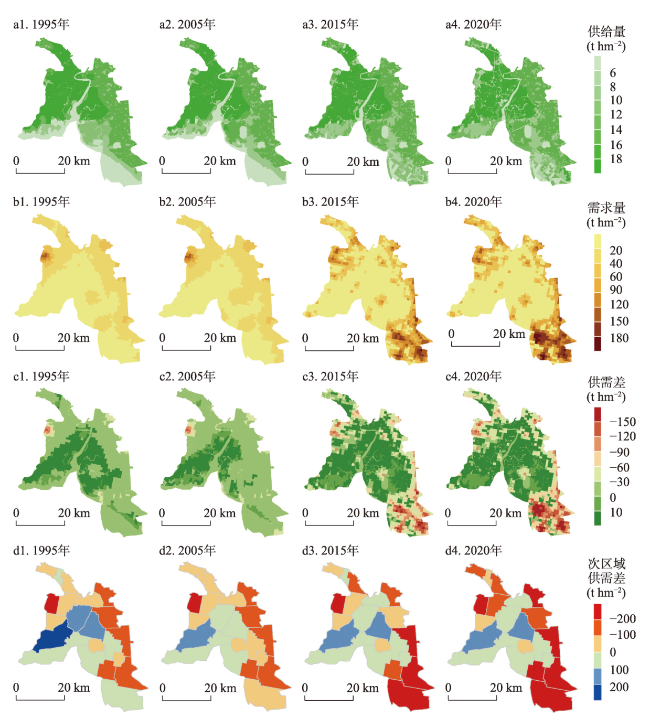
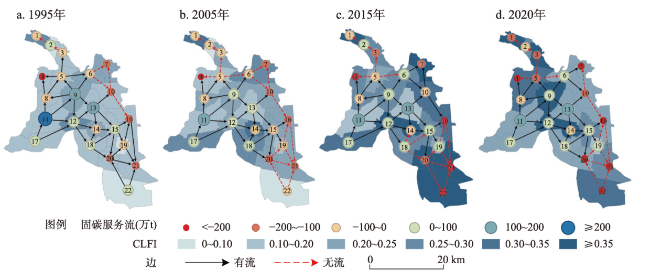
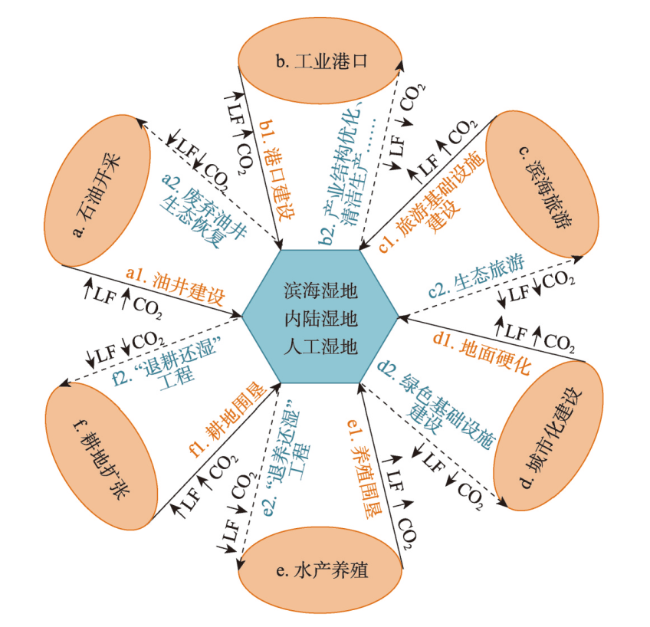
蓝碳作为解决全球气候变化问题的长期方案之一,其和谐的供需动态关系对促进区域碳平衡和可持续管理具有重要意义。随着海岸带社会经济的快速发展,海岸带景观破碎化显著,直接影响其系统中能量流、物质循环等生态过程。然而,海岸带景观破碎化对固碳服务供需关系及流的影响尚不明确。基于此,本文在建立海岸带景观破碎化对固碳服务流影响框架基础上,综合土地利用数据、碳储量采样数据和夜间灯光数据,运用移动窗口法、InVEST模型及网络模型,以中国北方典型淤泥质海岸带——辽河三角洲为例开展实证研究。结果表明:① 1995—2020年随着辽河三角洲景观破碎化加剧,固碳服务需求量增加3044万t,固碳服务供给量先增后减,整体变化不显著,固碳服务供需差从1995年449万t增加到2020年3376万t;② 不同人类活动强度导致的景观破碎化对固碳服务流流量的负面影响存在差异,其中对农业围垦区更为显著,对工业港口围垦区的影响呈先增后减趋势,而对芦苇湿地作用甚微;③ 景观破碎化对固碳服务流空间格局的影响体现在固碳服务流网络密度及连通性上,其引起服务流中断、服务流方向改变;④ 芦苇保护区和农业围垦区具有重要生态功能,应严格控制生态红线提升碳汇能力;工业港口围垦区应加强生态廊道建设,提升景观连通性,恢复碳汇功能。本文揭示景观破碎化与固碳服务流的关系,研究结果可为中国保护性战略重点区乃至全球其他类似淤泥质海岸带的生态修复和碳汇能力提升提供科学依据及管理参考。
闫晓露 , 武帅 , 吴雪雪 , 王煜景然 , 胡远满 . 海岸带景观破碎化对固碳服务流的影响[J]. 地理学报, 2024 , 79(1) : 114 -133 . DOI: 10.11821/dlxb202401008
As one of the long-term solutions to the global climate change problem, the harmonious dynamic relationship between supply and demand of blue carbon is of great significance in promoting regional carbon balance and sustainable management. With the rapid socio-economic development, the landscape fragmentation of the coastal zone is significant, which directly affects the ecological processes such as energy flow and material circulation in its system. However, the effects of coastal zone landscape fragmentation on the supply-demand relationship and flow of carbon sequestration services are not clear. Based on the framework of the impact of coastal landscape fragmentation on carbon sequestration service flow, this study synthesizes land use data, carbon storage sampling data and nighttime light data, and employs the moving window method, the InVEST model and the network model to conduct an empirical study in the Liaohe River Delta, a typical silty coastal zone in northern China. The results show that: (1) From 1995 to 2020, with the intensification of landscape fragmentation in the Liaohe River Delta, the demand for carbon sequestration services increased by 30.44 million tons and the supply of carbon sequestration services increased and then decreased, with the overall change being insignificant, and the difference between the supply and demand of carbon sequestration services increased from 4.49 million tons in 1995 to 33.76 million tons in 2020. (2) The negative impact of landscape fragmentation on the carbon sequestration service flow varied among different anthropogenic intensity, with more pronounced impact on agricultural reclamation areas, increasing and then decreasing impact on industrial port reclamation areas, while little impact on reed wetlands. (3) The impact of landscape fragmentation on the spatial pattern of carbon sequestration service flow is reflected in the density and connectivity of carbon sequestration service flow network, interrupting service flow and changing the direction of service flow. (4) The reed protection areas and agricultural reclamation areas have important ecological functions, and ecological red line should be strictly controlled to enhance carbon sequestration capacity. The industrial port reclamation areas should strengthen the construction of ecological corridors to enhance landscape connectivity and restore carbon sink function. This study reveals the relationship between landscape fragmentation and carbon sequestration service flow, and the results can provide scientific basis and management reference for ecological restoration and carbon sequestration capacity enhancement in China's conservation strategic key areas and other similar silt coastal zones around the world.
表1 1995—2020年辽河三角洲土地利用类型及其面积Tab. 1 Land use types and their areas in the Liaohe River Delta from 1995 to 2020 |
| 土地利用类型 | 面积(hm2) | |||||
|---|---|---|---|---|---|---|
| 一级分类 | 二级分类 | 1995年 | 2005年 | 2015年 | 2020年 | |
| 滨海湿地 | 河口水域及沙洲 | 23450 | 19032 | 4687 | 4488 | |
| 潮滩 | 1236 | 3178 | 1543 | 3224 | ||
| 潮沟 | 438 | 16 | 156 | 144 | ||
| 潮间带盐沼 | 491 | 290 | 3560 | 5605 | ||
| 内陆湿地 | 芦苇 | 48157 | 46335 | 46030 | 43076 | |
| 内陆盐植 | 3265 | 2019 | 4322 | 3607 | ||
| 河流 | 2505 | 2553 | 1801 | 4544 | ||
| 内陆水域 | 1561 | 3664 | 5680 | 5640 | ||
| 人工湿地 | 水田 | 36165 | 42829 | 41237 | 42195 | |
| 水产养殖 | 10314 | 14767 | 12908 | 11287 | ||
| 非湿地 | 旱田 | 571 | 472 | 2368 | 981 | |
| 居住用地 | 4078 | 4569 | 5101 | 7138 | ||
| 工业用地 | 397 | 1216 | 5400 | 5726 | ||
| 荒地 | 8362 | 31 | 6176 | 3315 | ||
表2 辽河三角洲碳池表(t hm-2)Tab. 2 Carbon pool table in the Liaohe River Delta (t hm-2) |
| 土地利用类型 | Ci-above | Ci-below | Ci-soil | Ci-dead |
|---|---|---|---|---|
| 河口水域及沙洲 | 0 | 0 | 0 | 0 |
| 潮滩 | 0.44 | 2.09 | 10.63 | 0.03 |
| 潮沟 | 0.44 | 2.09 | 10.63 | 0.03 |
| 潮间带盐沼 | 0.44 | 2.09 | 10.63 | 0.03 |
| 芦苇 | 1.26 | 6.01 | 12.81 | 0.22 |
| 内陆盐植 | 0.44 | 2.09 | 10.77 | 0.03 |
| 河流 | 0 | 0 | 0 | 0 |
| 内陆水域 | 0 | 0 | 0 | 0 |
| 水田 | 0.69 | 3.29 | 11.48 | 0.05 |
| 水产养殖 | 2.31 | 0 | 7.47 | 0 |
| 旱田 | 0.69 | 3.29 | 13.09 | 0.05 |
| 居住用地 | 0 | 0 | 9.75 | 0 |
| 工业用地 | 0 | 0 | 6.14 | 0 |
| 荒地 | 0 | 0 | 10.54 | 0 |
注:Ci-above为地上生物量碳密度;Ci-below为地下生物量碳密度;Ci-soil为土壤有机质碳密度;Ci-dead为死亡有机质碳密度。 |
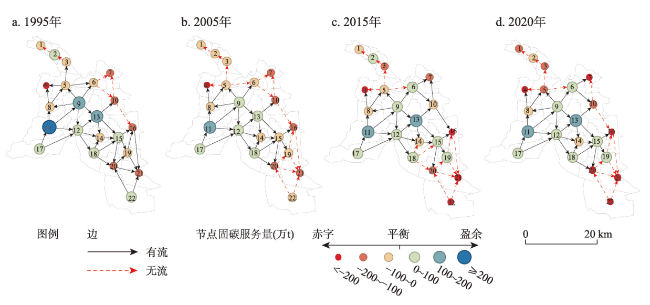
表3 1995—2020年辽河三角洲固碳服务流网络节点属性Tab. 3 Attributes of nodes of carbon sequestration service flow network in the Liaohe River Delta from 1995 to 2020 |
| 节点ID | 潜在的流(万t) | 实际的流(万t) | |||||||
|---|---|---|---|---|---|---|---|---|---|
| 1995年 | 2005年 | 2015年 | 2020年 | 1995年 | 2005年 | 2015年 | 2020年 | ||
| 1 | -55.77 | -56.80 | -74.08 | -123.54 | -105.99 | -145.91 | -197.42 | -287.11 | |
| 2 | 8.78 | -11.44 | 7.35 | -0.75 | -50.22 | -89.11 | -123.34 | -163.57 | |
| 3 | -63.91 | -66.35 | -121.96 | -137.68 | -59.01 | -77.67 | -130.69 | -162.82 | |
| 4 | -210.27 | -217.03 | -273.59 | -295.16 | -159.04 | -207.09 | -244.39 | -294.18 | |
| 5 | -70.36 | -80.75 | -96.30 | -129.21 | 14.72 | -33.97 | -26.19 | -75.42 | |
| 6 | -44.55 | -83.73 | 44.92 | 36.26 | -0.89 | -69.53 | 68.37 | 38.78 | |
| 7 | -132.22 | -135.81 | -173.14 | -201.15 | -154.53 | -233.89 | -120.50 | -190.14 | |
| 8 | -26.68 | -58.60 | -36.19 | -49.80 | 92.66 | 42.52 | 75.86 | 52.24 | |
| 9 | 113.60 | 52.02 | 81.03 | 63.94 | 193.78 | 127.618 | 160.90 | 138.32 | |
| 10 | -132.27 | -148.35 | -83.82 | -121.42 | -43.72 | -126.625 | 37.01 | -16.76 | |
| 11 | 214.48 | 188.43 | 199.32 | 178.83 | 236.54 | 226.79 | 239.61 | 223.14 | |
| 12 | 43.61 | 34.34 | 45.06 | 60.13 | 188.61 | 173.823 | 197.39 | 206.48 | |
| 13 | 167.78 | 86.01 | 161.98 | 159.30 | 269.41 | 169.47 | 259.96 | 255.79 | |
| 14 | -47.96 | -63.11 | -53.78 | -64.45 | 150.90 | 75.03 | 77.18 | 135.01 | |
| 15 | 58.39 | -53.17 | 81.10 | 79.31 | 345.28 | 102.06 | 223.44 | 299.59 | |
| 16 | -132.86 | -138.63 | -206.73 | -241.99 | 25.67 | -138.63 | -195.78 | -303.11 | |
| 17 | 52.12 | 76.73 | 80.56 | 88.61 | 52.12 | 76.73 | 80.56 | 88.61 | |
| 18 | 78.11 | 13.18 | 36.90 | 21.88 | 140.98 | 71.12 | -64.46 | 90.17 | |
| 19 | -19.77 | -21.84 | 35.30 | 33.61 | 130.59 | -35.88 | -164.08 | -305.19 | |
| 20 | -100.52 | -110.36 | -130.26 | -208.42 | 70.54 | -96.12 | -548.12 | -877.31 | |
| 21 | -166.72 | -187.18 | -668.26 | -826.33 | 49.26 | -464.59 | -1876.75 | -1628.20 | |
| 22 | 17.95 | -86.98 | -1273.22 | -1628.20 | 17.95 | -86.98 | -1273.22 | -2534.80 | |
注:潜在的流为各节点的固碳服务供需差;实际的流为各节点本身的固碳服务供需差与其他节点补给的固碳服务流量之和,即边。 |
图11 1995—2020年辽河三角洲固碳服务流网络Fig. 11 The carbon sequestration service flow network of the Liaohe River Delta from 1995 to 2020 |
表4 1995—2020年辽河三角洲固碳服务流网络总体特征Tab. 4 Overall characteristics of carbon sequestration service flow network in the Liaohe River Delta from 1995 to 2020 |
| 年份 | 盈余节点(个) | 赤字节点(个) | 有流的边(个) | 无流的边(个) | 网络密度 |
|---|---|---|---|---|---|
| 1995年 | 9 | 13 | 35 | 6 | 0.85 |
| 2005年 | 6 | 16 | 25 | 16 | 0.61 |
| 2015年 | 10 | 12 | 26 | 15 | 0.63 |
| 2020年 | 9 | 13 | 27 | 14 | 0.66 |
| [1] |
|
| [2] |
|
| [3] |
[闫晓露, 钟敬秋, 韩增林, 等. 近40年辽东湾北部围垦区内外滨海湿地景观演替特征及驱动力分析. 地理科学, 2019, 39(7): 1155-1165.]
|
| [4] |
[李加林, 田鹏, 邵姝遥, 等. 中国东海区大陆岸线变迁及其开发利用强度分析. 自然资源学报, 2019, 34(9): 1886-1901.]
|
| [5] |
[孙才志, 王泽宇, 李博, 等. 中国海洋经济可持续发展基础理论与实证研究. 北京: 科学出版社, 2021: 140-143.]
|
| [6] |
[曹晨晨, 苏芳莉, 李海福, 等. 辽河口盐地碱蓬湿地景观破碎化及驱动机制. 生态学报, 2022, 42(2): 581-589.]
|
| [7] |
|
| [8] |
|
| [9] |
|
| [10] |
|
| [11] |
[王嘉丽, 周伟奇. 生态系统服务流研究进展. 生态学报, 2019, 39(12): 4213-4222.]
|
| [12] |
|
| [13] |
|
| [14] |
|
| [15] |
|
| [16] |
|
| [17] |
|
| [18] |
|
| [19] |
|
| [20] |
|
| [21] |
Ministry of Ecology and Environment of China. Modernization of harmonious coexistence between humans and nature by building a beautiful China. Environmental Protection, 2023, 51(15): 9-12.
[ 生态环境部. 以美丽中国建设全面推进人与自然和谐共生的现代化. 环境保护, 2023, 51(15): 9-12.]
|
| [22] |
|
| [23] |
|
| [24] |
|
| [25] |
|
| [26] |
|
| [27] |
|
| [28] |
[李静泰, 闫丹丹, 么秀颖, 等. 中国滨海湿地碳储量估算. 土壤学报, 2023, 60(3): 800-814.]
|
| [29] |
[苏伟忠, 杨桂山, 甄峰. 长江三角洲生态用地破碎度及其城市化关联. 地理学报, 2007, 62(12): 1309-1317.]
|
| [30] |
[刘绿怡, 丁圣彦, 任嘉衍, 等. 景观空间异质性对地表水质服务的影响研究: 以河南省伊河流域为例. 地理研究, 2019, 38(6): 1527-1541.]
|
| [31] |
[陈万旭, 梁加乐, 卞娇娇, 等. 黄河流域景观破碎化对土壤保持服务影响研究. 地理科学, 2022, 42(4): 589-601.]
|
| [32] |
|
| [33] |
[巫丽芸, 何东进, 游巍斌, 等. 东山岛海岸带景观破碎化时空梯度分析. 生态学报, 2020, 40(3): 1055-1064.]
|
| [34] |
[张金茜, 巩杰, 柳冬青. 地理探测器方法下甘肃白龙江流域景观破碎化与驱动因子分析. 地理科学, 2018, 38(8): 1370-1378.]
|
| [35] |
[隋玉正, 陈小璇, 李淑娟, 等. 海岸带蓝碳时空演变及其服务价值评估: 以胶州湾为例. 资源科学, 2019, 41(11): 2119-2130.]
|
| [36] |
[张绪良, 张朝晖, 徐宗军, 等. 黄河三角洲滨海湿地植被的碳储量和固碳能力. 安全与环境学报, 2012, 12(6): 145-149.]
|
| [37] |
[吴健生, 牛妍, 彭建, 等. 基于DMSP/OLS夜间灯光数据的1995—2009年中国地级市能源消费动态. 地理研究, 2014, 33(4): 625-634.]
|
| [38] |
[许正森, 徐永明. 整合DMSP/OLS和NPP/VIIRS夜间灯光遥感数据的长江三角洲城市格局时空演化研究. 地球信息科学学报, 2021, 23(5): 837-849.]
|
| [39] |
|
| [40] |
|
| [41] |
|
| [42] |
|
| [43] |
[许艳, 濮励杰, 张润森, 等. 江苏沿海滩涂围垦耕地质量演变趋势分析. 地理学报, 2017, 72(11): 2032-2046.]
|
| [44] |
|
| [45] |
|
| [46] |
|
| [47] |
|
| [48] |
|
| [49] |
|
| [50] |
|
| [51] |
|
| [52] |
[杨林生, 邓浩宇, 廖晓勇, 等. 科技支撑美丽中国建设的进展和展望. 中国环境管理, 2022, 14(6): 17-24.]
|
| [53] |
[王少剑, 黄永源. 中国城市碳排放强度的空间溢出效应及驱动因素. 地理学报, 2019, 74(6): 1131-1148.]
|
| [54] |
|
/
| 〈 |
|
〉 |
