
中国城市群高铁通达格局与空间交叠特征
|
郑文升(1982-), 男, 安徽六安人, 教授, 博士生导师, 主要从事城市群网络化发展研究、区域与国土空间规划研究。E-mail: zhengwensheng@ccnu.edu.cn |
收稿日期: 2021-11-22
修回日期: 2022-11-07
网络出版日期: 2023-04-14
基金资助
国家自然科学基金项目(41971167)
华中师范大学基本科研业务费(CCNU22JC026)
High-speed railway access pattern and spatial overlap characteristics of China's urban agglomerations
Received date: 2021-11-22
Revised date: 2022-11-07
Online published: 2023-04-14
Supported by
National Natural Science Foundation of China(41971167)
Fundamental Research Funds for the Central Universities(CCNU22JC026)
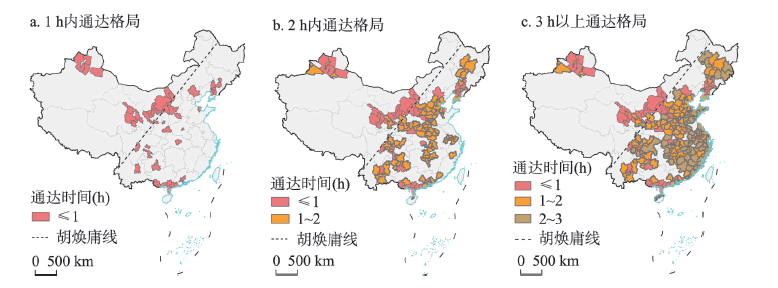
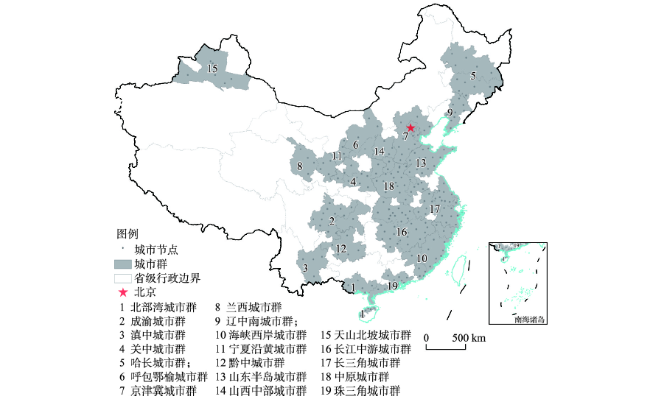
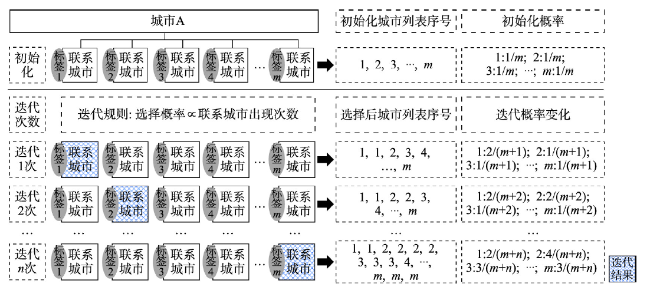
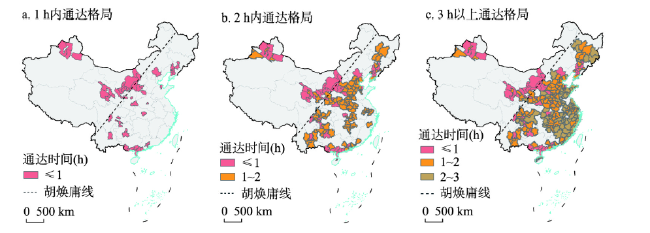
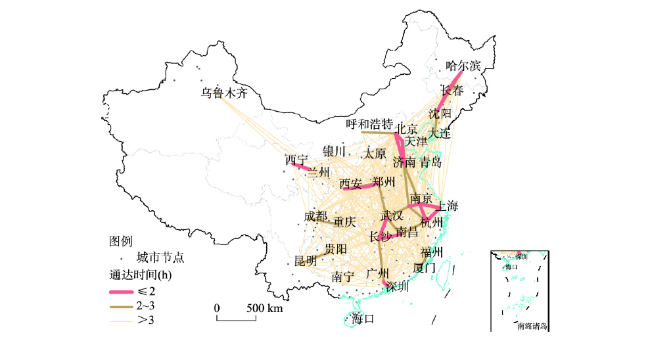
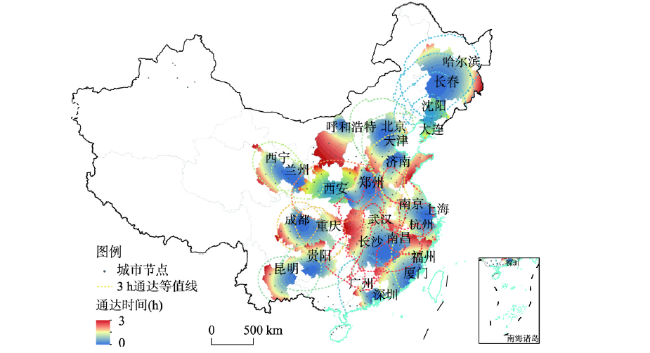
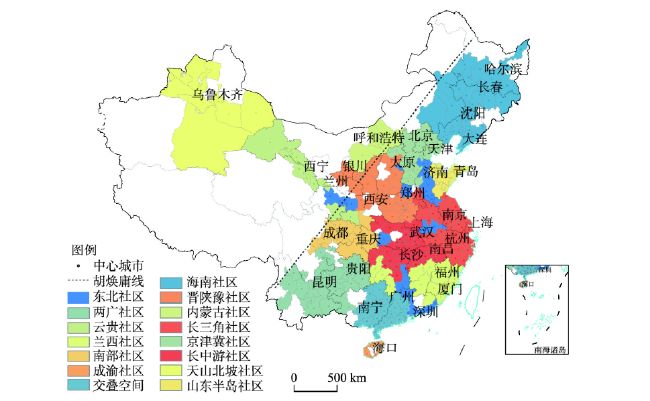
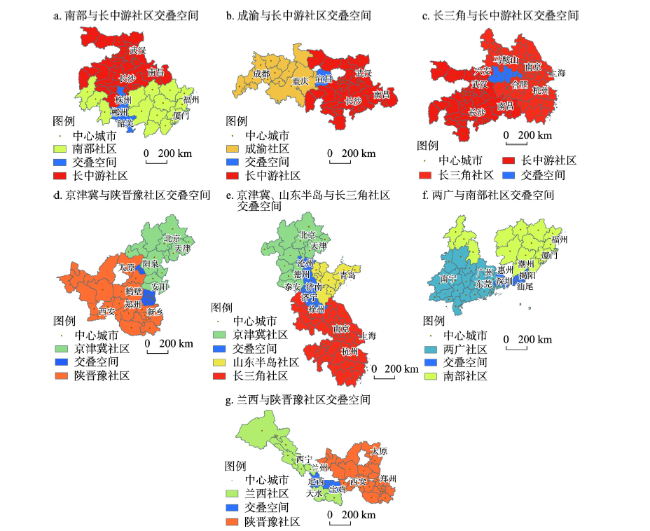
交通网络构筑了城市关联骨架,发达的交通网络能够深刻影响城市空间联系并重塑区域空间格局。本文使用2021年高铁客运时刻数据,以《交通强国建设纲要》中提出的建设“全国123出行交通圈”为切入点,对比分析了全国城市群以及中心城市通达格局及差异,进一步使用SLPA模型对全国所有高铁通达城市进行社区划分与交叠空间识别,探究区域空间格局演化态势以及交叠空间地理特征。研究结论为:① 中国城市群2 h内通达的数量为15个,占城市群总量的79%;城市加权平均通达时间上,呈现由中心地区向外围地区由低向高扩大的“圈层式”空间格局。② 中心城市3 h通达等值线覆盖圈大多超出城市群范围,表现出“泛城市群”空间特征。③ 通过交叠社区发现算法将中国城市网络空间划分为14个社区,“胡焕庸线”以西仅有3个社区。④ 对已划分社区进行交叠空间识别,存在交叠的9个社区共有27个交叠城市产生。⑤ 在空间形态上,交叠城市呈点状或带状分布;从空间区位来看,交叠城市多位于区域中心城市周边,在行政区划上多处于省间交界地带;在城市功能上看,交叠城市依托高铁流通道,凭借过渡与转换功能,表现为社区间网络联系桥梁。高铁交通视角下区域空间格局呈现跨城市群联系与组团发展态势,交叠空间网络化、交互式、跨尺度作用特征凸显。总体来看,使用SLPA交叠社区发现模型研究区域交叠问题具有一定说服力。为了城市和区域更好的发展,对已划分出的交叠社区,可以尝试填补空白区域并提升社区间运能;对已识别出的交叠空间,可以尝试结合自身优势创造更多跨区域联系可能。
郑文升 , 熊亚骏 , 王晓芳 , 黄建武 . 中国城市群高铁通达格局与空间交叠特征[J]. 地理学报, 2023 , 78(4) : 930 -936 . DOI: 10.11821/dlxb202304010
A well-developed transportation network can profoundly influence the spatial connection of cities and reshape the regional spatial pattern. This paper used 2021 high-speed railway passenger time data, and took the construction of "National 123 Travel Traffic Circle" proposed in the "Outline for the Construction of a Strong Transportation Country" as the starting point. It compares and analyzes the access patterns and differences of national urban agglomerations and central cities, and further uses the SLPA model to identify the community division and overlapping space of all high-speed railway connected cities in China, and explores regional development trend and the geographic characteristics of overlapping space. Some conclusions can be drawn as follows: (1) There were 15 urban agglomerations with 2-hour access to Chinese urban agglomerations, accounting for 79% of the total number of urban agglomerations, and the weighted average access time of cities showed a "circle-type" spatial pattern of expanding from the central area to the peripheral areas from low to high. (2) Most of the 3-hour access contour coverage areas of central cities are beyond urban agglomerations, showing the spatial characteristics of "cross-urban agglomerations". (3) The overlapping community discovery algorithm divides China's urban space into 14 communities, and there are only 3 communities west of the Hu Line. (4) The overlapping space was identified for the divided communities, in which 9 communities overlapping a total of 27 cities were generated. (5) In terms of spatial morphology, the overlapping cities were distributed in a point or belt pattern; in terms of spatial location, the overlapping cities are mostly located around the regional central city, and in terms of administrative divisions, they were mostly in the inter-provincial junction zone; in terms of urban function, the overlapping cities rely on the high-speed railway circulation channel, and through the transition and conversion function, they were manifested as a network connection bridge between communities. From the perspective of high-speed railway transportation, the regional spatial pattern showed cross-urban agglomeration linkage and group development, and the networked, interactive, and cross-scale role of overlapping spaces was highlighted. For the better development of the city and the region, for the characteristics of overlapping communities and overlapping spaces, communities can try to fill in the gaps and improve the inter-community capacity, while overlapping spaces can try to combine their own advantages to create more cross-regional connection possibilities.
表1 2021年中国城市群平均通达时间Tab. 1 Average access time to China's urban agglomerations in 2021 |
| 序号 | 城市群 | 加权平均通达时间(h) | 序号 | 城市群名称 | 加权平均通达时间(h) |
|---|---|---|---|---|---|
| 1 | 兰西城市群 | 0.54 | 11 | 京津冀城市群 | 1.80 |
| 2 | 宁夏沿黄城市群 | 0.57 | 12 | 长三角城市群 | 2.10 |
| 3 | 呼包鄂榆城市群 | 0.48 | 13 | 长江中游城市群 | 2.18 |
| 4 | 山西中部城市群 | 0.90 | 14 | 海峡西岸城市群 | 2.47 |
| 5 | 关中城市群 | 1.18 | 15 | 珠三角城市群 | 1.17 |
| 6 | 中原城市群 | 1.55 | 16 | 北部湾城市群 | 1.66 |
| 7 | 山东半岛城市群 | 2.15 | 17 | 滇中城市群 | 1.29 |
| 8 | 天山北坡城市群 | 1.11 | 18 | 黔中城市群 | 1.39 |
| 9 | 哈长城市群 | 1.93 | 19 | 成渝城市群 | 1.44 |
| 10 | 辽中南城市群 | 0.97 |
表2 交叠空间概况Tab. 2 Overview of overlapping spaces |
| 交叠类型 | 交叠空间内部城市 | 城市数量(个) |
|---|---|---|
| 长中游社区、南部社区 | 韶关、株洲、郴州 | 3 |
| 长中游社区、成渝社区 | 宜昌 | 1 |
| 长中游社区、长三角社区 | 合肥、马鞍山、六安 | 3 |
| 京津冀社区、晋陕豫社区 | 阳泉、安阳、鹤壁、新乡 | 4 |
| 京津冀社区、山东半岛社区、长三角社区 | 济南、枣庄、济宁、泰安、德州、沧州、徐州 | 7 |
| 两广社区、南部社区 | 汕头、惠州、汕尾、东莞、潮州、揭阳 | 6 |
| 晋陕豫社区、兰西社区 | 宝鸡、天水、定西 | 3 |
| [1] |
[方创琳. 中国城市群研究取得的重要进展与未来发展方向. 地理学报, 2014, 69(8):1130-1144.]
|
| [2] |
[汪德根, 范子祺, 赵美风. 长江经济带主要城市群2h出行交通圈格局特征. 地理研究, 2022, 41(5): 1388-1406.]
|
| [3] |
The Communist Party of China Central Committee and the State Council issued the "Outline for Building A Leading Transportation Nation". http://www.gov.cn/zhengce/2019-09/19/content_5431432.htm.
[中共中央国务院印发《交通强国建设纲要》. http://www.gov.cn/zhengce/2019-09/19/content_5431432.htm.]
|
| [4] |
|
| [5] |
|
| [6] |
[吴威, 曹有挥, 梁双波. 20世纪80年代以来长三角地区综合交通可达性的时空演化. 地理科学进展, 2010, 29(5): 619-626.]
|
| [7] |
[李沛权, 曹小曙. 广佛都市圈公路网络通达性及其空间格局. 经济地理, 2011, 31(3): 371-378.]
|
| [8] |
[刘辉, 申玉铭, 孟丹, 等. 基于交通可达性的京津冀城市网络集中性及空间结构研究. 经济地理, 2013, 33(8): 37-45.]
|
| [9] |
[刘正兵, 刘静玉, 何孝沛, 等. 中原经济区城市空间联系及其网络格局分析: 基于城际客运流. 经济地理, 2014, 34(7): 58-66.]
|
| [10] |
[刘安乐, 杨承玥, 明庆忠, 等. 边疆山地城市群交通网络的时空演化: 以滇中城市群为例. 经济地理, 2016, 36(4): 70-77.]
|
| [11] |
[孙阳, 姚士谋, 张落成. 长三角城市群“空间流”层级功能结构: 基于高铁客运数据的分析. 地理科学进展, 2016, 35(11): 1381-1387.]
|
| [12] |
[梅琳, 黄柏石, 敖荣军, 等. 长江中游城市群高速铁路可达性格局及演变. 经济地理, 2018, 38(6): 62-68.]
|
| [13] |
|
| [14] |
|
| [15] |
|
| [16] |
|
| [17] |
|
| [18] |
[吴康, 方创琳, 赵渺希, 等. 京津城际高速铁路影响下的跨城流动空间特征. 地理学报, 2013, 68(2): 159-174.]
|
| [19] |
[王姣娥, 焦敬娟, 金凤君. 高速铁路对中国城市空间相互作用强度的影响. 地理学报, 2014, 69(12): 1833-1846.]
|
| [20] |
[金凤君, 焦敬娟, 齐元静. 东亚高速铁路网络的发展演化与地理效应评价. 地理学报, 2016, 71(4): 576-590.]
|
| [21] |
[黄洁, 杜德林, 王姣娥, 等. 基于城市群尺度的高铁列车与长途汽车网络结构比较. 地理科学, 2020, 40(12): 1958-1966.]
|
| [22] |
|
| [23] |
|
| [24] |
[何丹, 杨犇. 高速铁路对沿线地区城市腹地的影响研究: 以皖北地区为例. 城市规划学刊, 2011(4): 66-74.]
|
| [25] |
[初楠臣, 姜博, 赵映慧, 等. 城际高铁对未来黑龙江城镇体系空间格局的影响及优化. 经济地理, 2016, 36(4): 78-83, 125.]
|
| [26] |
[郭嘉颖, 吴威, 曹有挥, 等. 铁路高速化对长三角城市群区域空间联系格局的影响. 长江流域资源与环境, 2019, 28(12): 2817-2826.]
|
| [27] |
|
| [28] |
|
| [29] |
|
| [30] |
|
| [31] |
|
| [32] |
|
| [33] |
|
| [34] |
[方创琳, 王振波, 马海涛. 中国城市群形成发育规律的理论认知与地理学贡献. 地理学报, 2018, 73(4): 651-665.]
|
| [35] |
|
| [36] |
[陈伟, 刘卫东, 柯文前, 等. 基于公路客流的中国城市网络结构与空间组织模式. 地理学报, 2017, 72(2): 224-241.]
|
| [37] |
[郑文升, 熊亚骏, 王晓芳. 长江中游城市群铁路流网络演化特征: 基于博弈交叠社区模型的分析. 经济地理, 2022, 42(11): 9-18.]
|
| [38] |
[吴小兰, 章成志. 基于贡献度的多标签传播重叠社区发现研究. 情报学报, 2015, 34(9): 949-957.]
|
| [39] |
|
| [40] |
|
| [41] |
|
| [42] |
|
| [43] |
|
| [44] |
|
| [45] |
[陈娱, 许珺. 考虑地理距离的复杂网络社区挖掘算法. 地球信息科学学报, 2013, 15(3): 338-344.]
|
| [46] |
[熊鹰, 徐亚丹, 孙维筠, 等. 城市群空间结构效益评价与优化研究: 以长株潭城市群与环洞庭湖城市群为例. 地理科学, 2019, 39(10): 1561-1569.]
|
/
| 〈 |
|
〉 |