
1916—2020年北京城市变迁及其与区域气候演化的关系
|
杨仕琪(1999-), 女, 河南洛阳人, 硕士研究生, 主要从事城市生态遥感方向研究。E-mail: yangshiqi5023@igsnrr.ac.cn |
收稿日期: 2022-07-20
修回日期: 2023-03-04
网络出版日期: 2023-03-27
基金资助
国家自然科学基金项目(41871343)
北京市气象灾害风险普查地理空间信息产品研制与技术服务项目(0701-214130210301)
Spatio-temporal evolution of urbanization and its relationship with regional climate change in Beijing over the past century
Received date: 2022-07-20
Revised date: 2023-03-04
Online published: 2023-03-27
Supported by
National Natural Science Foundation of China(41871343)
Project of Beijing Meteorological Disaster Risk Census in Geospatial Information Product Development and Technical Services(0701-214130210301)
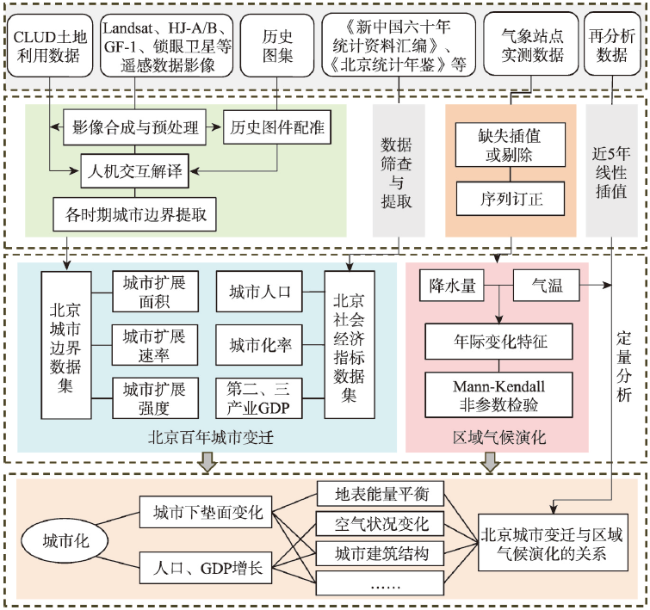
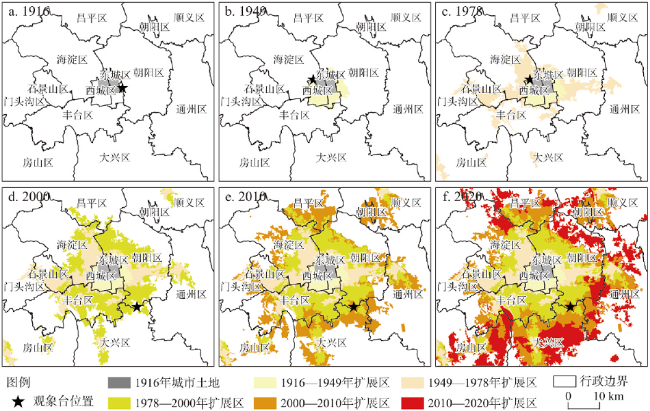
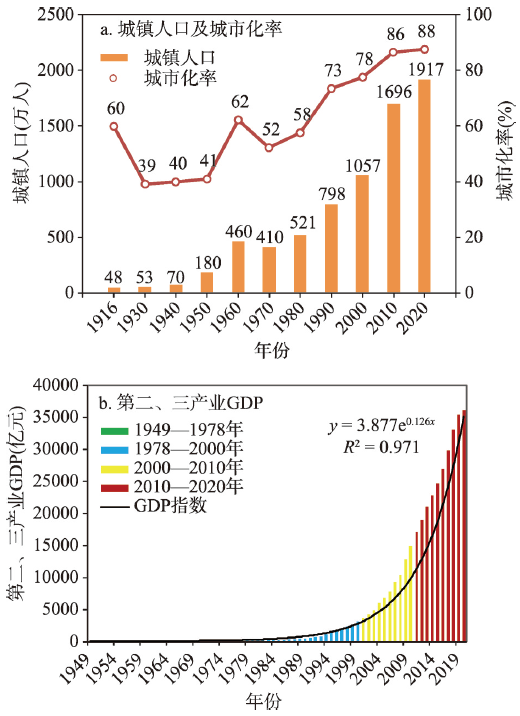
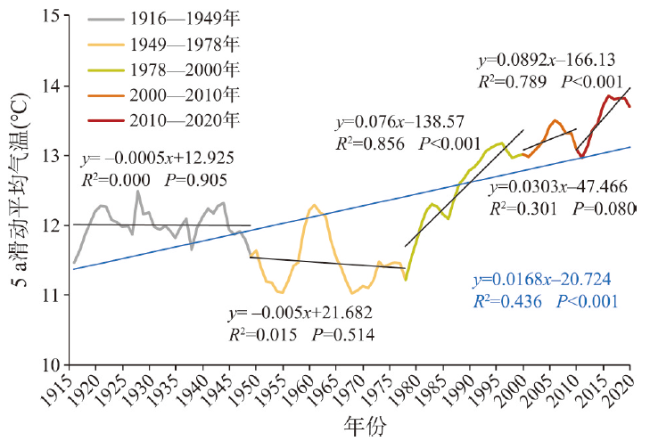
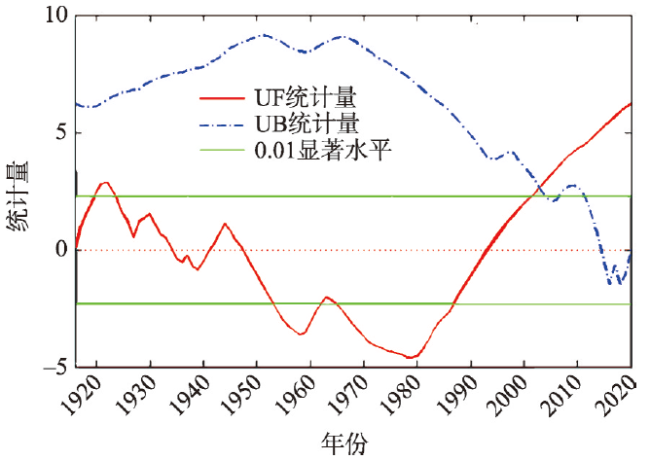
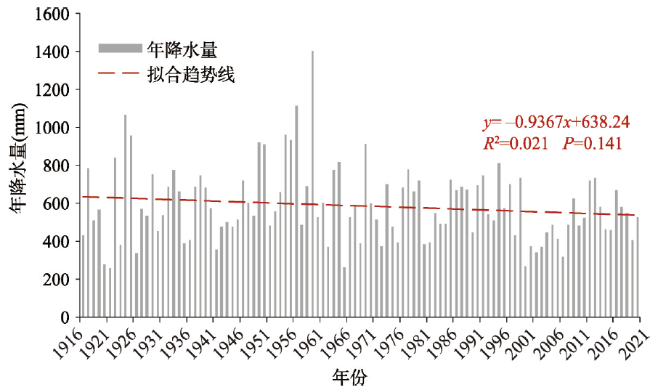
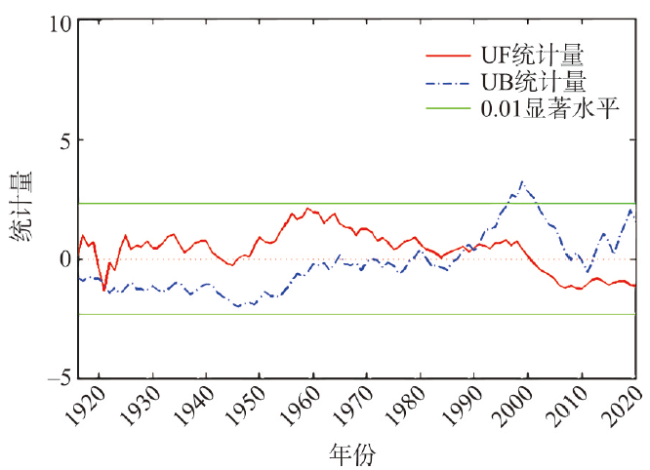
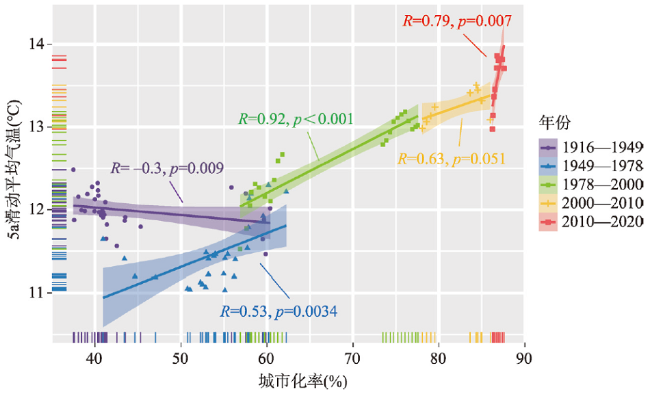
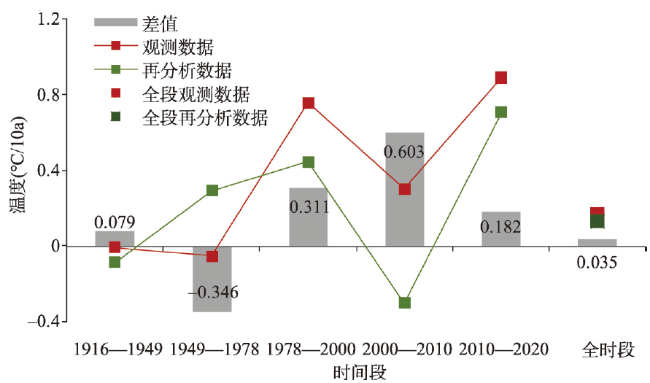
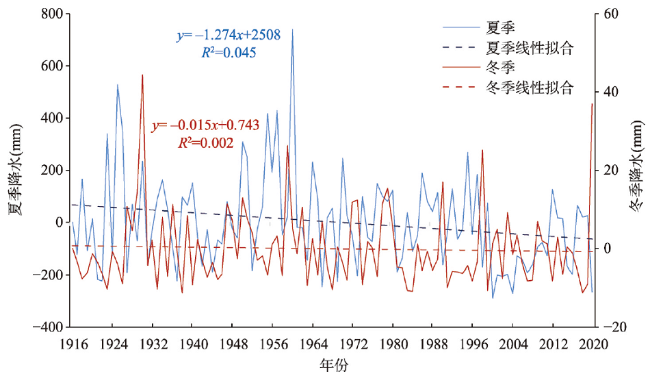
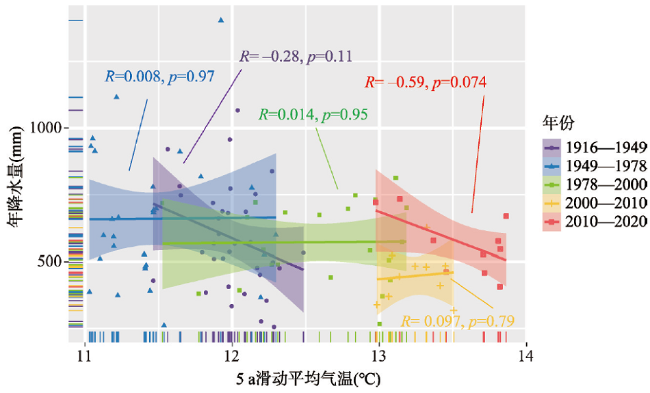
剖析百年尺度的城市变迁与气候要素变化对提升区域气候演变机理的认知具有重要意义。本文基于卫星遥感图像、社会经济数据和气象站点实测等数据,采用人机交互解译方法,刻画了1916—2020年北京城市扩展过程。利用滑动平均法和Mann-Kendall趋势检验方法,分析了关键气象要素的变化特征,从而揭示了百年尺度城市土地利用变化和社会经济发展与区域气候变化之间的关系。研究表明:1916—2020年北京城市土地面积增长了64.48倍,围绕中心地域呈圈层式蔓延扩展,呈现“缓慢—加速—减速”的扩展模式,城市扩展速度在2000—2010年达到峰值,为70.12 km2/a。1916—2020年北京的5 a滑动平均气温和年降水量分别为12.25 ℃和588.6 mm。随着城市发展,1916—2020年北京市5 a滑动平均气温以0.22 ℃/10a波动上升,1978年以来升温显著。年降水量则呈现波动下降趋势,速率为9.37 mm/10a。城市不透水面的加速扩张可能造成地表能量收支的改变,从而引发城市变暖。城市化率与气温升高具有协同关系,不同时段差异显著,1916—2020年北京城市化对区域升温的贡献为20.83%。另一方面,地表能量收支改变与空气污染物排放增加可能导致北京城市地区降水减少。本文结果可为提升北京城市变迁对区域气候演变影响过程和机制的认知提供科学参考。

杨仕琪 , 王冀 , 窦银银 , 栾庆祖 , 匡文慧 . 1916—2020年北京城市变迁及其与区域气候演化的关系[J]. 地理学报, 2023 , 78(3) : 620 -639 . DOI: 10.11821/dlxb202303008
Understanding the mechanisms of regional climate evolution requires extensive research on long-term urbanization and meteorological elements. The various data sources and an interactive interpretation method were utilized to reproduce the urban expansion in Beijing over the past century. The relationship between urban development and regional climate change was then determined by using the moving average method and the Mann-Kendall trend test. We found that the area of urban land in Beijing increased 64.48 times from 1916 to 2020, expanding in a circle around the central region. The rate of urban expansion peaked at 70.12 km2/a between 2000 and 2010. The average annual temperature and precipitation from 1916 to 2020 in Beijing were 12.25 ℃ and 588.6 mm, respectively. The 5-year moving average temperature fluctuated upward by 0.22 ℃/10a over the past century, with a notable warming trend since 1978. Precipitation trended downward at a rate of 9.37 mm/10a. The accelerated expansion of the impervious surface area in the city might lead to urban warming by altering the surface energy balance. The rate of urbanization and the regional temperature rise were positively correlated, with urbanization accounting for 20.83% of the regional warming in Beijing. Changes in the surface energy balance and an increase in air pollution emissions might result in a decline in precipitation. The results provide scientific resources for advancing knowledge of the processes and mechanisms by which urban development influences the regional climate change.
Key words: urban expansion; climate change; long-term scale; spatiotemporal patterns; land use
表1 研究数据来源Tab. 1 Lists of data sources |
| 数据类别 | 数据源 | 时间 | 数据类型/分辨率 | 数据来源 |
|---|---|---|---|---|
| 城市扩展 | CLUD | 2000年、2010年、 2020年 | 矢量 | 中国科学院地理科学与资源研究所 |
| 历史图件 | 1916年 1949年、1978年 | - | 京都市内外城地图[37] 《中国城市地图集》[38] | |
| Landsat系列遥感影像 | 1972—2020年 | 80 m栅格 | http://glovis.usgs.gov/ | |
| HJ-A/B | 2008—2020年 | 30 m栅格 | http://www.cresda.com/CN/ | |
| GF-1 | 2013—2020年 | 2~8 m栅格 | http://www.cresda.com/CN/ | |
| 锁眼卫星遥感影像 | 1959—1986年 | 0.6 m栅格 | http://earthexplorer.ugus.gov/ | |
| 人口经济 | 人口数据 | 1916—1949年 | - | 参考文献[40] |
| 1949—2020年 | - | 《北京市统计年鉴》[34]《新中国六十年统计资料汇编》[39] | ||
| GDP数据 | 1949—2020年 | - | 北京市宏观经济与社会发展基础数据库、《新中国六十年统计资料汇编》[39] | |
| 气象要素 | 气温数据 | 1916—2020年 | - | 北京市气象探测中心 |
| 降水数据 | 1916—2020年 | - | 北京市气象探测中心 | |
| 再分析数据 | 1916—2015年 | 1°栅格 | https://www.psl.noaa.gov/data/gridded/reanalysis/ | |
| 辐射通量 | 观测数据 | 2011年12月—2012年11月 | 站点数据 | Kuang et al., 2020[41] |
表2 1916—2020年北京市城市扩展Tab. 2 Statistics on urban expansion in Beijing from 1916 to 2020 |
| 时段 | 1916—1949年 | 1949—1978年 | 1978—2000年 | 2000—2010年 | 2010—2020年 | 1916—2020年 |
|---|---|---|---|---|---|---|
| 城市土地面积(km2) | 35.31 | 112.54 | 466.06 | 1038.07 | 1739.24 | 2312.14 |
| 城市扩展面积(km2) | 77.23 | 353.52 | 572.01 | 701.17 | 572.89 | 2276.83 |
| 城市扩展速率(km2/a) | 2.34 | 12.19 | 26.00 | 70.12 | 57.29 | 21.89 |
| 城市扩展强度(%) | 0.01 | 0.07 | 3.49 | 4.26 | 3.49 | 0.13 |
表3 2012年北京市城市建筑与绿地地表参数观测[41]Tab. 3 Observation of surface radiation fluxes of urban buildings and green spaces in 2012[41] |
| Rn(W/m2) | 反照率 | LE/Rn | H/Rn | G/Rn | 波文比 | |||||||||
|---|---|---|---|---|---|---|---|---|---|---|---|---|---|---|
| 白天 | 夜间 | 白天 | 夜间 | 白天 | 夜间 | 白天 | 夜间 | 白天 | 夜间 | 白天 | 夜间 | |||
| 冬 | 建筑 | 37.27 | -72.76 | 0.23 | 0.00 | 0.47 | -0.27 | 0.47 | 0.01 | 0.23 | 0.25 | 0.99 | -0.04 | |
| 绿地 | 67.42 | -41.34 | 0.19 | 0.03 | 0.09 | -0.05 | 0.56 | 0.32 | -0.06 | 0.19 | 5.96 | -6.54 | ||
| 春 | 建筑 | 156.52 | -80.36 | 0.26 | 0.03 | 0.05 | -0.10 | 0.28 | -0.05 | 0.18 | 0.40 | 5.71 | 0.49 | |
| 绿地 | 206.62 | -33.84 | 0.19 | 0.08 | 0.31 | -0.27 | 0.23 | 0.39 | 0.06 | 0.05 | 0.75 | -1.41 | ||
| 夏 | 建筑 | 179.67 | -61.11 | 0.24 | 0.07 | 0.05 | -0.23 | 0.22 | -0.11 | 0.18 | 0.50 | 4.34 | 0.50 | |
| 绿地 | 238.68 | -21.68 | 0.18 | 0.07 | 0.49 | -0.72 | 0.11 | 0.32 | 0.05 | 0.11 | 0.22 | -0.45 | ||
| 秋 | 建筑 | 96.12 | -74.32 | 0.23 | 0.01 | 0.10 | -0.12 | 0.21 | 0.04 | 0.19 | 0.32 | 2.15 | -0.36 | |
| 绿地 | 147.05 | -38.28 | 0.18 | 0.03 | 0.43 | -0.19 | 0.17 | 0.14 | -0.02 | 0.27 | 0.39 | -0.75 | ||
| 全年 | 建筑 | 117.40 | -72.14 | 0.24 | 0.03 | 0.17 | -0.18 | 0.30 | -0.03 | 0.19 | 0.37 | 3.30 | 0.15 | |
| 绿地 | 164.94 | -33.79 | 0.19 | 0.05 | 0.33 | -0.31 | 0.27 | 0.29 | 0.01 | 0.15 | 1.83 | -2.29 | ||
表4 北京市气温变化情况比较Tab. 4 Comparison of temperature changes in Beijing and other cities |
| [1] |
|
| [2] |
[匡文慧, 刘纪远, 邵全琴, 等. 区域尺度城市增长时空动态模型及其应用. 地理学报, 2011, 66(2): 178-188.]
|
| [3] |
[秦大河, 陈振林, 罗勇, 等. 气候变化科学的最新认知. 气候变化研究进展, 2007, 3(2): 63-73.]
|
| [4] |
|
| [5] |
|
| [6] |
[崔耀平, 刘纪远, 张学珍, 等. 京津唐城市群土地利用变化的区域增温效应模拟. 生态学报, 2015, 35(4): 993-1003.]
|
| [7] |
|
| [8] |
|
| [9] |
|
| [10] |
|
| [11] |
|
| [12] |
IPCC. Climate Change 2013. The Physical Science Basis. Cambridge: Cambridge University Press, 2013.
|
| [13] |
National Climate Center. Blue Book on Climate Change in China 2021. Beijing: Science Press, 2021.
[中国气象局气候变化中心. 中国气候变化蓝皮书(2021). 北京: 科学出版社, 2021.]
|
| [14] |
|
| [15] |
|
| [16] |
[严中伟, 丁一汇, 翟盘茂, 等. 近百年中国气候变暖趋势之再评估. 气象学报, 2020, 78(3): 370-378.]
|
| [17] |
|
| [18] |
|
| [19] |
|
| [20] |
|
| [21] |
|
| [22] |
[胡庆芳, 张建云, 王银堂, 等. 城市化对降水影响的研究综述. 水科学进展, 2018, 29(1): 138-150.]
|
| [23] |
|
| [24] |
|
| [25] |
|
| [26] |
|
| [27] |
|
| [28] |
[李宇, 周德成, 闫章美, 等. 中国主要城市的城市化对局地增温的贡献. 环境科学, 2022, 43(5): 2822-2830.]
|
| [29] |
[金义蓉, 胡庆芳, 王银堂, 等. 快速城市化对上海代表站降水的影响. 河海大学学报(自然科学版), 2017, 45(3): 204-210.]
|
| [30] |
|
| [31] |
|
| [32] |
|
| [33] |
|
| [34] |
Beijing Municipal Bureau of Statistics. Beijing Statistical Year Book 2021. Beijing: China Statistics Press, 2022.
[北京市统计局. 北京统计年鉴2021. 北京: 中国统计出版社, 2022.]
|
| [35] |
[刘纪远, 匡文慧, 张增祥, 等. 20世纪80年代末以来中国土地利用变化的基本特征与空间格局. 地理学报, 2014, 69(1): 3-14.]
|
| [36] |
[匡文慧, 张树文, 杜国明, 等. 2015—2020年中国土地利用变化遥感制图及时空特征分析. 地理学报, 2022, 77(5): 1056-1071.]
|
| [37] |
National Library of China, Surveying and Mapping Press. Beijing in Ancient Maps. Beijing: Surveying and Mapping Press, 2010.
[中国国家图书馆, 测绘出版社. 北京古地图集. 北京: 测绘出版社, 2010.]
|
| [38] |
Editorial Committee of Atlas of Cities of China. Atlas of Cities of China (Vol. 1). Beijing: Sinomap Press, 1994.
[中国城市地图集编辑委员会. 中国城市地图集(上册). 北京: 中国地图出版社, 1994.]
|
| [39] |
Department of Comprehensive Statistics of National Bureau of Statistics. China Compendium of Statistics 1949-2008. Beijing: China Statistics Press, 2010.
[国家统计局国民经济综合统计司. 新中国六十年统计资料汇编. 北京: 中国统计出版社, 2010.]
|
| [40] |
[高文超. 1912—1948年北京人口空间分布格局变动及原因研究. 人口学刊, 2018, 40(6): 62-74.]
|
| [41] |
|
| [42] |
|
| [43] |
[李庆祥,
|
| [44] |
[张雪梅, 陈莉, 姬菊枝, 等. 1881—2010年哈尔滨市气候变化及其影响. 气象与环境学报, 2011, 27(5): 13-20.]
|
| [45] |
[刘盛和, 吴传钧, 沈洪泉. 基于GIS的北京城市土地利用扩展模式. 地理学报, 2000, 55(4): 407-416.]
|
| [46] |
[王琦安, 施建成, 匡文慧, 等. 全球生态环境遥感监测2020年度报告: 全球城市扩展与土地覆盖变化. http://old.chinageoss.cn/geoarc/2020/C/index.html.]
|
| [47] |
[简新华, 黄锟. 中国城镇化水平和速度的实证分析与前景预测. 经济研究, 2010, 45(3): 28-39.]
|
| [48] |
[陈斌开, 林毅夫. 发展战略、城市化与中国城乡收入差距. 中国社会科学, 2013(4): 81-102.]
|
| [49] |
[曹爱丽, 张浩, 张艳, 等. 上海近50年气温变化与城市化发展的关系. 地球物理学报, 2008, 51(6): 1663-1669.]
|
| [50] |
[缪启龙, 丁园圆, 王勇, 等. 气候变暖对中国热量资源分布的影响分析. 自然资源学报, 2009, 24(5): 934-944.]
|
| [51] |
|
| [52] |
|
| [53] |
[翟俊, 邵全琴, 刘纪远. 内蒙古高原土地利用/覆被变化对气温变化的影响分析. 自然资源学报, 2014, 29(6): 967-978.]
|
| [54] |
|
| [55] |
|
| [56] |
|
| [57] |
|
| [58] |
|
| [59] |
|
| [60] |
|
| [61] |
|
| [62] |
|
| [63] |
|
| [64] |
[郑祚芳. 北京地区夏季降水与气温的对应关系. 气象, 2016, 42(5): 607-613.]
|
| [65] |
|
| [66] |
|
| [67] |
|
| [68] |
|
| [69] |
IPCC. Climate change 2021. The Physical Science Basis. https://www.ipcc.ch/report/ar6/wg1/#FulReport.
|
| [70] |
|
| [71] |
|
| [72] |
|
| [73] |
[周雅清, 任国玉. 城市化对华北地区最高、最低气温和日较差变化趋势的影响. 高原气象, 2009, 28(5): 1158-1166.]
|
| [74] |
|
| [75] |
|
| [76] |
|
| [77] |
|
/
| 〈 |
|
〉 |
