
青藏高原地表大气氧含量空间格局及自然地带“三维分异”的新认识
收稿日期: 2022-10-08
修回日期: 2023-02-10
网络出版日期: 2023-03-27
基金资助
第二次青藏高原综合科学考察研究(2019QZKK0606)
Spatial pattern of oxygen concentration and "three-dimensional zonation" in the natural zone on the Qinghai-Tibet Plateau
Received date: 2022-10-08
Revised date: 2023-02-10
Online published: 2023-03-27
Supported by
The Second Tibetan Plateau Scientific Expedition and Research Program(2019QZKK0606)
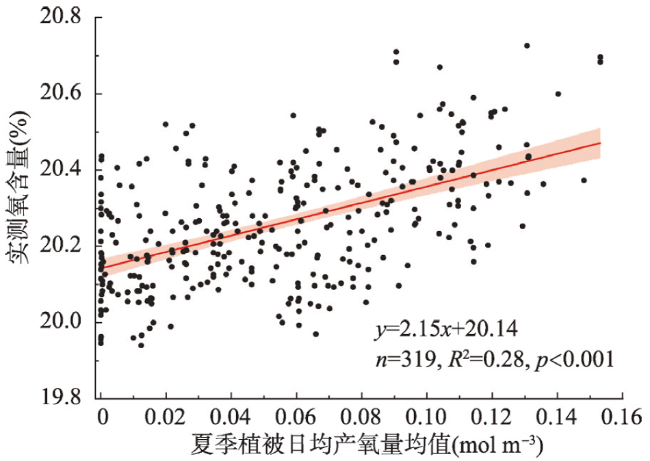
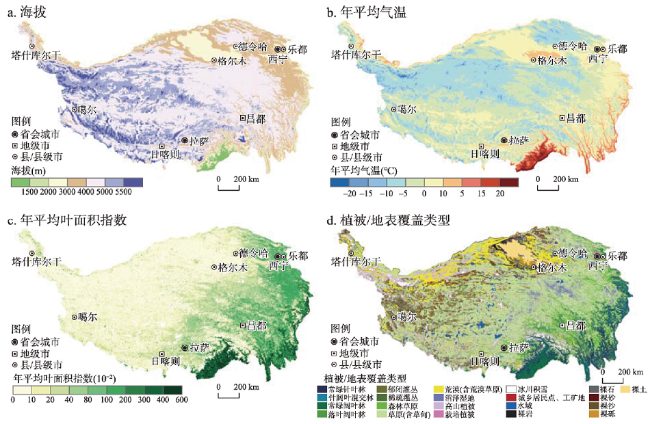
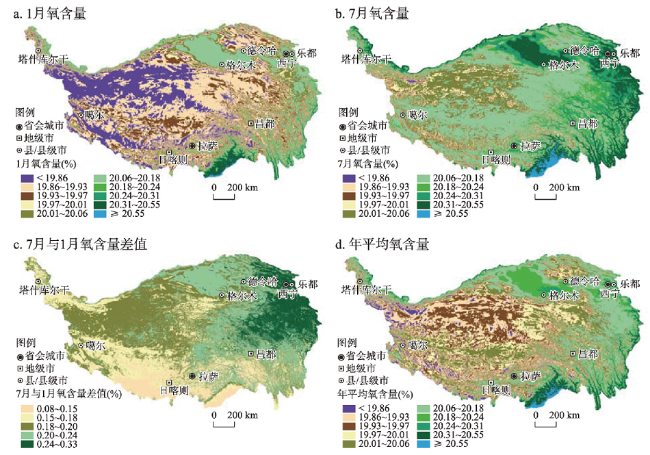
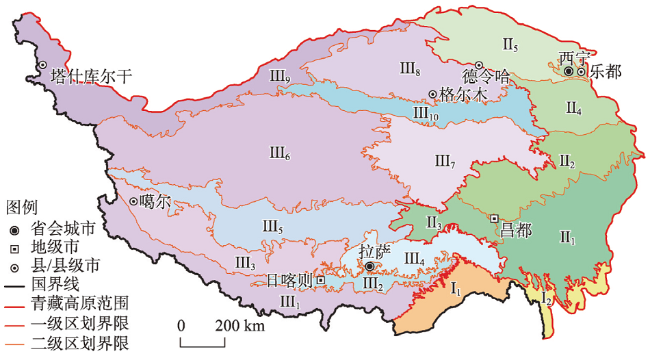
青藏高原地表氧含量是海拔、地势、气候、水域、植被、土壤综合作用的结果,其中海拔、气温、植被覆盖度与叶面积指数的相对贡献分别为-39.58%、35.50%、24.92%。青藏高原地表氧含量首先呈现东南向西北递减的差异,这主要与依赖水热条件的植被产氧有关;其次是东西延伸、南北更替的差异,这主要与依赖气温与地势的大气压对氧含量的影响有关;第三是随海拔变化的垂直分异,这主要与依赖地势、气温的大气压,以及依赖温度与水分的植被产氧有关。地表氧含量可以定量展现地表自然地理特征的时空格局,据此,本文把青藏高原自然地带划分为3个一级区、17个二级区,即:东南部亚热带森林—森林草原区域,地表年均氧含量为20.35%,7月平均值为20.45%,1月平均值为20.27%,含2个二级区;东部温带森林—草原—草甸区域,地表年均氧含量为20.10%,7月平均值为20.23%,1月平均值为20.00%,含5个二级区;西部寒带温带草原—荒漠—草甸区域,地表年均氧含量为20.00%,7月平均值为20.10%,1月平均值为19.91%,含10个二级区。
史培军 , 胡小康 , 陈彦强 , 张慧 , 杨合仪 , 胡金鹏 , 杨雯倩 , 贾伟 , 马伟东 , 姜璐 , 张钢锋 , 蒲小燕 , 郝力壮 , 王静爱 , 朱文泉 , 马永贵 , 唐海萍 , 陈志 . 青藏高原地表大气氧含量空间格局及自然地带“三维分异”的新认识[J]. 地理学报, 2023 , 78(3) : 532 -547 . DOI: 10.11821/dlxb202303002
The earth surface oxygen concentration on the Qinghai-Tibet Plateau is the result of the combined effect of multi-factors, such as elevation, topography, climate, water, vegetation, and soil, among them, the relative contributions of altitude, temperature, vegetation coverage and leaf area index are -39.58%, 35.50%, and 24.92%, respectively. The earth surface oxygen concentration on the plateau primarily shows the difference from southeast to northwest, which is mainly related to the effect of vegetation on oxygen production depending on precipitation; secondly shows the difference on east-west extension and north-south turnover, which is mainly related to the effect of atmospheric pressure on relative oxygen concentration depending on temperature and terrain; thirdly shows the vertical zonation, which is mainly related to the effect of atmospheric pressure on the relative oxygen concentration depending on the terrain and temperature, bond with the effect of vegetation on oxygen production depending on temperature and precipitation. The earth surface oxygen concentration can quantitatively reveal the spatio-temporal pattern of the physiographical characteristics of the earth surface. Accordingly, we divide the natural zone of the Qinghai-Tibet Plateau into 3 first-grade regions and 17 second-grade zones. In the southeastern subtropical forest-forest steppe region, including 2 second-grade zones, the annual average oxygen concentration is 20.35%, the average oxygen concentration in July is 20.45%, and the average oxygen concentration in January is 20.27%. In the eastern temperate forest-steppe region, including 5 second-grade zones, the annual average oxygen concentration is 20.10%, the average oxygen concentration in July is 20.23%, and the average oxygen concentration in January is 20.00%. In the western cold temperate grassland-desert-steppe region, including 10 second-grade zones, the annual average oxygen concentration is 20.00%, the average oxygen concentration in July is 20.10%, and the average oxygen concentration in January is 19.91%.
表1 不同年份青藏高原夏、冬(秋)季氧含量统计特征Tab. 1 Statistical characteristics of oxygen concentration on Qinghai-Tibet Plateau in summer and winter |
| 季节 | 年份 | 样本量(个) | 氧含量(%) | 与20.946%的差异 | |||||
|---|---|---|---|---|---|---|---|---|---|
| 最小值 | 最大值 | 平均值 | 标准差 | 显著性水平 | 95%置信区间 | ||||
| 夏季 | 2017 | 65 | 20.37 | 21.67 | 20.72 | 0.26 | 0.001 | 20.65~20.78 | |
| 2018 | 80 | 19.94 | 20.66 | 20.19 | 0.16 | 0.001 | 20.15~20.22 | ||
| 2019 | 113 | 20.02 | 20.78 | 20.37 | 0.16 | 0.001 | 20.34~20.40 | ||
| 2020 | 176 | 19.97 | 20.73 | 20.30 | 0.18 | 0.001 | 20.28~20.33 | ||
| 2021 | 95 | 19.91 | 20.41 | 20.20 | 0.10 | 0.001 | 20.18~20.22 | ||
| 2022 | 186 | 19.47 | 20.82 | 20.38 | 0.31 | 0.001 | 20.34~20.43 | ||
| 冬(秋)季 | 2019 | 53 | 19.98 | 20.43 | 20.16 | 0.11 | 0.001 | 20.13~20.19 | |
| 2021 | 39 | 19.77 | 20.24 | 20.01 | 0.12 | 0.001 | 19.97~20.05 | ||
表2 格点尺度青藏高原1月、7月氧含量及年均各分级面积占比(%)Tab. 2 Area proportion of oxygen concentration in different grades on the Qinghai-Tibet Plateau (%) |
| 分级 | ≤19.86 | 19.86~19.93 | 19.93~19.97 | 19.97~20.01 | 20.01~20.06 | 20.06~20.18 | 20.18~20.24 | 20.24~20.31 | 20.31~20.55 | >20.55 |
|---|---|---|---|---|---|---|---|---|---|---|
| 1月 | 20.13 | 28.57 | 14.23 | 8.59 | 8.62 | 14.42 | 2.38 | 1.16 | 1.73 | 0.17 |
| 7月 | 0.23 | 1.18 | 2.47 | 6.24 | 17.09 | 36.19 | 9.93 | 10.75 | 14.36 | 1.56 |
| 年均 | 2.62 | 12.47 | 16.27 | 15.76 | 17.04 | 19.54 | 8.03 | 3.86 | 3.83 | 0.57 |
表3 青藏高原自然带海拔、气温、叶面积指数和氧含量特征Tab. 3 Elevation, temperature, leaf area index, and oxygen concentration in different natural zones on the Qinghai-Tibet Plateau |
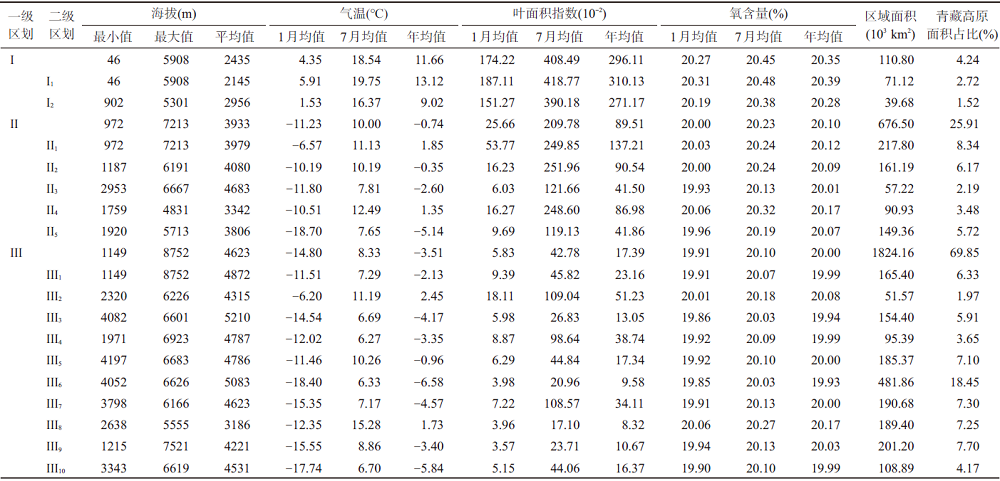 |
注:① Ⅰ 东南部亚热带森林—森林草原区域:Ⅰ1 藏东南暖热湿润山地河谷森林—森林草原带,Ⅰ2 横断山区南部暖温湿润河谷森林—森林草原带;Ⅱ 东部温带森林—草原—草甸区域:Ⅱ1 藏东—横断山区北部温暖湿润半湿润森林—草原带,Ⅱ2 川西高原温凉半湿润灌丛草原—草甸带,Ⅱ3 那曲高原温冷半湿润半干旱草原—草甸带,Ⅱ4 青东—甘南高原温凉半湿润半干旱森林草原—草原带,Ⅱ5 祁连山温冷半干旱半湿润森林草原—草甸带;Ⅲ 西部寒带温带草原—荒漠—草甸区域:Ⅲ1 喜马拉雅山地温冷半湿润半干旱灌丛草原—草甸带,Ⅲ2 雅鲁藏布江高原河谷温凉半湿润半干旱灌丛草原—农田带,Ⅲ3 冈底斯山寒冷半干旱干旱灌丛草原带,Ⅲ4 念青唐古拉山寒冷半干旱灌丛草原—草甸带,Ⅲ5 藏北层状高原温冷半干旱干旱灌丛草原—荒漠草原带,Ⅲ6 羌塘波状高原寒冷干旱半干旱荒漠—灌丛草原—草甸带,Ⅲ7 青南高原温冷半干旱草原—草甸带,Ⅲ8 柴达木盆地温暖干旱半干旱荒漠—荒漠草原带,Ⅲ9 喀喇昆仑山—昆仑山—阿尔金山温凉干旱荒漠—荒漠草原—草甸带,Ⅲ10 东昆仑山—阿尼玛卿山温冷半干旱干旱草原、荒漠草原—草甸带;② 表中气温数据源于参考文献[23],各指标面积数据占比基于青藏高原范围和面积计算[25]。 |
表4 青藏高原自然带土地利用和覆盖类型特征Tab. 4 Type of land use and land cover in different natural zones on the Qinghai-Tibet Plateau |
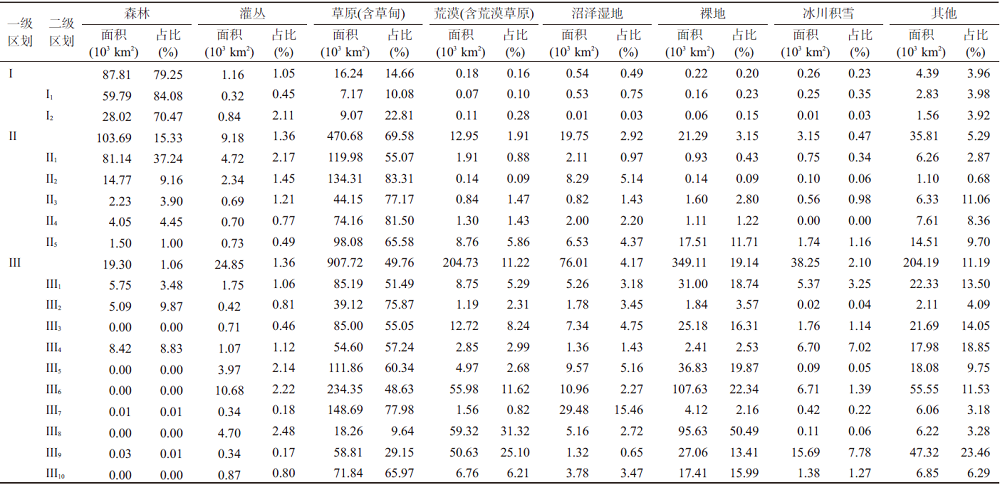 |
注:① Ⅰ 东南部亚热带森林—森林草原区域:Ⅰ1 藏东南暖热湿润山地河谷森林—森林草原带,Ⅰ2 横断山区南部暖温湿润河谷森林—森林草原带;Ⅱ 东部温带森林—草原—草甸区域:Ⅱ1 藏东—横断山区北部温暖湿润半湿润森林—草原带,Ⅱ2 川西高原温凉半湿润灌丛草原—草甸带,Ⅱ3 那曲高原温冷半湿润半干旱草原—草甸带,Ⅱ4 青东—甘南高原温凉半湿润半干旱森林草原—草原带,Ⅱ5 祁连山温冷半干旱半湿润森林草原—草甸带;Ⅲ 西部寒带温带草原—荒漠—草甸区域:Ⅲ1 喜马拉雅山地温冷半湿润半干旱灌丛草原—草甸带,Ⅲ2 雅鲁藏布江高原河谷温凉半湿润半干旱灌丛草原—农田带,Ⅲ3 冈底斯山寒冷半干旱干旱灌丛草原带,Ⅲ4 念青唐古拉山寒冷半干旱灌丛草原—草甸带,Ⅲ5 藏北层状高原温冷半干旱干旱灌丛草原—荒漠草原带,Ⅲ6 羌塘波状高原寒冷干旱半干旱荒漠—灌丛草原—草甸带,Ⅲ7 青南高原温冷半干旱草原—草甸带,Ⅲ8 柴达木盆地温暖干旱半干旱荒漠—荒漠草原带, Ⅲ9 喀喇昆仑山—昆仑山—阿尔金山温凉干旱荒漠—荒漠草原—草甸带,Ⅲ10 东昆仑山—阿尼玛卿山温冷半干旱干旱草原、荒漠草原—草甸带;② 植被与土地覆盖数据源于参考文献[24],各指标面积数据占比基于青藏高原范围和面积[25]计算。 |
| [1] |
[程国栋, 赵林, 李韧, 等. 青藏高原多年冻土特征、变化及影响. 科学通报, 2019, 64(27): 2783-2795.]
|
| [2] |
[姚檀栋. 泛第三极环境变化与对策. 中国科学院院刊, 2018, 33 (Suppl.2): 44-46.]
|
| [3] |
[张新时. 西藏植被的高原地带性. 植物学报, 1978, 20(2): 140-149.]
|
| [4] |
[郑度, 张荣祖, 杨勤业. 试论青藏高原的自然地带. 地理学报, 1979, 34(1): 1-11.]
|
| [5] |
|
| [6] |
[史培军, 陈彦强, 张安宇, 等. 青藏高原大气氧含量影响因素及其贡献率分析. 科学通报, 2019, 64(7): 715-724.]
|
| [7] |
[史培军, 陈彦强, 马恒, 等. 再论青藏高原近地表大气相对氧含量影响因素的贡献率. 科学通报, 2021, 66(31): 4028-4035.]
|
| [8] |
|
| [9] |
|
| [10] |
|
| [11] |
China Meteorological Administration. QX/T 50-2007 Specifications for Surface Meteorological Observation (Part 6): Measurement of Air Temperature and Humidity. Beijing: China Meteorological Press, 2007.
[中国气象局. QX/T 50-2007地面气象观测规范(第6部分): 空气温度和湿度观测. 北京: 气象出版社, 2007.]
|
| [12] |
|
| [13] |
[张颖. 青藏高原植被类型与近地表大气氧含量关系探讨[D]. 北京: 北京师范大学, 2022.]
|
| [14] |
[陈彦强. 青藏高原近地表大气氧含量空间格局及其人口缺氧健康风险分析[D]. 北京: 北京师范大学, 2022.]
|
| [15] |
[于德永, 史培军, 周涛, 等. 青海省生态系统服务价值总量及时空差异的量化. 北京: 科学出版社, 2022.]
|
| [16] |
[马伟东. 气候变化对青藏高原青稞种植的影响评估[D]. 西宁: 青海师范大学, 2022.]
|
| [17] |
[杜军, 刘依兰, 建军, 等. 气候变化对西藏青稞种植的影响研究. 北京: 气象出版社, 2017.]
|
| [18] |
|
| [19] |
[王志科, 张嘉宸, 李廷山, 等. 高海拔地区风电场建设对环境的影响及水土保持对策探讨: 以共和县切吉乡1000 MW风电项目为例. 绿色科技, 2020(20): 140-142.]
|
| [20] |
[李培都, 高晓清. 光伏电站对生态环境气候的影响综述. 高原气象, 2021, 40(3): 702-710.]
|
| [21] |
|
| [22] |
[程维明, 周成虎, 李炳元, 等. 中国地貌区划理论与分区体系研究. 地理学报, 2019, 74(5): 839-856.]
|
| [23] |
|
| [24] |
[张慧, 赵涔良, 朱文泉. 基于多源数据产品集成分类制作的青藏高原现状植被图. 北京师范大学学报(自然科学版), 2021, 57(6): 816-824.]
|
| [25] |
[张镱锂, 李炳元, 郑度. 论青藏高原范围与面积. 地理研究, 2002, 21(1): 1-8.]
|
| [26] |
[吴绍洪, 潘韬, 刘燕华, 等. 中国综合气候变化风险区划. 地理学报, 2017, 72(1): 3-17.]
|
| [27] |
[郑度. 青藏高原自然地域系统研究. 中国科学: 地球科学, 1996, 26(4): 336-341.]
|
| [28] |
[杨玮, 何金海, 王盘兴, 等. 近42年来青藏高原年内降水时空不均匀性特征分析. 地理学报, 2011, 66(3): 376-384.]
|
| [29] |
[龚成麒, 董晓华, 魏冲, 等. 1978—2018年青藏高原降水区划及各区降水量时空演变特征. 水资源与水工程学报, 2022, 33(5): 96-108.]
|
| [30] |
[郑度, 葛全胜, 张雪芹, 等. 中国区划工作的回顾与展望. 地理研究, 2005, 24(3): 330-344.]
|
/
| 〈 |
|
〉 |
